Measuring the Efficiency of Public Health
Services by DEA1
Neda Vitezić
University of Rijeka, Faculty of Economics; Rijeka, Croatia [email protected]
Alemka Šegota
University of Rijeka, Faculty of Economics; Rijeka, Croatia [email protected]
Stanka Setnikar Cankar
University of Ljubljana, Faculty of Administration; Ljubljana, Slovenia [email protected]
ABSTRACT
Efficiency is one of the most important principles in public health services due to the strive for rationality and, at the same time, the need to strengthen quality. The aim of this research is to explore and analyse the suitability of DEA to measure the efficiency of a range of different services offered by institutes of public health in Croatia. DEA is a technique that is used to measure relative efficiency. It is traditionally used for non profit organizations. This technique has so far mostly been used in assessing solely the efficiency of hospitals and not other public health preventive services. For that reason, the objective of this study is to identify units within one department of public health services that are relatively inefficient and to set targets for them based on the activities of units classified as efficient. We used data for 12 units (DMUs) for the period of two years, defining common inputs and outputs. The results obtained show projections of efficient and inefficient DMUs, projection of inefficient units at efficient frontier allows comparison between most similar units by efficiency and provides information on controllable inputs and outputs. This research has proven that relative efficiency obtained with DEA can be a useful tool in assessing efficiency of public health services on level of one institution and could support management decision-making process.
Keywords: public health services, performance measurement, efficiency, DEA JEL: H51
1 This work has been fully supported by the Croatian Science Foundation under project IP- 2014-09-8235 – A Model for Measuring the Efficiency of Public Health Services (2015–2019).
1 Introduction
The World Health Report 2000 called attention to the importance of efficiency in all functions of a health system and in ultimately achieving the goals of health improvement, responsiveness and fairness in financing. Technical efficiency refers to the extent that resources are being wasted. It measures the degree of producing the maximum amount of outputs from a given amount of inputs or, conversely, using the minimum amount of inputs to produce a given output. Almost everywhere public health system is complex because of many different stakeholders − patients and other types of users and providers, regulators, government and others linked by accountability relationship. This requires individual responsibility and accountability in managing funds and provision of information.
Public health was first defined by Yale Professor Winslow as ‘the science and art of preventing disease, prolonging life and promoting health through the organized efforts…’ (1920, p. 183). This indicates its basic feature that is prevention, not treatment, as well as addressing health problems on the community level, not at the individual level. Today all modern systems of health are faced with the problem of how in condition of limited resources to ensure efficient, effective and equitable health care for all citizens. In order to satisfy this statement the way of financing and accountability in funds managing is essential. Usually health care reforms are conducted with the objectives to rationalise costs in order to make health services available to everyone but not to reduce quality of health services. It is well known that the public sector and the state as the greatest consumers of public revenues (Thornhill, 2006) are constantly subject to pressure to increase rationality. In this process, improvement of efficiency and raising the quality of public services is constantly pointed out (Webb, 2010), so that market principles are introduced into the public sector.
This paper deals with public health services whose objectives are improvements of population’s health. Improvements should be measured and therefore include a series of efficiency indicators although still not much effectiveness measures. The health system is still in the early days of performance measurement and there remains an enormous agenda for improving its effectiveness (Smith et al., 2012). In the public health services the efficiency will be expressed as relationship between specific products or services and resources that are used for them. Departments of the public health institutions will be efficient if they can achieve the maximum result (output) with available resources (inputs) or reduce investments in order to achieve a given result.
For that reason in this study we investigate the efficiency of department within the institution dealing with public health services in Croatia. We chose one of the Croatian Institutes of Public Health whose primary tasks are monitoring, analysis, and evaluation of the health of the population,
as well as planning, proposing, and implementing measures for the preservation and enhancement of the population’s health. These tasks are accomplished through activities undertaken on the state and county levels, by way of cooperation of county-level institutes of public health. Institutes of public health (the Croatian Institute of Public Health and 20 county-level institutes) carry out specific tasks with the goal of implementing healthcare politics and a new healthcare system. Their role is to act as a point of contact between the Croatian healthcare services and international institutions, to ensure the implementation of new knowledge and technologies in practice, and to transfer knowledge, accomplishments, and information about health and health protection to the international community as well (e.g. to the World Health Organization, UNICEF, and OECD).
The aim of this research is to investigate whether by using the DEA the public health services efficiency could be improved. The research is empirical − conducted in the Institute of the public health in one of the Croatian counties which has various departments (epidemiology, ecology, social medicine, microbiology, etc.). For the purposes of the study, Data Envelopment Analysis (DEA) was applied in the Department of Ecology, which has 12 units. We put the following research question: could the results obtained by DEA, which has been confirmed as very useful by numerous previous researches, be applicable to the units within public health services?
For a long time mostly all researches using DEA method have been applied in health-care i.e. hospitals. The first empirical test was given by Sherman (1984) who applied DEA to a group of teaching hospitals. Also others like Morey, Fine and Loree (1990) compare and analyse efficiency in 60 hospitals, and Finkler and Wirtschafter (1993) in 9 hospitals. Lynch and Ozcan (1994) used DEA to construct efficiency index. So, DEA has been proved as a useful tool for efficiency and effectiveness measures (Szczepura, Davies, Fletcher, & Boussofiane, 1993). However, there is no research or it is very rare, about applying DEA to other health services concerning prevention.
This empirical research is the first one in Croatia and elsewhere that explores the efficiency of the public health services within Institute of public health by using DEA. So far, the DEA has been used only for testing the relative efficiency in hospitals (Rabar, 2009, 2010). The results of this research are valuable for overall performance evaluation regarding strategy and targets and could be applicable to the other 20 institutes of public health in Croatia. The paper is organized as follows: we first briefly introduce the concept of public health services, part two explains the problem of measuring the efficiency due to the diversity of services, part three is methodology with explanation of two used models of DEA, part four is empirical analysis using DEA method where we explain the obtained results, part five is conclusion where we summarize the contribution of the paper.
2
The Problem of Measuring the Efficiency of Various
Public Health Services
Public health services are usually conducted by institutes or agencies which as professional prevention facilities organise activities for protection and improvement of population’s health, for reduction of mortality, premature
death, and disability. Because of their role in the society, method of financing,
variety of users and stakeholders their performance should be measured. Fundamental role of performance measurement is to ‘monitor, evaluate and communicate the extent to which various aspects of the health system meet key objectives’ (Smith, Mossialos, Papanicolas, & Leatherman, 2009, p. 3), because ‘assessment, policy development and assurance are the core functions for public health agencies’ (Lesneski, 2009, p. 16). Performance measurement system comprises a wide range of data depending on convenience,
accessibility and reporting system needed. Usually financial reporting is most
common due to the availability of data and rationality requirements. But the rationality in spending funds along with the need to increase the quality of services requires developed performance management and measurement system. In other words, the prerequisite is developed strategic planning,
i.e. existence of setting measurable goals, defined targeted measures and
relevant indicators.
The rationality as a principle in performing is measured by many efficiency
indicators which have to be properly chosen. Due to the various activities
and different services the problem of measuring the efficiency in the public
health sector is complex. Because, in order to improve the health services the
first issue should be meeting the needs of users, responsible management of resources and staff and efficiently organizing business processes. This
requires measurement of the variables that describe true nature of service
production (Ozcan, 2014, p. 14). Therefore the second problem is diversity
of ‘input’, ‘output’ and ‘outcome’ expressions. Input resources are generally
referred to as physical, human, and financial. Many measures mostly used
in public sector organisations are based on input-oriented perspective
(economy), usually expressed in terms of cost, budget and stuffing tools
(Boland & Flower, 2000). Comparison can be made with similar types of
organisations or units using specific measures such as cost per program,
unit cost per employee, used resources per program, etc. Any change in
these performance measures reflects ‘economy’ with which the organisation
uses its resources. But this allows little information about the operational process within the organisation, except for some benchmarking analysis. Output measures are easily measured in quantitative terms such as number of resolving medical problems, number of educational programs, number of obese children, degree of air pollution, price of some prevention programs and others. Organisations usually use calculation of output/input ratio to
measure how efficiently an organisation converts its inputs into outputs. This provides very little information on effectiveness or value of these outputs.
DEA method we used in the research required performance measures classified into inputs and outputs in order to compare the efficiency of a set of units. The efficiency score of each unit is represented as a ratio of the total weighted outputs to the total weighted inputs. The most difficult step in the research was to select inputs and outputs which are equally important in order to claim that a unit is relatively efficient. The aim was to analyse relative efficiency of 12 units within the department of Ecology in order to identify inefficient units and improve their performance, using the best one as benchmark.
3 Methodology
The efficiency evaluation is vital for success of any reform program. Data Envelopment Analysis (DEA), since its invention in 1978, has been one of the most widely used decision-making tools. Since DEA requires very few assumptions about converting inputs into outputs it has opened up the possibilities for use in various areas such as banking, engineering, management, health care, education, sports, retailing and so on. Researchers in a number of fields have quickly recognized that it is excellent and easily used methodology for modelling operational processes for performance evaluations.
‘The increasing efforts of rich and developing countries to improve the quality and quantity of health services call for an objective and accurate assessment of the performance of their health systems. Both policy makers and citizens demand the best possible outcomes from the health system, given the considerable amount of resources devoted to it’ (González, Cárcaba, & Ventura, 2010, p. 338).
Data envelopment analysis is nonparametric method that ‘envelops’ observations in order to identify a ‘frontier’, which contains the ‘best’ entities that are to be evaluated. It is a mathematical programming method for evaluating the relative efficiency of different units which operate in similar conditions and convert inputs into outputs. It identifies the sources and amounts of inefficiencies and shows for inefficient unit how some of inputs and outputs can be improved to become relative efficient. DEA is an excellent methodology for modelling operational processes when we do not know the functional form of converting inputs into outputs. Its empirical orientation and minimization of a priori assumptions has resulted in its use in a number of studies involving efficiency of health systems in different countries: Iran (Ghotbuee, Hemati, & Fateminezhad, 2012), India (Partha, Dhar, & Bhattacharya, 2012), Italy (De Nicola, Gitto, & Mancuso, 2011; Nuti, Daraio, Speroni, & Vainieri, 2011), Malta (Ebejer & Mandl, 2009), South Africa (Ngoie & Koch, 2005).
There are two basic models of data envelopment analysis for measuring the efficiency of a DMU (decision making unit: organizations subject to evaluate as departments in our case) relative to similar DMUs in order to estimate
a ‘best practice’ frontier: CCR (constant returns to scale) and BCC (variable returns to scale). BCC-input-oriented model seems to be more appropriate than CCR because of variable returns to scale permission and also because we were interested to investigate possibilities of reduction the input amounts by as much as possible while keeping at least the present output level. Input orientation also assumes health care managers have more control over the inputs than over the total revenue. Within the frameweork of the current policy which fosters rationality through reduced expenditures, we estimate that the input orientation would be more appropriate.
3.1 BCC (Variable Returns-to-Scale) Model
Suppose there are n decision making units: DMU1, DMU2, … ,DMUn converting inputs (resources) in outputs (outcomes). If we select m inputs and
s outputs for DMUj then the input and output data can be represented as: (x1j, x2j, … , xmj) and (y1j, y2j, … , ysj). We solve the linear programming problem to obtain values for the input ‘weights’ and output ‘weights’. Given the data we measure the efficiency of each DMU once and need n optimizations. The following DEA model is an input-oriented BCC model where the inputs are minimized and the outputs are kept at their current levels. The BCC model evaluates the efficiency of DMUo (o = 1, 2, …, n) by solving following linear program (Cooper, Seiford, & Tone, 2007; Banker, Cooper, Seiford, & Zhu, 2011; Zhu, 2014):
subject to
Where DMUo represents one of the n DMUs under evaluation, xio and yro are the ith input and rth output for DMUo, respectively. Input weights are vi (i = 1, 2, …, m) and output weights are ur (r = 1, 2, …, s) .The optimal value is θ* ≤ 1. If θ* = 1 then the current input levels cannot be reduced, otherwise, if θ* < 1, then DMUo is dominated by the efficiency frontier. represents the input-oriented efficiency score of DMUo.
Definition of efficiency says that DMU is BCC-efficient if efficiency score equals 1 and all slacks are equal to 0. Slacks s-* and s+* represent the maximal input excesses and output shortfalls. In order to calculate and assess the returns to scale (RTS) we need to sum the λj weight values. If ∑λ < 1 then DMU exhibits increasing returns to scale (rates of return) (IRS): it means that proportional increase in one or more inputs cause greater than proportional increase in outputs. If ∑λ > 1 then DMU exhibits decreasing returns to scale: (DRS) proportional increase in one or more inputs cause less then proportional increase in outputs. Constant returns to scale (CRS) will have DMUs with ∑λ = 1 when proportional increase in one or more inputs cause proportional increase in outputs. For inefficient DMUs it is possible to find targets by projection values: these targets are the results of respective slack values added to proportional reduction amounts. To calculate the target values for inputs, the input value is multiplied with an optimal efficiency score, and then slack amounts are subtracted from this amount. If the DMU is inefficient it is possible to observe the benchmark DMUs: efficient units in reference set.
4 Implementation of DEA in the Croatian Institute of Public
Health – An Empirical Study
The main objective of the health care reform in Croatia is raising quality and availability of health care, prolongation of the expected life span and improvement of general health condition of the population (National Strategy of Health Care Development 2012–2020). Healthcare activities are organized into several levels of health protection: primary, secondary (county-level institutes of public health), and the level of healthcare institutes (Croatian Institute of Public Health). Croatian Institute for Public Health as organization on the national level together with 20 county-level institutes carry out specific tasks with the goal of implementing healthcare politics and a new healthcare system.
Data Envelopment Analysis (DEA) is a non-parametric technique used to measure the efficiency of decision making units (DMUs), converting the multiple inputs into multiple outputs. Widespread application of DEA has been seen in the health care (Boland & Fowler, 2000; Alexander, Busch, & Stringer, 2003; Cooper, Seiford, & Zhu, 2004; Afonso, Schuknecht, & Tanzi, 2006; Chyhan & Benneyan, 2008; Mirmirani, Li, & Ilacqua, 2008; Azizi, Behzadian, & Afshari, 2012).
In the research we have used DEA which allows determining the relative efficiency of each organizational unit within the department. We used data for the period of two years 2014 and 2015 which were collected in the department of controlling and internal audit. We decided to take the data for the two-years period because some inputs like investments give the effects in the coming years. Selected data i.e. inputs and outputs are reliable and comparable for all units within the department which is a prerequisite for DEA.
For the purpose of proving the possibility of measuring the efficiency of the public health institutions DEA method was carried out. We based our study on the example of the Institute of Environmental Health-Department of Ecology. This department provides for the prevention of people’s health related to different environment factors (water, air, food, soil). The department has 12 units: Department for quality control of outdoor air (ZEKZ), Department for control of drinking water and water in nature (ZEKV), Department of waste control and waste water (ZEKOV), Department of food control (ZEKN), Department for control of physical environmental factors (ZEKFO), Department for control of air emissions (ZEKEZ), Department of improving nutrition (ZEKP), Department of microbiology environment (ZEKO), Department of common analytical techniques (ZEAT), Department of biological monitoring and exposure (ZEKBM), Department of Ecotoxicology (ZEKE), Department for sampling of environmental samples (ZEKOU). Each of these departments has its own specific programs and projects that are financed in whole or in part from the budget and partly from the income earned by the Department of quality control of water to drink and water in the nature for market. Given to the variety of programs the primary task was to select inputs and outputs comparable and indicating the efficiency of each unit. We selected the following inputs and outputs:
• INPUTS: salary of employees, direct cost, investments, number of samples.
• OUTPUTS: total revenue, number of analysis.
Salary, direct cost, investment and revenue are expressed in monetary units and are comparable for all units in financial terms. Salaries are paid in accordance with the Colective agreement for health, direct costs include material costs, energy, transportation, various services and other costs. Investments are related to space, laboratiry and medical equipment, measurement and control devices, computerization and other expenditure. But for the purpose of measuring efficiency it was valuable to have natural expression of some inputs and outputs. For example, the number of samples is related to the different sort of material (water, air, food, blood etc.) The analysis considers the process of different type of tests over material.
We designed two models of Data Envelopment Analysis to estimate the relative efficiency of each of 12 units within Institute of public health services, because we wanted to take into account two different perspectives of efficiency measurement. Furthermore, due to the limited number of inputs and oputputs as a result of relatively small total number of units, we proposed two models with different combinations of inputs and outputs. Management of Institute helped us with their knowledge to include the factors (inputs and outputs) which provide the essential components. Namely, ‘The common way to determine the input and output items for the DEA model is to interview with organization officers and then to analyze the organization and management objectives and experiences’ (Lan, Chuang, & Chang, 2007).
4.1 BCC Model 1 (3 Inputs and 1 Output)
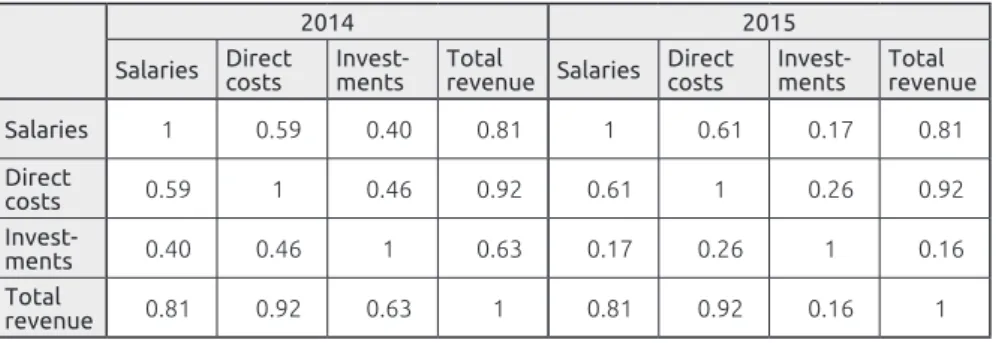
At first, we used data for year 2014 and 2015 as follows: inputs were salaries of employees, direct costs and investments while the only output was total revenue. To be sure that selected inputs and outputs were relevant we estimated correlation between inputs and output. As presented in the Table 1, there exist positive correlations between each input and output which is the basic assumption of Data Envelopment analysis and their values approved appropriate selection of inputs and output. For example salaries and total revenue in 2014 are correlated approximately 81%, direct costs and total revenue are correlated approximately 92% while investments and total revenue approximately 63%. Table 1 contains coefficients of correlation of data in 2014 and 2015.
Table 1. Coefficients of correlation in 2014 and 2015
2014 2015
Salaries Direct costs Invest-ments Total revenue Salaries Direct costs Invest-ments Total revenue Salaries 1 0.59 0.40 0.81 1 0.61 0.17 0.81 Direct costs 0.59 1 0.46 0.92 0.61 1 0.26 0.92 Invest-ments 0.40 0.46 1 0.63 0.17 0.26 1 0.16 Total revenue 0.81 0.92 0.63 1 0.81 0.92 0.16 1
Source: Author’s calculations
Coefficient correlations expressed by the above table aproved appropriate selection of inputs and output which is the first and very important step of analysis. More precisly it means that increasing amounts of inputs lead to increasing output.
The next tables contain relative efficiency scores obtained by BCC input-oriented model for 2014 and 2015 year respectively.
Table 2. Relative efficiency scores by BCC
2014 2015
Unit Efficiency score Rank Referent unit Efficiency score Rank Referent unit
ZEKZ 1 1 ZEKZ 1 1 ZEKZ
ZEKV 0,99 9 ZEKZ 1 1 ZEKV
ZEKOV 1 1 ZEKOV 0,60 12 ZEKV
ZEKN 0,74 11 ZEKZ 0,88 9 ZEKV
ZEKP 1 1 ZEKP 1 1 ZEKP
ZEKFO 1 1 ZEKFO 1 1 ZEKFO
ZEKEZ 1 1 ZEKEZ 1 1 ZEKEZ
ZEKO 1 1 ZEKO 1 1 ZEKO
ZEKAT 1 1 ZEKAT 1 1 ZEKAT
ZEKBM 0,62 12 ZEKOV 0,88 10 ZEKFO
ZEKE 0,95 10 ZEKFO 0,61 11 ZEKV
ZEKOU 1 1 ZEKOU 1 1 ZEKOU
Source: Author’s calculations
Every unit with efficiency score equal 1 is 100% efficient if all slacks are equal 0. Those departments with efficiency score less than 1 are relatively inefficient. For example unit ZEKBM achieved 2014 approximately 62% efficiency of the efficient referent unit ZEKOV. Referent unit means relatively efficient unit that represent ‘ideal’ for inefficient one. The average efficiency of 12 departments in 2014 is approximately 94%, while the minimum equals approximately 62%. The next year the average efficiency is approximately 92% while the minimum equals approximately 60%.
Table 3. Efficiencies in 2014 and 2015
2014 2015
Average efficiency 0.94 0.92
Max efficiency 1 1
Min efficiency 0.62 0.60
ST Dev 0.13 0.15
Source: Author’s calculations
The next two tables contain slacks associated with inputs and output in 2014 and 2015. Each slack different from zero means the input excesses or output shortfalls.
Table 4. Slacks associated with inputs and outputs in 2014 and 2015
No. Unit
Efficiency score
Slack
Salaries Direct costs Investments Revenue
2014 2015 2014 2015 2014 2015 2014 2015 2014 2015 1 ZEKZ 1 1 0 0 0 0 0 0 0 0 2 ZEKV 0.99 1 0 0 0 0 0 0 0 0 3 ZEKOV 1 0.60 0 0 0 0 0 411354 0 0 4 ZEKN 0.74 0.88 0 0 0 0 0 0 0 0 5 ZEKP 1 1 0 0 0 0 0 0 0 0 6 ZEKFO 1 1 0.20 0.75 0 0 0.03 0 0 0 7 ZEKEZ 1 1 0.38 0 0 0 0 0 0 0 8 ZEKO 1 1 0 0 0 0 0 0 0 0 9 ZEKAT 1 1 0 0 0 0 0 16.15 0 0 10 ZEKBM 0.62 0.88 0 11874.8 26400.8 20654.9 34701.2 0 0 0 11 ZEKE 0.96 0.61 0 0 39901.6 0 0 1876.17 15849.8 0 12 ZEKOU 1 1 0 0 0 0 0 0 0 0
Source: Author’s calculations
We can conclude that in 2014 units ZEKZ, ZEKOV, ZEKP, ZEKO, ZEKAT and ZEKOU are relatively efficient while units ZEKFO and ZEKEZ are inefficient because their slacks are different from 0. For example unit ZEKEZ has efficiency score equal to 1 but input (Salaries) slack is equal 0,381. It means that unit ZEKEZ has excess of input salaries. Departments ZEKV, ZEKN, ZEKBM and ZEKE are relatively inefficient because of efficiency score less than 1. The next year six units (ZEKZ, ZEKV, ZEKP, ZEKEZ, ZEKO and ZEKOU) are relatively efficient and six are relatively inefficient (ZEKOV, ZEKN, ZEKFO, ZEKAT, ZEKBM and ZEKE). The next table contains type of returns to scale for all 12 units in 2014 and 2015.
Table 5. Return to scale in 2014 and 2015
Unit Returns to scale
2014 2015
ZEKZ Constant Constant
ZEKV Decreasing Constant
ZEKOV Increasing Increasing
ZEKN Decreasing Decreasing
ZEKP Constant Constant
ZEKFO Increasing Increasing
ZEKEZ Increasing Constant
ZEKO Decreasing Decreasing
ZEKAT Constant Decreasing
ZEKBM Increasing Increasing
ZEKE Increasing Increasing
ZEKOU Constant Constant
Information about the type of returns to scale for each of unit is very important in case of considering potential investments. Namely, if returns to scale of units are increasing we can expect that increasing input leads in more than proportional increasing output which shows that units have the possibility to improve efficiency by scaling up their activities. In both years, this is only possible in four units (ZEKOV, ZEKFO, ZEKBM, ZEKE).
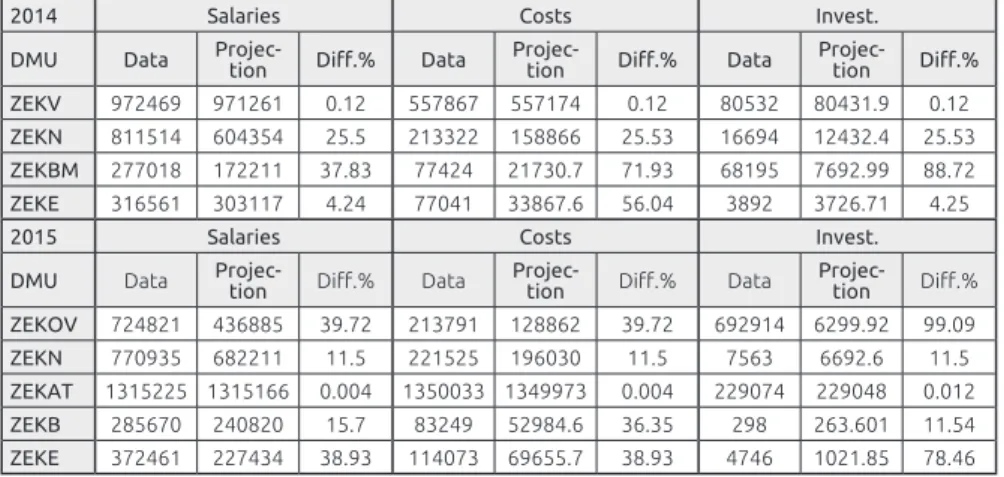
For every inefficient unit we have a formula for improvement, the BCC-projection, which enables movement of inefficient unit on efficient frontier. BCC-projection determines sources and amounts of inefficiency which in 2014 for unit ZEKN means reduction of all inputs for approximately 26%, while in 2015 means reduction for approximately 12% (Table 6).
Table 6. BCC projection for inefficient DMU in 2014 and 2015
2014 Salaries Costs Invest.
DMU Data Projec-tion Diff.% Data Projec-tion Diff.% Data Projec-tion Diff.% ZEKV 972469 971261 0.12 557867 557174 0.12 80532 80431.9 0.12 ZEKN 811514 604354 25.5 213322 158866 25.53 16694 12432.4 25.53 ZEKBM 277018 172211 37.83 77424 21730.7 71.93 68195 7692.99 88.72 ZEKE 316561 303117 4.24 77041 33867.6 56.04 3892 3726.71 4.25
2015 Salaries Costs Invest.
DMU Data Projec-tion Diff.% Data Projec-tion Diff.% Data Projec-tion Diff.% ZEKOV 724821 436885 39.72 213791 128862 39.72 692914 6299.92 99.09 ZEKN 770935 682211 11.5 221525 196030 11.5 7563 6692.6 11.5 ZEKAT 1315225 1315166 0.004 1350033 1349973 0.004 229074 229048 0.012 ZEKB 285670 240820 15.7 83249 52984.6 36.35 298 263.601 11.54 ZEKE 372461 227434 38.93 114073 69655.7 38.93 4746 1021.85 78.46
Source: Author’s calculations 4.2 BCC Model 2 (2 Inputs and 2 Outputs)
We continued with DEA on the same set of units and the same period of time, but with different selection of inputs and outputs. Total costs and number of samples were now inputs while the number of analysis and total revenue were selected as outputs. To be sure that we selected relevant inputs and outputs we started with correlation estimation. The next table with correlation coefficients shows that selected inputs and output are highly correlated in 2014 and in 2015. For example in 2014 total costs and total revenue are approximately 97%, number of samples and total revenue approximately 70%, total costs and number of analysis approximately 61% while number of samples and number of analysis approximately 53%. In 2015 coefficients of correlation values also approved the relationship between selected inputs and outputs: total costs and total revenue are correlated approximately 93%, number of samples and total revenue approximately 69%, total costs and number of analysis approximately 65% while number of samples and number of analysis approximately 51%.
Table 7. Coefficients of correlation for 2014 and 2015 2014 2015 Total costs Number of samples Number of analysis Total
revenue Total costs
Number of samples Number of analysis Total revenue Total costs 1 0.63 0.61 0.97 1 0.69 0.65 0.93 Number of samples 0.63 1 0.53 0.70 0.69 1 0.51 0.69 Number of analysis 0.61 0.53 1 0.62 0.65 0.51 1 0.83 Total revenue 0.97 0.70 0.62 1 0.93 0.69 0.83 1
Source: Author’s calculations
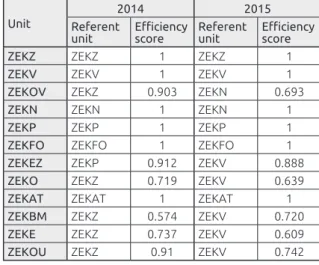
We continued with applying BCC- input oriented model and we obtained the following results of relative efficiency and reference unit for 2014 and 2015.
Table 8. Efficiency scores and referent units for 2014 and 2015 Unit
2014 2015
Referent
unit Efficiency score Referent unit Efficiency score
ZEKZ ZEKZ 1 ZEKZ 1
ZEKV ZEKV 1 ZEKV 1
ZEKOV ZEKZ 0.903 ZEKN 0.693
ZEKN ZEKN 1 ZEKN 1
ZEKP ZEKP 1 ZEKP 1
ZEKFO ZEKFO 1 ZEKFO 1
ZEKEZ ZEKP 0.912 ZEKV 0.888
ZEKO ZEKZ 0.719 ZEKV 0.639
ZEKAT ZEKAT 1 ZEKAT 1
ZEKBM ZEKZ 0.574 ZEKV 0.720
ZEKE ZEKZ 0.737 ZEKV 0.609
ZEKOU ZEKZ 0.91 ZEKV 0.742
Source: Author’s calculations
From 12 units 6 units are assessed in 2014 as relatively efficient: ZEKZ, ZEKV, ZEKN, ZEKP, ZEKFO and ZEKAT. In 2015 there are 4 efficient departments: ZEKV, ZEKN, ZEKP and ZEKFO.
The average efficiency score in 2014 is 90% while the minimum efficiency score is approximately 57%. The next year the average efficiency score is 86%, while minimum efficiency score is 61%.
Table 9. Efficiencies in 2014 and 2015 2014 2015 Average efficiency 0.8962 0.8574 Max efficiency 1 1 Min efficiency 0.5743 0.6094 ST Dev 0.1432 0.1629
Source: Author’s calculations
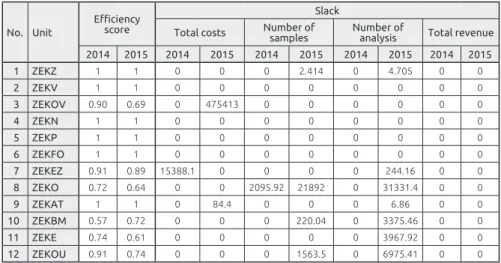
The next two tables contain, among other values, slacks associated with inputs and output in 2014 and 2015. As we already mentioned each slack different from zero means the input excesses or output shortfalls. For example unit ZEKEZ is relatively inefficient and has excess of total costs and also shortfall of number of analysis.
Table 10. Slacks associated with inputs and outputs in 2014 and 2015 No. Unit
Efficiency score
Slack
Total costs Number of samples Number of analysis Total revenue 2014 2015 2014 2015 2014 2015 2014 2015 2014 2015 1 ZEKZ 1 1 0 0 0 2.414 0 4.705 0 0 2 ZEKV 1 1 0 0 0 0 0 0 0 0 3 ZEKOV 0.90 0.69 0 475413 0 0 0 0 0 0 4 ZEKN 1 1 0 0 0 0 0 0 0 0 5 ZEKP 1 1 0 0 0 0 0 0 0 0 6 ZEKFO 1 1 0 0 0 0 0 0 0 0 7 ZEKEZ 0.91 0.89 15388.1 0 0 0 0 244.16 0 0 8 ZEKO 0.72 0.64 0 0 2095.92 21892 0 31331.4 0 0 9 ZEKAT 1 1 0 84.4 0 0 0 6.86 0 0 10 ZEKBM 0.57 0.72 0 0 0 220.04 0 3375.46 0 0 11 ZEKE 0.74 0.61 0 0 0 0 0 3967.92 0 0 12 ZEKOU 0.91 0.74 0 0 0 1563.5 0 6975.41 0 0
Source: Author’s calculations
The next table contains type of returns to scale for all 12 departments in 2014 and 2015.
Table 11. Return to scale in 2014 and 2015
Unit Returns to scale
2014 2015
ZEKZ Constant Decreasing
ZEKV Constant Constant
ZEKOV Increasing Constant
ZEKN Constant Constant
ZEKP Constant Constant
ZEKFO Constant Constant
ZEKEZ Constant Increasing
ZEKO Increasing Increasing
ZEKAT Decreasing Decreasing ZEKBM Increasing Increasing
ZEKE Increasing Increasing
ZEKOU Increasing Increasing
Source: Author’s calculations
According to this model again only 4 units (ZEKO, ZEKBM, ZEKE, ZEKOU) have increasing return on scale in both years. Both models suggest that only three units (ZEKBM, ZEKE and ZEKOV) with increasing scale in both years have the possibility to improve efficiency by scaling up their activities.
BCC projection which determines sources and amounts of inefficiency for each inefficient unit is expressed in the next table for 2014 and 2015 year.
Table 12. BCC projection for inefficient DMU in 2014 and 2015
2014 Costs Number of samples
DMU Data Projection Diff.% Data Projection Diff.%
ZEKOV 556750 502816 9.7 726 656 9.7 ZEKEZ 375589 327235 12.9 104 95 8.8 ZEKO 2524023 1814013 28.1 42180 28219 33.1 ZEKBM 422637 242709 42.6 537 308 42.6 ZEKE 397495 292839 26.3 650 478.862 26.33 ZEKOU 807927 734579 9.08 4025 3659.59 9.08
2015 Costs Number of samples
DMU Data Projection Diff.% Data Projection Diff.%
ZEKOV 1631527 652463 60.01 777 537.14 30.87 ZEKEZ 407520 361763 11.23 171 151.8 11.23 ZEKO 2469507 1578703 36.07 42526 5293.92 87.55 ZEKAT 2894332 2894222 0.004 6910 6909.94 0.001 ZEKBM 369216 265705 28.04 775 337.69 56.43 ZEKE 491281 299380 39.06 612 372.94 39.06 ZEKOU 826324 612984 25.82 4330 1648.58 61.93
Reduction of all inputs of the unit are not always proportional as we can see from the example ZEKO where projected reduction of costs in 2015 is 36%, while reduction of number of samples is approximately 88%, which should be subject of detailed analysis.
The next table expresses efficiency score of units under two different models during 2014 and 2015 and average values of relative efficiency.
Table 13. Efficiency scores for two models
1. MODEL 2. MODEL
2014 2015 2014 2015
Efficient
unit Inefficient unit Efficient unit Inefficient unit Efficient unit Inefficient unit Efficient unit Inefficient unit
ZEKZ ZEKV ZEKZ ZEKOV ZEKZ ZEKOV ZEKV ZEKZ
ZEKOV ZEKN ZEKV ZEKN ZEKV ZEKEZ ZEKN ZEKOV
ZEKP ZEKBM ZEKP ZEKBM ZEKN ZEKO ZEKP ZEKEZ
ZEKO ZEKE ZEKEZ ZEKE ZEKP ZEKBM ZEKFO ZEKO
ZEKAT ZEKFO ZEKO ZEKFO ZEKFO ZEKE ZEKAT
ZEKOU ZEKEZ ZEKOU ZEKAT ZEKAT ZEKOU ZEKBM
ZEKE ZEKOU
Average efficiency
94% Average efficiency 92% Average efficiency 90% Average efficiency 86% Source: Author’s calculations
We can see from above table that the number of relatively efficient departments in the first model is the same as the number of inefficient departments in 2014 with average efficiency 94% and 2015 year with average efficiency 92%. The second model showed greater variability of efficiency results between year 2014 and 2015 and also decreasing average efficiency from 90% in 2014 to 86% in 2015. The tendency of decreasing the average efficiency is a good support for future decision making process.
Among all twelve units the only relatively efficient one by both models was ZEKP which could be considered as the efficient unit representing best practise. The efficiency of ZEKP unit (Department of improving nutrition) can serve as an example because with the same cost the number of public health programs impacting revenue growth increase. ZEKE and ZEKBM units were relatively inefficient by both models and they could be considered as units which do not operate in the best possible way. Inefficient units (Department of Ecotoxicology and Department of biological monitoring and exposure) are new units and still investing so that the effects expressed in revenue will be visible in the future.
These results would be very valuable for the strategy implementation and in general decision making process. The head of the Institute and the management will consider and analyse in detail the reasons for less efficiency of the two units and compare them with the best one. Evaluation of relative
efficiency by DEA is a first step in order to implement Balanced Scorecard (BSC) as an effective tool for performance management system.
5 Conclusion
Nowadays, all the contemporary health care systems face the problem how to ensure efficient and equitable health care for all citizens when sources of funding are limited. The task of public health services is to improve population’s health and they therefore comprise a series of improvement measures. This research seeks to assess the usefulness of DEA in measuring the efficiency of a set of comparable units within the Institute of public health in a Croatian county. We have not found such study using DEA in the public health services yet, because most of the research has been focused on health care, i.e. hospitals. Surely ours is the first study that has used DEA in the public health services system in Croatia and Region.
According to the results of our research we can conclude that Data Envelopment Analysis can provide top managers with valid technique to measure efficiency of units within Institute of public health services. The first and crucial step is the selection of some common inputs and outputs that reflect the analyst’s interest: we used the data from the Institute management. They cooperated in the research selecting inputs and outputs considered in the BCC model and their valuable knowledge was incorporated in the model, which is very important in order to make results accepted. Both models reveal significant differences in efficiency among analysed units. We found sources and amounts of inefficiency (projection values), best practise as benchmark for other units (unit in reference set), units with investment potentials (units with increasing returns to scale) and we can conclude that DEA is a valuable tool for managers who understood usefulness and possibilities of DEA. In summary, our analysis provided managers the tool to assess their unit’s relative performances, identify top performance among them and identify ways to improve their performance. Unfortunately DEA does not identify the actions that need to be carried out. DEA only measures efficiency relative to best practice within the particular sample. This study has limitations in the number of units and number of inputs and outputs. Further analysis will expand their number and also investigate the difference in importance of specific inputs and outputs which will be included into the BCC model. Still, this reserach has confirmed that it is possible to measure the efficiency of public health services by DEA.
Neda Vitezić, CPA, CIA is a full professor at the Faculty of Economics, University in Rijeka, specialization Business Analysis, Controlling and Auditing. Today she is leading MBA Controlling and is chairperson of Department of Entrepreneurship economy and Head of Association of Croatian Controllers. Her current research interest is in performance measurement in private and public sector related to corporate governance and social responsibility. She published two books and over
140 articles in scientific journals and proceedings.
Alemka Šegota is an associate professor at the Faculty of Economics, University in Rijeka and University in Dubrovnik. Her specialization is Mathematics, Decision Theory and Quantitative Economy. She is a member of Croatian Society of Operational Research. Her current research interest is in Data Envelopment Analysis (DEA) applications in public sector. She published one book and over 20 articles in
scientific journals and proceedings.
Stanka Setnikar Cankar, doctor of economic sciences, is a full professor at the University of Ljubljana, Faculty of Administration. She has dealt with the
economics of the public sector, the assessment of efficiency and effectiveness in
the public sector, the entrepreneur functions in the public sector, centralisation and decentralisation of public sector services, public procurement, transfer of good practices with cross-border cooperation, innovation and creativity in the public sector and education.
References
Afonso, A., Schuknecht, L., & Tanzi, V. (2006). Public Sector Efficiency: Evidence for new EU Member States and Emerging Markets (ECB Working paper series No 581). European Central Bank).
Alexander, C. A., Busch, G., & Stringer, K. (2003). Implementation and Interpreting a Data Envelopment Analysis Model to Assess the Efficiency of Health Systems in Developing Countries. IMA Journal of Management Mathematics, 14(1), 9–63. doi:10.1093/imaman/14.1.49
Azizi, F., Behzadian, M., & Afshari, A. (2012). Application of Balanced Scorecard approach to healthcare organization. European Journal of Scientific Research, 74(1), 79–89.
Banker, R. D., Cooper, W. W., Seiford, L. M., & Zhu, J. (2011). Returns to the Scale in DEA. Springer. doi:10.1007/978-1-4419-6151-8_2
Boland, T., & Fowler, A. (2000). A system perspective of performance
management in public sector organisations. The International Journal of Public Sector Management, 13(5), 417–46. doi:10.1108/09513550010350832 Chyhan, M. E., & Benneyan, J. C. (2008). Data Envelopment Estimates for the
Most Efficient National Healthcare Systems Given Uncertain Proportional Rate Inputs. In J. Fowler & S. Mason (Eds.), Proceedings of the 2008 Industrial Engineering Research Conference (pp. 1760–1765).
Cooper, W. W., Seiford, L. M., & Tone, K. (2007). Data Envelopment Analysis: A Comperhensive Text with Models, Applications, References and DEA-Solver Software (2nd ed.). Springer US. doi:10.1007/978-0-387-45283-8 Cooper, W. W., Seiford, L. M, & Zhu, J. (Eds.). (2004). Handbook on Data
Envelopment Analysis. New York, Boston, Dordrecht, London, Moscow: Kluwer Academcic Publishers.
De Nicola, A., Gitto, S., & Mancuso, P. (2011). A two stage DEA model to evaluate the efficiency of the Italian health system (MPRA Paper No. 39126). Munich Personal RePEc Archive.
Ebejer, I., & Mandl, U. (2009). The efficiency of public expenditure in Malta. ECFIN Country Focus, 6(2), 1–6. doi:10.2765/24625
Finkler, M. D., & Wirtschafter, D. D. (1993). Cost-effectiveness and Data Envelopment Analysis. HealthCare Management Review, 18(3), 81–88. doi:10.1097/00004010-199301830-00010
Ghotbuee, A., Hemati, M., & Fateminezhad, R. (2012). An empirical study based on BSC-DEA to measure the relative efficiencies of different health care centers in province of Semnan, Iran. Management Science Letters 2(7), 2643– 2650. doi:10.5267/j.msl.2012.06.042
González, A., Cárcaba, A., & Ventura, J. (2010). Value efficiency analysis of health systems: does public financing play a role? Journal of Public Health, 18(4), 337–350. doi:10.1007/s10389-009-0311-4
Lan, C.-H., Chuang L.-L., Chang Ch.-Ch. (2007). An Efficiency-Based Approach on Human Resource Management: A Case Study of Tainan County Fire Branches in Taiwan. Public Personnel Management, 36(2), 143–164. doi:10.1177/009102600703600204
Lesneski, C. (2009). Developing Performance Measures for Public Health Agencies: Strategic Benefits of Applying the Balanced Scorecard Framework to Local Public Health Agencies. VDM Verlag Dr. Müler Akciengesellschaft & Co. KG.
Lynch, J. R., & Ozcan, Y. A. (1994). Hospital Closure: An Efficiency Analysis. Hospital & Health Services Administration, 39(2), 205–220.
Mirmirani, S., Li, H. C., & Ilacqua, J. A. (2008). Health Care Efficiency in Transition Economies: An Application of Data Envelopment Analysis. International Business & Economics Research Journal, 7(2), 47–55. doi:10.19030/iber. v7i2.3221
Morey, R. C., Fine, D. J., & Loree, S. W. (1990). Comparing the allocative efficiencies of hospitals. Omega, 18(1), 71–83.
doi:10.1016/0305-0483(90)90019-6
National Strategy of Health Care Development 2012–2020. Republic of Croatia, Ministry of Health.
Ngoie, K. J., & Koch, S. K. (2005). DEA Applied to a Gauteng Sample of South African Public Hospitals (Working paper no. 28). University of Pretoria.
Nuti, S., Daraio, C., Speroni, C., & Vainieri, M. (2011). Relationships between technical efficiency and the quality and costs of health care in Italy. International Journal for Quality in Health Care, 23(3), 324–330. doi:10.1093/intqhc/mzr005
Ozcan Y. A. (2014). Health Care Benchmarking and Performance Evaluation. London: Springer. doi:10.1007/978-1-4899-7472-3
Partha, D., Dhar, A., & Bhattacharya, B. N. (2012). Efficiency of Health Care System in India: An Inter-State Analysis using DEA Approach. Social Work in Public Health, 27(5), 482–506. doi:10.1080/19371918.2012.672261 Rabar, D. (2009). Ispitivanje efikasnosti bolnica primjenom analize omeđivanja
podataka, (magistarski rad). Zagreb: Sveučilište u Zagrebu, Ekonomski fakultet Zagreb.
Rabar, D. (2010). Ocjenjivanje efikasnosti poslovanja hrvatskih bolnica metodom analize omeđivanja podataka. Ekonomski pregled, 61(9-10), 511–533.
Sherman, D. (1984). Hospital Efficiency Measurement and Evaluation: Empirical Test of a New Technique. Medical Care, 22(10), 922–938. doi:10.1097/00005650-198410000-00005
Smith, K. R., Balakrishnan, K., Butler, C., Chafe, Z., Fairlie, I., Kinney, P., Kjellstrom, T., Mauzerall, D. L., McKone, T., McMichael, A., Schneider, M. & Wilkinson, P. (2012). Chapter 4 - Energy and Health. In Global Energy Assessment - Toward a Sustainable Future (pp. 255–324). Cambridge, UK and New York, NY, USA and the International Institute for Applied Systems Analysis, Laxenburg, Austria: Cambridge University Press.
Smith, P. C., Mossialos, E., Papanicolas, I. & Leatherman, S. (Eds.) (2009). Performance Measurement for Health System Improvement: Experiences, Challenges and Prospects. Health economics, policy and management. Cambridge, UK: Cambridge University Press.
Szczepura, A., Davies, C., Fletcher, J., & Boussofiane, A. (1993). Efficiency and Effectiveness in General Practices. Journal of Management in Medicine, 7(5), 36–47. doi:10.1108/eb060565
Thornhill, D. (2006, April). Productivity Attainment in a Diverse Public Sector. Paper presented at the Institute of Public Administration Seminar on Promoting Productivity in a Diverse Public Sector. Dublin.
Zhu, J. (2014). Quantitative Models for Performance Evaluation and Benchmarking: Data Envelopment Analysis with Spreadsheets (3rd ed.). International Series in Operations Research & Management Science. Springer International Publisher. doi:10.1007/978-3-319-06647-9
Webb, W. (2010). Public Management Reform and the Management of Ethics-Incompatible Ideals for the Developing State? International Journal of Public Sector Management, 23(7), 669–684. doi:10.1108/09513551011078914 Winslow, C .E. A. (1920). The untilled field of public health. Science, 51(1306),
POVZETEK
1.01 Izvirni znanstveni članek
Merjenje učinkovitosti storitev javnega zdravstva z
metodo DEA
Danes se vsi sodobni zdravstveni sistemi soočajo z zahtevo, zagotoviti učinkovito in pravično zdravstvo za vse državljane ob omejenih virih financiranja. Naloga javne zdravstvene politike je zagotavljanje enakopravnosti in pravičnosti pri dostopu do zdravstvenih storitev ter izboljšanje njihove kakovosti. Za dosego teh ciljev je potreben učinkovit sistem regulacije in nadzora izvajalcev zdravstvenih storitev. Za raziskavo smo uporabili metodo
DEA (Data Envelopment Analysis) in izbrali organizacijske enote Instituta za javno zdravstvo (Hrvatski zavod za javno zdravstvo) na Hrvaškem v letih 2014 in 2015. Uporabili smo podatke za izbrane vložke (plače zaposlenih, neposredni stroški, investicije, število vzorcev) in izložke (skupni dohodek, število analiz) v letih 2014 in 2015 ter dva modela analize DEA z različnim številom spremenljivk.
Oba modela sta razkrila pomembne razlike v učinkovitosti med analiziranimi enotami Zavoda za zdravstveno varstvo in njihovo razvrstitev med učinkovite oziroma neučinkovite. Metoda je omogočila določitev virov in vrednosti neučinkovitosti s projekcijo vrednosti. Za vsako neučinkovito enoto je bilo mogoče določiti vzroke neučinkovitosti in načrtovati velikost spremembe vložkov, ki bi izboljšali njihovo učinkovitost.
Ugotovili smo najboljše prakse kot merilo za druge enote z izbiro referenčne enote. Določili smo lahko enote z investicijskim potencialom. Uporaba metode DEA je dragoceno orodje za vodje, ki želijo poznati učinkovitost svoje enote v primerjavi z drugimi enotami. Ocena učinkovitosti in izbira najboljše, referenčne enote omogoča vodjem, da načrtujejo dosegljive cilje in spremembe v poslovanju z uporabo dobrih praks iz najboljših enot. Slabost metode DEA pa je, da ne opredeli ukrepov, ki jih je treba uvesti za izboljšanje stanja. Odločitev o izbiri metod za dosego višjih ciljev je prepuščena vodjem. Ugotovitve v članku bodo v pomoč tudi regulatorjem zdravstvenega sistema na Hrvaškem pri določanju bodočih ciljev poslovanja, ki bi jih morale doseči premalo učinkovite enote.