Working capital management
What top performing businesses in the Nordics do differently
A study of working capital management practices across Nordic organisations
2 Working capital management
“
Effective
WCM can
support
businesses,
regardless
of what their
challenges
and aims are.
Due to low economic growth, working capital
management (WCM) has never been more important for
Nordic businesses. But, until now, there has been little
systematic attention paid to tracking relative performance
or the underlying reasons why some companies perform
so much better than others.
Managing working capital should be a clear priority for all organisations. Companies that do it effectively enjoy several benefits — including improved cash flow, better return on invested capital, and lower funding costs. Effective WCM can support businesses, regardless of what their challenges and aims are — funding, growth, stability, managing risk or streamlining budgets. But, while everyone is aware of the benefits of effective WCM, not all organisations are experiencing them.
Challenges to effective WCM
Once you get beyond the “quick wins”, producing sustainable improvements in WCM performance is not a straightforward task. Improving working capital performance means making changes to business processes, technology and organisational structure across multiple departments, as well as to the culture. It often involves balancing competing needs — companies may be torn between meeting shareholder expectations for key ratios, optimising cash flow generation and managing customer expectations.
In seeking improvement, you are likely to face a number of challenges. You will need a complete view of your working capital and the factors that influence it. And you will need strong executive ownership — but assigning this responsibility is often difficult because there are many functions and areas involved.
In the projects we have engaged in with our customers, we have seen the scale of the challenge first-hand and how high WCM is on their agendas. We have provided advice, ideas and, of course, banking solutions on a case-by-case basis — but we know what many organisations want is a clear baseline of data and best practice to follow.
Working
capital management
“
We are currently
running a
group-wide working
capital management
programme. You can
do some relatively
easy things, such as
signing agreements
with banks and
suppliers to remove
some of the working
capital you have on
your balance sheet.
But a working capital
reduction programme
is something else.
You need to involve
every part of the
organisation. You need
to shorten your
order-to-cash cycle and
extend your
purchase-to-pay cycle.
Per Norman
Head of Treasury and Risk Management, BillerudKorsnäs
Exploring diversity, finding common ground
To establish that baseline of how Nordic companies are performing, we conducted a study of hundreds of corporates across all industries and most business sizes.
We selected 15 top performers and dissected how they
improved their working capital to illustrate some key
best practices.
We have detailed our findings in this report — the first of its kind in the Nordics.
Who is this report for?
The report will, of course, be particularly useful for any Nordic finance professional or executive with influence or responsibility for processes or functions affecting working capital metrics. But we also believe the report’s insights will be beneficial for organisations across Europe.
Our experiences with customers suggest the same general trends in performance and best practice apply across the wider region.
Our approach
To create this report we examined key financial metrics from 403 Nordic
corporations, over the period 2008–2013, using verified data from annual reports, commercial databases and other trusted public sources.
To complement this quantitative study, we performed a further “deep dive” qualitative analysis of 15 companies and the working capital initiatives they have followed by studying articles, company presentations and analyst reports. For full details of our methodology, see page 11.
4 Working capital management
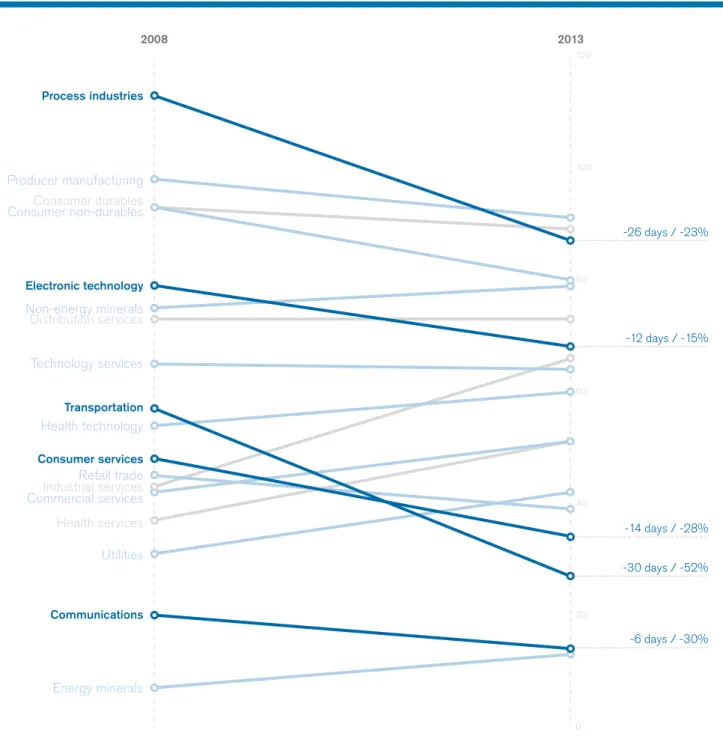
Figure 1: DWC changes by industry, 2008–2013. Most improved industries highlighted.
Setting
the benchmark
Every business compares itself against its peers. Benchmarking using performance
metrics like days working capital (DWC) enables you to identify areas where you are
weak, so you can focus your improvement efforts.
Overall performance
We looked at the changes in DWC of 403 corporates between 2008 and 2013 to get a view of overall WCM performance in the Nordic region. We also analysed how individual sectors performed to identify any patterns of improvement.
Nordics performing better
The financial crisis prompted companies to tighten budgets and operations; sales figures were falling, which created a need for organisations to defend their cash flow. Between 2008 and 2013, we found an average improvement in DWC of five days or 6.8% across our sample.
2008 2013
Energy minerals Utilities
Health services
Commercial servicesIndustrial services Retail trade Consumer services Health technology Transportation Technology services Distribution services Non-energy minerals Electronic technology
Consumer non-durablesConsumer durables Producer manufacturing Process industries Communications 0 20 40 60 80 100 120 -6 days / -30% -30 days / -52% -14 days / -28% -26 days / -23% -12 days / -15%
-35 35 30 25 20 15 10 5 0 -5 -10 -15 -20 -25 -30 120 90 60 20 110 80 50 10 100 70 40 0 30
Days working capital 200
8
Days working capital — change 2008–2013
Average 2008 Industrial services Communications Transportation Process industries Electronic technology Health technology Retail trade Utilities Health services Non-energy minerals Energy minerals Commercial services Consumer durables Distribution services Technology services Consumer services Consumer non-durables Producer manufacturing
The sector view
Of course, the overall average covers a broad spread of performance and level of improvement. In some industries, DWC improved by as much as 52%. But at the other end of the spectrum, some sectors showed deterioration in DWC of up to 86%.
The biggest reduction in DWC we saw was
in the transportation industry — DWC fell by
52% or 30 days, from 57 days in 2008 to
27 days in 2013.
There was a broad spread of DWC starting figures in 2008, ranging from 100 days to under 10 days. Organisations that improved the most by 2013 in terms of absolute days were generally those with a large initial DWC figure — they naturally had more room for improvement.
The process industries, for example, went from 113 days in 2008 to 87 days in 2013; an improvement of 26 days or 23%. On the flip side, organisations that began with a lower DWC figure did not have as much opportunity to get better. For instance, the communications sector showed a decrease from 20 days in 2008 to 14 in 2013.
It is important to note that these improvements are not just a result of DWC figures being particularly poor in 2008. Figures in 2013 also show an improvement on those in 2007.
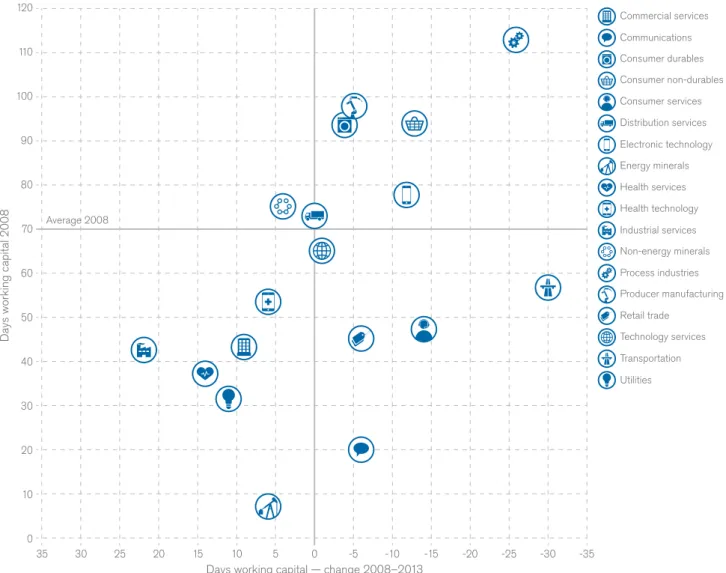
From the what to the why
Looking at macro-level changes in performance at a sector level is interesting, and gives you a benchmark against which to compare your own organisation, set goals and start dialogues with your colleagues. But we believe it is much more useful to look at how and why individual organisations achieved results in their particular circumstances — by following their example, you can apply best practices to your own business.
Figure 2: Days change in DWC, 2008–2013, against starting point for each industry.
6 Working capital management
Look
to the leaders
Some businesses are far ahead of the average. We looked at organisations that
showed both strong DWC performance and a positive growth rate. They set an
example your business can follow.
Picking the winners
We selected 15 corporates that demonstrated clear improvement in DWC performance. We chose them
because they each had a market capitalisation of more than EUR 1billion, a positive compound annual growth rate (CAGR) to indicate business performance was not sacrificed for working capital optimisation, and a DWC improvement of more than 20%.
We chose a group of companies from a range of industries, including retail, transportation, manufacturing and
communications — we hope you will find one that aligns to your business. We reviewed financial statements and other public documents to gain an insight into the specific measures these companies used to improve their working capital during the time period.
Performance by the numbers
These organisations demonstrate class-leading DWC, averaging 44 days in 2013, and a 40% improvement during the period.
Naturally, depending on whether you
look at absolute days improvement or
relative percentage improvement, you find
different winners.
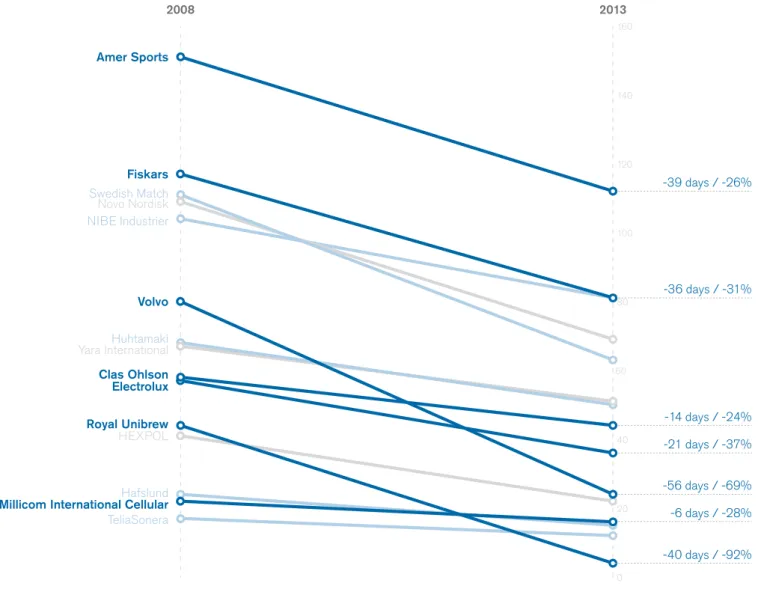
In the annual reviews and public documents we studied, we found a range of improvements. For instance, Volvo improved its DWC by 69%, reducing it from 80 days in 2008 to 24 days in 2013. But for an organisation like TeliaSonera starting at just 17 days, its reduction of five days is also a significant achievement. What matters is, regardless of their starting point in terms of DWC, and regardless of their revenue, sector and growth rate, they all showed that it is possible for a large multinational to achieve impressive improvements in DWC in just a five-year period. It is likely your corporation can do this as well.
What makes a top performer?
So what can you do to emulate their success? Every business will have unique challenges and will take some unique approaches tailored to their particular situations.
Improvements to working capital can
and should come from all areas of the
business.
For example, from what we observed in our study of annual reviews and other public documents from 2008 to 2013, Royal Unibrew began its efforts to improve working capital in 2008 by focusing on managing inventories, trade receivables and trade payables. In 2009, the group kept investment in production facilities limited to replacing individual components related to specific products or optimisation of selected processes or maintenance.
This approach was still in place in 2013. During the period, the group achieved a dramatic reduction of 92%, lowering its DWC figure from 44 to four days.
In our work with customers overall and in our detailed review of the annual reports from these successful companies and other published material, we have identified four focus areas that most of these companies have in common. The most important of these four is that they make WCM part of their DNA, not just in the finance function, but right across the business.
Figure 3: DWC improvements by company, indicating absolute and relative change, 2008–2013. Highlighted companies are discussed in the following sections.
TeliaSonera Hafslund HEXPOL Royal Unibrew Electrolux Clas Ohlson
Yara InternationalHuhtamaki
Volvo NIBE Industrier Novo Nordisk Swedish Match Fiskars Amer Sports
Millicom International Cellular
2008 2013 20 0 40 60 100 120 140 160 -6 days / -28% -40 days / -92% -56 days / -69% -21 days / -37% -14 days / -24% -36 days / -31% -39 days / -26% 80 tweet this
8 Working capital management
Key
success factors
The strongest performers have taken all kinds of paths to get where they are today.
But they share a focus on four key areas.
Make WCM a priority
Organisations that have successfully improved their DWC have made WCM a priority and committed to a long-term strategic plan. Most began in the aftermath of the 2008 financial crisis — although some started even earlier.
For WCM to be successful, it needs strong executive ownership, preferably from the CFO or CEO. Mergers and acquisitions, market fluctuations, and organisational changes, for example, can make it harder to implement effective WCM.
Having C-level buy-in can help ensure
organisations sustain their WCM focus even
in the most volatile environments.
It is important to communicate targets clearly and regularly so key staff understand WCM is a business priority. And having realistic targets in place provides a basis for measuring progress.
Linking working capital targets to rewards
Some corporates have tied their executive remuneration schemes to working capital-related targets, as seen in the publicly available annual filings we studied. For instance, Amer Sports bases its rewards for business area presidents on working capital, as well as EBIT net sales and attainment of group targets. Similarly, Electrolux’s remuneration model for managers has clear targets linked to working capital efficiency. In addition, the company has a dedicated programme to improve WCM in areas such as sales, marketing, procurement, manufacturing and administration.
Optimise inventory management
Effective inventory management means aligning customer demand with production or supply to reduce the value of inventories sitting idle. We found many organisations centralised warehouses as part of the inventory optimisation process and took measures to reduce the complexity of stock keeping.
Some organisations that have reduced DWC apply different production models depending on the type, volume and level of product customisation required. This includes practices such as manufacturing customised, low-volume products to order, but using customer forecasts to plan production of standard, higher-volume goods.
But, it is important to note there is no
“one size fits all” way to drive optimisation.
And you certainly do not want to cut held inventory to the bone if it means running out of stock during a period of high demand, for example.Turning inventory into sales revenue
Hardware store chain Clas Ohlson improved inventory turnover by seven days. According to the company’s public reports, the majority (90%) of the company’s assets comprise non-current assets and inventories. As a result, it focused on detecting and preventing deficiencies in these areas when designing internal controls. During the 2012 financial year, the company’s entire inventory of 15,000 items was replaced almost every 60 days. 8
Streamline supply chain management
A number of organisations in the study focused on making their supply chain management more efficient by extending and harmonising payment terms with suppliers, rationalising their range of suppliers, or even moving towards in-house manufacturing.
An increased focus on communication is fundamental to tightening the movement of goods and cash throughout the supply chain — for example, by using automated messaging to improve supply and demand information sharing across the ecosystem, and increasing collaboration between business functions.
A strategic view of the supply chain
Amer Sports’ public filings show it implemented a global supply chain management programme in 2008. It incorporated a global operating platform for sales, logistics, local sourcing and information technology, which is used to manage its production centres in several Asian countries. Similarly, Fiskars made supply chain management a focus area in 2008, according to publicly available data.
Fiskars created a global procurement
strategy by reviewing subcontractor
partners and enhancing the efficiency of
in-house production to make the overall
supply chain demand-driven.
Prioritise receivables management
Some of the best performing companies paid particular attention to harmonising and optimising payment terms, renegotiating contracts, and improving the overall efficiency of invoicing. This could be achieved in a number of ways, such as by implementing processes like electronic or automated invoicing, and moving customers to faster or more reliable payment types such as direct debits.
A few of the organisations we evaluated
also focused on improving the handling
of overdue receivables — for instance,
by implementing a more proactive and
consistent approach to chasing collections.
Success in days sales outstandingOur study of Millicom International Cellular’s publicly available annual reports and documents shows it renegotiated its contracts with suppliers in 2009. In the same year the company introduced a new purchasing process and reduced inventories, which led to a reduction in DWC.
The company achieved a reduction of six days of its receivables turnover, with an overall WCM improvement of 28%.
“
We have looked at some supply chain finance programmes to achieve a better
working capital. This has included assisting our suppliers to borrow cheaply on our
balance sheets. We are also entering into discussions with customers about joining
their supply chain finance programmes.
Per Norman
Head of Treasury and Risk Management, BillerudKorsnäs
10 Working capital management
NEXT STEPS
Would you like to learn more about WCM and the discipline involved in setting targets and making improvements?
Visit insights.nordea.com
or contact your relationship manager for more
information.
Only with the
business’s
strategy
behind you
will you reach
your goal.
“
Conclusion
While the results of the 15 organisations are inspiring,
the scale of the changes they undertook may be daunting,
too. The fact is: achieving WCM excellence is a long and
difficult road.
To get there you will need to take a holistic approach — not only moving all the levers that add up to the ultimate DWC metric, but skilfully orchestrating people, process and technology change, right across the business. That is why the most important advice of all is to start by building commitment: inspire the organisation’s leaders, including the CEO, and show them what is possible. Only with the business’s strategy behind you will you reach your goal.
Methodology
To create this report we examined key financial metrics from 403 Nordic corporations, over the period 2008–2013. Starting with the 570 companies listed on the OMXC, OMXH, OMXS and OSEBX exchanges, we filtered out financial services firms and the smaller organisations listed on the First North exchange, whose volatility could have distorted our trends analysis.
We used public information, like company presentations, and supplemented this with figures and statements from each company’s annual filings and other published documents.
To complement this quantitative study, we performed a further “deep dive” qualitative analysis of 15 companies and the working capital initiatives they have followed. We chose organisations that displayed:
A market value greater than EUR 1billion, ensuring a measure of stability in market performance.
A significant and sustained improvement in working capital of more than 20% over the period.
Strong business performance, with positive CAGR. This is to ensure improvements in DWC did not compromise business health.
CONTRIBUTORS
ROBIN BERGHOLM
Head of Working Capital Management, Wholesale Banking
Robin Bergholm is Head of Working Capital Management, Wholesale Banking for Nordea. Robin is responsible for the WCM solution offering and services for Nordea’s largest corporate customers. Prior to joining Nordea in 2008, he worked as a management consultant for 12 years.
JOONAS JUNTTILA
Global Business Developer at Nordea Trade Finance Sales Development
Joonas is a transaction banking professional with broad business development and IT project experience in areas such as trade finance, cash management and credit card processing. Joonas is currently working on keeping Nordea’s Trade
Sweden Denmark Norway 500-2,000 21% Health technology 9% Industrial services 10% 21% >2,000 15% Technology services 8% Process industries 7% Producer manufacturing 16% Transportation 7% 17% 37% <500 64% Electronic technology 10% Industry Turnover (MEUR) Country
Working capital management
What top performing businesses in the Nordics do differently
A study of working capital management practices across Nordic organisations
SWEDEN Nordea Bank AB Smålandsgatan 17 SE-105 71 Stockholm T: +46 8 614 7000 DENMARK
Nordea Bank Danmark A/S Christiansbro, Strandgade 3 PO Box 850
DK-0900 Copenhagen C T: +45 33 33 33 33
FINLAND
Nordea Bank Finland Plc Aleksanterinkatu 36 B Helsinki
FI-00020 Nordea T: +358 9 1651
NORWAY
Nordea Bank Norge ASA Middelthunsgt. 17 NO-0368 Oslo T: +47 22 48 50 00
nordea.com
About
Nordea
Nordea’s vision is to be a great European bank, acknowledged for its people, creating superior value for customers and shareholders. We are making it possible for our customers to reach their goals by providing a wide range of products, services and solutions within banking, asset management and insurance. Nordea is one of few European banks with an AA-rating and is also among the ten largest full-service banks in Europe, based on market capitalisation. We have the largest customer base of any financial services group in the Nordic region, with approximately 10 million household customers and around 500,000 corporate clients. The Nordea share is listed on the NASDAQ OMX Nordic Exchange in Stockholm, Helsinki and Copenhagen.