Specifically, in order to maximize the interactivity of the game it-self and to provide relatively uniform experiences between players playing over different network speeds, on-line games typically fix their usage requirements in such a way as to saturate the network link of their lowest speed players. While the traffic observed is highly predictable, the traces also indicate that these on-line games provide significant challenges to current network infrastructure. As a result of synchronous game logic requiring an extreme amount of interactivity, a close look at the trace reveals the presence of large, highly periodic, bursts of small packets. With such stringent demands on interactivity, routers must be designed with enough capacity to quickly route such bursts without delay.
Index Terms—Communication system traffic, games, measure-ment, network servers, networks.
I. INTRODUCTION
D
UE to the confluence of advances in graphics hardware, network bandwidth on the backbone and to the home, client and server hardware, and innovative software game design, on-line interactive games across all mediums have seen explosive growth. Forrester Research estimates that in 2001, there were 18 million on-line gamers. Recent measurement studies have shown that this is consistent with the observed growth in gaming traffic as Internet games now account for a growing fraction of the aggregate load[1].With the launches of Microsoft’s Xbox on-line game network and Sony’s Playstation 2 on-line game network, along with the development of emerging massively multiplayer on-line games that allow for thousands of simultaneous players, it is clear that gaming traffic will soon grow to scales far beyond what is being observed today. While not indicative of all on-line games, the class of games known as “first-person shooters” has clearly dominated much of the observed gaming traffic [1]. With a large list of popular games such as Doom, Quake, Descent, Duke Nukem 3D, Half-Life, Counter-Strike, Unreal Tournament, Tribes 2, Battlefield 1942, and Day of Defeat, these games are
Manuscript received December 16, 2002; revised March 10, 2004; approved by IEEE/ACM TRANSACTIONS ONNETWORKINGEditor M. Crovella. This ma-terial is based upon work supported by the National Science Foundation under Grant EIA-0130344 and the generous donations of Intel Corporation. Any opin-ions, findings, and conclusions or recommendations expressed in this material are those of the author(s) and do not necessarily reflect the views of the National Science Foundation or Intel.
The authors are with the Department of Computer Science, Portland State University, Portland, OR 97207 USA (e-mail: [email protected]; [email protected]; [email protected]; [email protected]).
Digital Object Identifier 10.1109/TNET.2005.850221
work behavior and usage in order to provision and design future network infrastructure. By nature, traffic generated in support of this type of application will be much different than web or TCP-based traffic which has received most of the attention in the network research community [5]–[14]. In particular, on-line gaming requires low-latency point-to-point communication as well as directed broadcast channels to facilitate its real-time game logic. In addition, such traffic tends to employ small, highly periodic UDP packets. Packets are small since the appli-cation requires extremely low latencies which makes message aggregation and message retransmissions impractical. Packets are highly periodic as a result of the game’s dynamic require-ment of frequent, predictable state updates amongst clients and servers. Finally, packets are sent via UDP since clients need to send packets at an interval that is much shorter than the time it would take to retransmit lost packets. In addition, the latency induced via socket buffers [15] and delayed acknowledgment is often too large to support meaningful interactivity.
In this paper, we examine a class of applications that is quickly becoming a major component in the network traffic mix. Specifically, we extend our characterization of Counter-Strike traffic [16] by comparing it against several other on-line games. In addition, we also characterize the game players themselves in terms of their session-time and geo-graphic distributions. Section II describes the on-line games we have examined. Section III describes the results of our traffic study. Section V analyzes the implications that gaming traffic will have on network infrastructure of the future and Section VI concludes.
II. BACKGROUND
In order to understand the characteristics of Internet gaming, we first examined the behavior of an extremely popular Counter-Strike server [4]. Counter-Counter-Strike is a modification to the popular Half-Life [3] game and has become one of the most popular and most network-intensive games played over the Internet as of this writing. Counter-Strike is a part of a large class of multi-player, on-line, first-person shooters that has dominated network gaming traffic over the last several years [1], [17]. As of May 2002, there were more than 20 000 Counter-Strike servers ac-tive [4]. The dominance of Half-Life/Counter-Strike goes back as far as 2000 [1], where measurements indicate that the appli-cation was generating a large percentage of all observed UDP traffic behind DNS and RealAudio traffic.
Counter-Strike is architected as a client-server application with multiple clients communicating and coordinating with a
FENGet al.: TRAFFIC CHARACTERIZATION OF POPULAR ON-LINE GAMES 489 central server that keeps track of the global state of the game.
In the game, two teams continuously play back-to-back rounds of several minutes in duration. Each team attempts to complete their objectives and foil those of the other team during the round. The round ends when one team manages to complete their mis-sion, when one team eliminates the other team entirely, or when time runs out. When players are eliminated from a round, they become spectators until the next round. During this time, the player can shadow another player that has not been eliminated. The game itself is played on a variety of maps which rotate based on how the server is configured. Typically, maps are rotated every 30 min, allowing for over 10 rounds to be played per map. Depending on the hardware and configuration, a Counter-Strike server can support up to 32 simultaneous players.
Traffic generated by the game can be attributed to a number of sources. The most dominant source is the real-time action and coordinate information sent back and forth between clients and server. This information is periodically sent from all of the clients to the server. The server then takes this informa-tion and performs a periodic broadcast to each client, effectively distributing the global state of the game. In addition to game physics datum, the game engine allows for broadcast text-mes-saging and broadcast voice communication amongst players all through the centralized server. The game server also supports the upload and download of customized logos that can be seen by everyone on a per-client basis. Each client is able to cus-tomize a texture map that may be placed on the surfaces of the current map. These images are uploaded and downloaded when users join the game and when a new map starts so that each client can properly display the custom decals of the other users. Finally, the game server supports downloads of entire maps, which may consist of sounds, texture libraries and a com-piled Binary Space Partitioning tree [18]. In order to prevent the server from becoming overwhelmed by concurrent downloads, these downloads are rate-limited at the server.
Note that while Half-Life variants currently dominate gaming traffic, on-line gaming is notorious for its unpre-dictability. Games rise and fall in popularity over a matter of months with new games quickly replacing older ones. Although getting a truly representative sample is difficult, on-line, mul-tiplayer, first-person shooters are dominated by games using either a Quake-based engine or an Unreal Tournament engine. To get a representative understanding of the genre, we also examine several additional games including two Quake-based games (Day of Defeat and Medal of Honor: Allied Assault) as well as an Unreal-based game (Unreal Tournament 2004).
III. COUNTER-STRIKE
A. Trace Summary
To properly evaluate the traffic generated by this represen-tative application, we hosted the Counter-Strike (version 1.3) server of one of the most popular on-line gaming communities in the Northwest region: mshmro.com [19]. Because of the large following, our exceptional Internet connectivity (OC-3 to In-ternet2, dual T3s to non-Internet2 sites), the speed of the server used (Dell Dimension 4300, Pentium 4, 1.8 GHz, 512 MB), and
TABLE I
COUNTER-STRIKENETWORKTRACEINFORMATION
TABLE II
COUNTER-STRIKETRACENETWORKSTATISTICS
the superiority of the game configuration (which includes mod-ules that eliminate cheating and deter team killing), the server quickly became heavily utilized with connections arriving from all parts of the world irrespective of the time of day. The server itself was configured with a maximum capacity of 22 players. After a brief warm-up period, we recorded the traffic to and from the server over the course of a week (April 11–18, 2002). The trace collected consisted of a half billion packets. Note that while our trace collection was limited by the size of the disk used, traffic to and from the server exhibits similar behavior week-to-week. In addition, while we are able to effectively an-alyze this single server, the results in this study do not directly apply to overall aggregate load behavior of the entire collection of Counter-Strike servers. In particular, it is expected that active user populations will not, in general, exhibit the predictability of the server studied in this paper and that the global usage pat-tern itself may exhibit a high degree of self-similarity [1], [20], [21].
Table I summarizes the key characteristics of the trace. The trace covers over a week of continuous operation of the game server. Over 300 maps were played during this time frame and more than 16 000 user sessions were established. Due to the pop-ularity of the server, each user averaged almost three sessions for the week and more than 8000 connections were refused due to the lack of open slots on the server. Table II summarizes the net-work load generated by the server. Over the 500 million packet trace, more than 60 GB of data were sent including both net-work headers and application data. The table also shows that even though the application received more packets than it sent, its outgoing bandwidth exceeded its incoming bandwidth. As shown in the table, this is because the mean size of outgoing ap-plication data packets, excluding transport and network headers, was more than three times the size of incoming application data packets.
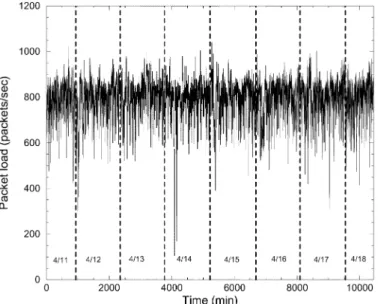
To understand the dynamics of the trace, Figs. 1 and 2 plot the per-minute average bandwidth and packet load observed at the server. As the figures show, while there is a lot of short-term
Fig. 1. Per-minute bandwidth during trace.
Fig. 2. Per-minute packet load during trace.
variation in the trace, the trace exhibits fairly predictable be-havior over the long-term. Aggregate bandwidth consumed by the server hovers around 800–900 kilobits per second (kb/s) while the server sees a packet rate of around 700–800 packets per second (pps). In addition, as Fig. 3 shows, the number of ac-tive players also shows a lot of short-term variation with fairly predictable long-term behavior. The number of players some-times exceeds the maximum number of slots of 22 as multiple clients can come and go during an interval. The trace itself also encompasses several brief network outages which did not have a significant impact on the traffic characterization since the pop-ularity of the server allowed it to recover quickly.
B. Periodicity and Predictability
While it appears that the server’s network load is relatively stable, a frequency domain analysis of the packet rate during trace shows that this is not the case across all time scales. Fig. 4
Fig. 3. Per-minute number of players for entire trace.
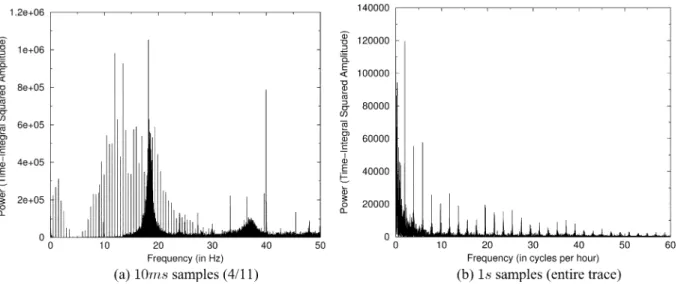
plots the power spectral density (PSD) of the packet rate de-rived from taking the discrete Fourier transform of the trace at two resolutions. Fig. 4(a) shows the PSD at a 10 ms resolution over the first day of the trace while Fig. 4(b) shows the PSD at a 1s resolution over the entire trace.1As Fig. 4(a) shows, a large
high-frequency component is observed at a frequency of around 20 Hz. Across the entire trace, Fig. 4(b) shows periodic varia-tions occurring twice an hour with steadily decreasing variavaria-tions at higher frequencies.
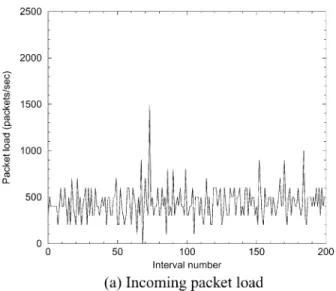
To fully understand the behavior at varying time-scales, Figs. 5 and 6 plot the total packet load, the incoming packet load, and the outgoing packet load observed at the server for the first 200 10 ms intervals of the trace. As expected, the figure exhibits an extremely bursty, highly periodic pattern. When broken down between incoming and outgoing packet load, it is clear that the periodicity comes from the game server deter-ministically flooding its clients with state updates about every 50 ms (20 Hz). This synchronous behavior is due to the game server logic itself. Since clients connect via diverse network paths, the incoming packet load is not highly synchronized. Given this behavior, Fig. 7 shows the plot of the first 200 50 ms intervals of the trace. As expected, aggregating over this interval smooths out the packet load considerably.
While the high frequency variability is smoothed over 50 ms intervals, lower frequency variability is caused by two factors: map changes and round time limits. With the former, network disruptions are caused by the 30-min map time of the server. As the server loads a new map every half-hour, the network traffic dips significantly for a short period of time. Because most of the clients will have the maps stored locally, this down time is due completely to the server doing local tasks to perform the map change over. The second component occurs due to round changes. For each map, several rounds are played with each round capped at 3 min. At the start of each round, clients re-main in a quiescent state for a short period of time, transmitting
1Memory resource limitations prevented a 10 ms resolution analysis over the entire trace
FENGet al.: TRAFFIC CHARACTERIZATION OF POPULAR ON-LINE GAMES 491
Fig. 4. Power spectrum density plots of the packet rate of trace.
Fig. 5. Total packet load for them = 10ms interval size.
and receiving a smaller number of packets. Fig. 8 shows this be-havior with a plot of the first 18 000 1 s intervals. Noticeable dips appear every 1800 (30 min) intervals with smaller variations oc-curring at a higher frequency. Because map changing and round time limits are a configuration-specific feature, this behavior is not a generic characteristic and can be affected by game admin-istrators changing maps directly, players voting to change maps or extending the current map, or a different map time limit set-ting. For this trace and server configuration, increasing the in-terval size beyond the default map time of 30 min removes the variability. Fig. 9 plots the first 200 30-min intervals of the trace. As the figure shows, the variability has been eliminated.
The predictability of the aggregate leads us to examine how predictable the resource consumption of each individual flow is in the trace. Perhaps the most interesting observation is that when the mean bandwidth of the server is divided by the total number of players allowed by the game server itself (22), the bandwidth consumed per player is on average 40 kb/s. This is no coincidence as the game is meant to be played uniformly across a wide range of network speeds, down to and including
the ubiquitous 56 kb/s modem, which at the time of the study accounted for more than 80% of the way users connected to the Internet. As typical performance of 56 kb/s modems range from 40–50 kb/s [22], it is clear that this particular game was designed tosaturate the narrowest last-mile link. Going back to the trace itself, we measured the mean bandwidth consumed by each flow at the server in order to get a picture of the bandwidth distribution across clients. Assuming minimal packet loss and a negligible difference in link-layer header overhead between the last-mile link and the server’s link, the bandwidth measured at the server will be quite close to what is sent across the last hop. Fig. 10 shows a histogram of bandwidths across all sessions in the trace that lasted longer than 30 s. The figure shows that the overwhelming majority of flows are pegged at modem rates or below even though connections arrived via diverse network mediums. The figure also shows that some flows do, in fact, exceed the 56 kb/s barrier. This is due to the fact that the client can be specially configured to crank up the update rate to and from the server in order to improve the interactivity of gameplay even further. As shown by the histogram, only a handful of elite players connecting via high speed links have taken advantage of the setting.
C. Tiny Packets
While the good news in the trace is that for a fixed set of players, the traffic generated is highly stable and predictable, the bad news is that the traffic itself is made up of large, periodic bursts of very small packets. Fig. 11 plots the probability den-sity function (PDF) of packet sizes across the 500 million packet trace. The graph is truncated at 500 bytes as only a negligible number of packets exceeded this. As the figure shows, almost all of the packets are under 200 bytes. The figure also shows that almost all of the incoming packets are smaller than 60 bytes while a large fraction of outgoing packets have sizes spread be-tween 0 and 300 bytes. Note that packet sizes include only the application data itself and not the UDP, IP, or Ethernet headers. In addition, while incoming packets have an extremely narrow distribution centered around the mean size of 40 bytes, outgoing packets have a much wider distribution around a significantly
Fig. 6. Incoming and outgoing packet load for them = 10ms interval size.
Fig. 7. Total packet load plot form = 50ms.
Fig. 8. Total packet load plot form = 1s.
larger mean. This is not surprising as the game server itself is logically playing the role of a broadcaster: taking state informa-tion from each client, aggregating the results, and broadcasting
Fig. 9. Total packet load plot form = 30min.
Fig. 10. Client bandwidth histogram.
it out to all other clients [23]. Such application-level broadcasts generate larger packets and cause the outgoing bandwidth to ex-ceed the incoming bandwidth even though the rate of incoming
FENGet al.: TRAFFIC CHARACTERIZATION OF POPULAR ON-LINE GAMES 493
Fig. 11. Packet size PDF.
Fig. 12. Session time CDF for mshmro trace.
packets exceeds that of outgoing packets. This is significantly different than aggregate traffic seen within Internet exchange points in which the mean packet size observed was above 400 bytes [1].
D. Client Characterization
1) Session-Time Distribution: Given that network load for a
client is relatively constant when connected, it is interesting to find out what the session times for players is in order to more accurately construct a source model for game traffic. Using the trace above, we extracted the total session time of each player session contained in the trace. Fig. 12 plots the session time cumulative density function (CDF) of the trace in unit incre-ments of a minute. The figure shows, quite surprisingly, that a significant number of players play only for a short time be-fore disconnecting and that the number of players that play for longer periods of time drops sharply as time increases. Note that in contrast to heavy-tailed distributions reported for most source models for Internet traffic, the session ON times for game
Fig. 13. Fitted Weibull distribution on session time PDF of mshmro trace.
players is decidedly not heavy-tailed. As the figure shows, the probability of having a particular session time drops sharply with more than 99% of all sessions lasting less than 2 hours.
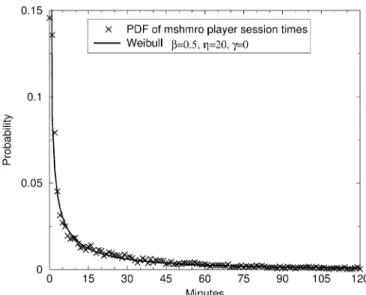
In order to develop accurate source models for game traffic, it is useful to match a distribution to the probability density func-tion of the session times. As the session times model “player” lifetimes, the PDF can be closely matched to a Weibull distribu-tion, one of the most common distributions used to model life-time distributions in reliability engineering. It is not surprising that this distribution fits, since quitting the game can be viewed as an attention “failure” on the part of the player. The general-ized Weibull distribution has three parameters , , and and is shown below:
In this form, is a shape parameter or slope of the distribu-tion, is a scale parameter, and is a location parameter. As the location of the distribution is at the origin, is set to zero, giving us the two-parameter form for the Weibull PDF
Using a probability plotting method, we estimated the shape and scale parameters of the session time PDF. As Fig. 13 shows, a Weibull distribution with , , and closely fits the PDF of measured session times for the trace.
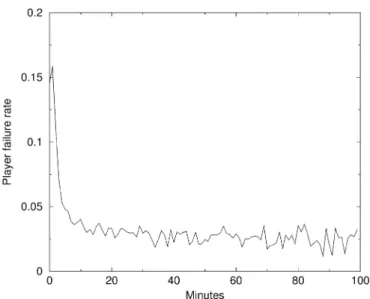
Note that this result is in contrast to previous studies that have fitted an exponential distribution to session-times of multiplayer games [20]. Unlike the Weibull distribution which has indepen-dent scale and shape parameters, the shape of the exponential distribution is completely determined by , the failure rate. Due to the memory-less property of the exponential distribution, this rate is assumed to be constant. Fig. 14 shows the failure rate for individual session durations over the trace. As the figure shows, the failure rate is not constant for shorter session times, thus making it difficult to accurately fit it to an exponential distribu-tion. Inexplicably, the failure rate ishigherfor flows of shorter
Fig. 14. Player failure rates for individual session times.
duration. While it is difficult to pinpoint the exact reason for this, it could be attributed to the fact that Counter-Strike servers are notoriously heterogeneous. Counter-Strike happens to be one of the most heavily modified on-line games with support for a myriad of add-on features [24], [25]. Short flows could corre-spond to players browsing the server’s features, a characteristic not predominantly found in other games. In addition, this partic-ular server was a friendly-fire server, a realistic setting in which team members are able to shoot each other. To protect the game from rampant team-killing, a plug-in was used to kick players for continuously killing their teammates. It may be possible that new players not cognizant of this plug-in, were quickly kicked from the server. As part of future work, we hope to characterize session duration distributions across a larger cross section of games in order to see how distributions vary between games and game genres.
2) Geographic Distribution: Because lag is such a large
factor in the quality of game play, it is expected that player populations for a particular server are clustered around the geographic location of the server itself. It is important to note, though, that geographic proximity and network proximity are only somewhat correlated. While the continued build-out of In-ternet infrastructure (in terms of exchange points and last-mile links) will continue to tighten this correlation, it is possible for players that are geographically close to a server to have considerable network latency to it.
To study the geographic distributions of game players, we ex-amined the player connections to the server which was located in Beaverton, Oregon (45.4828N, -122.825E). To perform the geographic location resolution, we employed a commercial ge-ographic mapping tool to map the IP addresses in the trace into geographic locations [26], [27]. While the tool itself is powerful, IP address to geographic location mapping is an inexact process. Thus, it was impossible to resolve all of the IP addresses ob-tained into geographic locations. Over the course of our eval-uation, the tool was able to generate geographic locations for over 60% of the IP addresses collected. The tool itself is being updated continuously, allowing for a more accurate characteri-zation over time.
Fig. 15. Longitude histogram for players in mshmro trace.
Fig. 16. Longitude CDF for players in mshmro trace.
Fig. 15 shows the player histogram of all players playing on the server over the week-long trace. The geographic location of the server is designated by a circle in the northwestern part of the United States. As the figure shows, while a large number of players reside close to the server, it is surprising to find a signif-icant portion of the player population connecting from Europe and Asia, as well.
Fig. 16 plots the longitudinal CDF of player locations for the mshmro trace. As the figure shows, the CDF shows that only 30% of all players reside within 10 degrees longitude and just over 50% of all players reside in North America. This leaves an astounding 45% of players connecting from across the ocean to play on the server. Without further studying additional servers located throughout the world, it is difficult to understand the reason for this. Some of the possible explanations for this phe-nomenon could include:
• Disparity between geographic location and network
topology: As described earlier, geographic proximity
does not always correspond to network proximity. For example, before an exchange point was brought up in the Portland metro area, connections between machines within Portland often traveled via San Jose, California.
• Application server delays dominate network delay:
End-to-end response times contain both application de-lays and network dede-lays. For the mshmro trace, however, it is unlikely that this was the case due to the speed of the server. Several sessions empirically observed during the week-long trace had single-digit (ms) delays indicating a very small baseline application server delay.
FENGet al.: TRAFFIC CHARACTERIZATION OF POPULAR ON-LINE GAMES 495
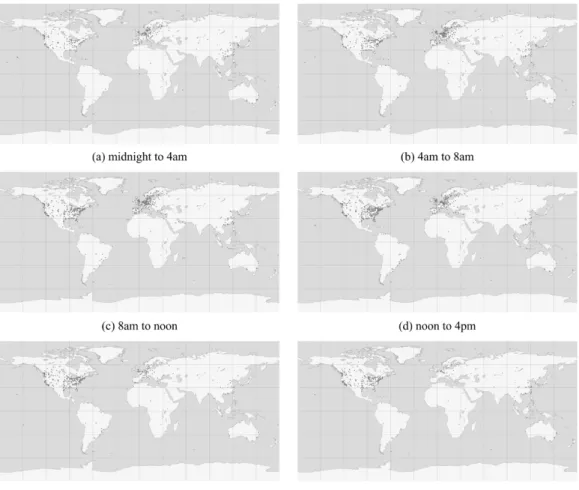
Fig. 17. mshmro player locations over time.
• Server selection mechanisms for popular games are
broken:Many gamers rely on a “Quick Start” or
auto-con-necting mechanisms to connect themselves to appropriate game servers. While it would be ideal if such mechanisms connected players to the closest server with the lowest latency, anecdotal experiences with them have shown that they can select poorly at times.
• The number of players on a server determines desirability
over delay:Many on-line games are simply not fun when
only a limited number of players are playing. For ex-ample, large maps can be boring with a small number of players since it takes a significant amount of time before players find each other to shoot. Because of this, players often connect to servers that have a reasonable number of players on them. This can make it difficult for an idle server to obtain new players, even if it has been config-ured properly and is in a prime network location
• A shortage of servers overseas:While the data in the
pre-vious section indicates a significant number of servers lo-cated in Europe, it is possible that during peak times that there simply aren’t enough servers to support the number of players. In addition, the converse may be true with U.S. players connecting to European servers during peak hours of the day. Such a phenomenon could be verified with traces from European servers.
Although by no means definitive, Fig. 17 provides a partial indication that the determining factor in the geographic
distri-bution of players is, in fact, the time of day. The figure plots player connections during 6 different 4-hour blocks of the day during the week-long trace. The times are given in the server’s local time (Pacific Standard Time). As the figure shows, the lo-cations of players is driven by the time of day, with most of the connections originating from Europe and Asia occurring during early morning and afternoon hours of the day. This is an inter-esting phenomenon as it means that for grid-based, computing on-demand, gaming services such as Butterfly.net, that a global positioning and repositioning of resources over time is required to match the usage patterns of players. For example, it would be desirable to shift game servers and computing capacity to Eu-ropean data centers during early morning hours (PST) to match where the demand is coming from.
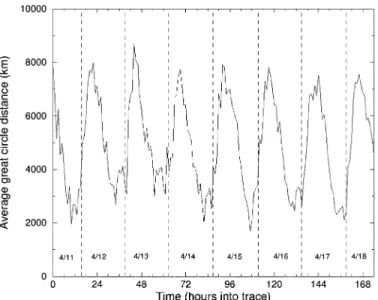
Fig. 18 quantifies the time of day phenomenon by plotting the great-circle distance (defined as the shortest distance along a sphere between two points on the sphere) between the mshmro server and its players over the duration of the trace. As the figure shows, the average distance shows regular periodic be-havior over time, with the average distance peaking during early morning hours and dipping during late afternoon and evening hours. This result is consistent with previous observations on the variation of client latencies to a number of game servers across different times of the day [20], [28]. The high correla-tion between the behavior of network latencies and geographic distances from the server, seem to indicate a fairly strong corre-lation between the two.
Fig. 18. Average great-circle distance of players over time.
TABLE III
TRACESUMMARIES FOROTHERFPS GAMES
IV. OTHERFPS GAMES A. Trace Summaries
The analysis of the Counter-Strike server reveals several im-portant features that appear to be general across all games of this genre. In order to verify this, we repeated our analysis on smaller 3-hour traces of several more popular games. In par-ticular, we analyze Day of Defeat [29], Medal of Honor: Al-lied Assault [30], and Unreal Tournament [31]. These games are derived from the two dominant game lineages that account for 8 of the top 10 games being played as of 2002. Day of De-feat is the second most popular Half-Life modification behind Counter-Strike. Medal of Honor: Allied Assault is the most pop-ular Quake III-based modification. Finally, Unreal Tournament 2003 is the latest game in the Unreal family of games. Table III briefly describes the traces collected for each server.
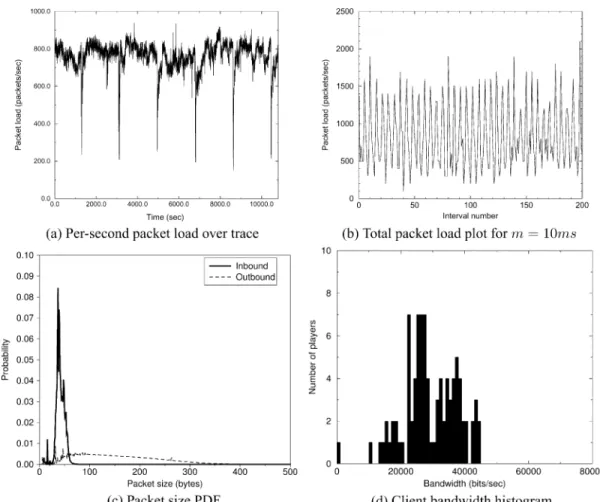
B. Day of Defeat
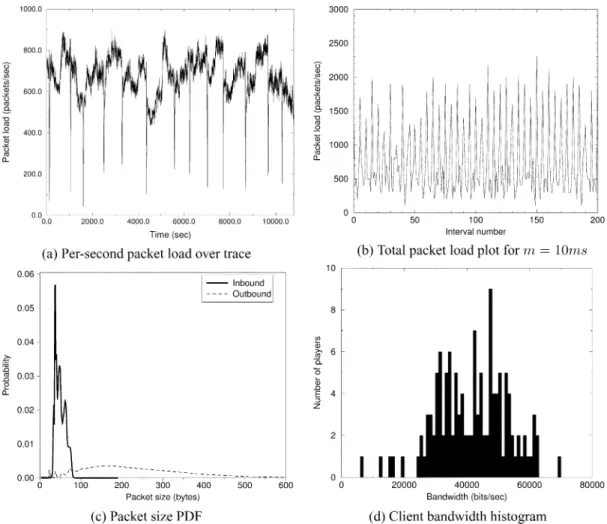
Fig. 19 shows the total per-second packet load observed at the server for the entire Day of Defeat trace, the total packet load over 10 ms intervals for the first 200 intervals of the trace, the PDF of incoming and outgoing packet sizes over the entire
targeting low-speed modem speeds regardless of the actual ac-cess medium of the client.
C. Medal of Honor: Allied Assault
Fig. 20 shows the results of a relatively busy Medal of Honor: Allied Assault server. Although the per-second packet load fluctuates somewhat due to a higher variation in the number of players active, the load consistently hovers in the range of 800–1000 pps. The figure also shows that the trace exhibits behavior that is consistent with the other two games: periodic bursts of packets every 50 ms and small packet sizes. However, unlike the other two games, Medal of Honor exhibits higher variability in its client bandwidth histogram. While a majority of players impart a load that is consistent with modem satu-ration, Fig. 20(d) shows that, relative to the other two games, a larger portion of clients maintain a throughput that is above modem rates.
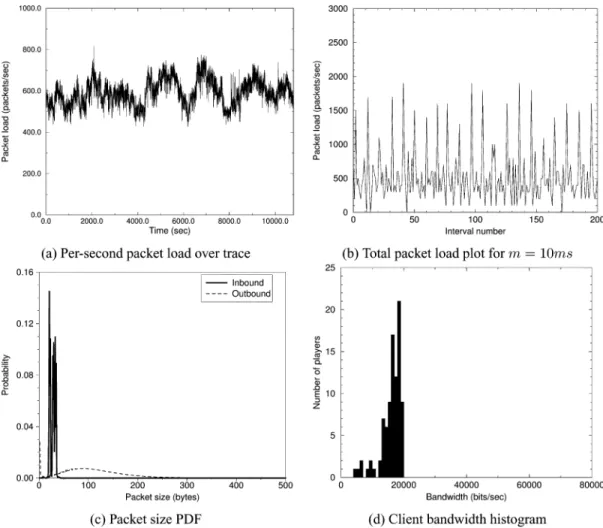
D. Unreal Tournament 2003
Fig. 21 shows the results of the Unreal Tournament 2003 trace. As the figure shows, the per-second packet load is again relatively constant. In contrast to the previous games, however, the total packet load exhibits packet bursts every 100 ms, half the rate of the other games. In addition, the size of the client and server packets is somewhat smaller. Most surprisingly, however, is the client bandwidth histogram shown in Fig. 21(d). As the figure shows, Unreal Tournament 2003 targets the saturation of
anarrowerlast-mile link versus the other games. Clients, on
av-erage, maintain throughputs that match 28.8 kb/s and 33.6 kb/s modems.
V. IMPLICATIONS ONROUTINGINFRASTRUCTURE A. The Bad News
Perhaps the most significant aspect of the trace is the obser-vation that on-line game traffic consists of large, periodic bursts of short packets. As shown in all of our traces, this character-istic is fundamental in all sufficiently loaded, highly interactive, on-line games due to the nature of the application and the un-derlying game logic. Short packets are required for low latency while highly periodic traffic allows the game to provide uniform interactivity amongst all of its clients.
Unfortunately for games, network devices are not necessarily designed for this type of traffic. With the explosion of the web and peer-to-peer networks, the majority of traffic being car-ried in today’s networks involve bulk data transfers using TCP. While TCP acknowledgment are typically small, data segments can be close to an order of magnitude larger than
FENGet al.: TRAFFIC CHARACTERIZATION OF POPULAR ON-LINE GAMES 497
Fig. 19. Day of Defeat.
game traffic. With the addition of delayed acknowledgments and piggy-backed acknowledgments, the average packet sizes of most bi-directional TCP connections will exceed those for games.
For designers of networking devices, the implications are clear. Devices should:
• Have sufficient forwarding capacity to handle small
packet sizes :Router designers and vendors make packet
size assumptions when building their gear, often ex-pecting average sizes in between 1000 and 2000 bits (125–250 bytes) [32]. Thus, a significant shift in packet size from the deployment of on-line games will make the route lookup function the bottleneck versus the link speed [33]. Routing devices that are designed for han-dling larger packets will also see significant packet-loss
or,even worse, consistent packet delay and delay jitter
when handling game traffic.
• Employ ECN: Even though such flows are constant
bit-rate flows, they are extremely fragile in the face of packet loss. Small packet loss rates quickly degrade user experience to an unacceptable level, causing the user to terminate the connection. Unfortunately, TCP regularly operates with a small loss rate in steady state. Thus, without ECN, relatively small levels of congestion will disable game applications. Note that loss and delay sensitivity is only a characteristic of first-person shooters. As shown in subsequent related work [34], other genres
such as massively multiplayer on-line role-playing games (MMORPG) can tolerate a significant amount of both before becoming too difficult to play.
• Have small buffers: While route designers may be
tempted to add buffers to temporarily absorb the packet bursts, adding buffers or combining packets does not necessarily help performance since delayed packets can be worse than dropped packets. Delayed packets degrade user experience [35] as well as consume additional pro-cessing resources at the server as it tries to keep its global state consistent. In this particular case, buffering the 50 ms packet spikes will consume more than a quarter of the maximum tolerable latency for this type of interactive game.
• Employ active queue management:While having small
buffers that employ ECN is needed, network devices must also employ active queue management algorithms that can effectively operate over short queues. Such algorithms must be properly configured and implemented [36]–[40]. In conjunction with re-designing network devices, such workloads also require that ISPs pay attention to more than just bandwidth utilization when determining the need for network upgrades. Game vendors are increasingly deploying large server farms in a single location in order to control the experience of their on-line players. Emerging games such as America’s Army, Unreal Tournament 2003, Battlefield 1942, and the Xbox-live network have concentrated deployments of
Fig. 20. Medal of Honor.
game servers that can overwhelm forwarding capacity. Similar to the way ISPs currently double capacity whenever peak usage nears 20%, ISPs must also consider “packet processing” uti-lization when determining network upgrades. Midrange routers or firewalls within several hops of large hosted on-line game servers must be carefully provisioned to minimize both the loss and delay induced by routing extremely small packets.
B. The Good News
The good news about the trace is that the predictability in re-source requirements makes the modeling, simulation, and pro-visioning on-line gaming traffic a relatively simple task as the traffic does not exhibit fractal behavior when the number of ac-tive players is relaac-tively fixed. As a result of this predictability, the traffic from an aggregation of all on-line Counter-Strike players is effectively linear to the number of active players. While this is the case, the actual number of players on-line over time may, in fact, exhibit a high degree of variability and self-similarity. Self-similarity in aggregate game traffic in this case will be directly dependent on the self-similarity of user populations [20], [21]. Since the trace itself can be used to more accurately develop source models for simulation [41], we hope to make the trace and associated game log file publicly available [16].
The other silver lining in this trace is that while the small packets of on-line games have the potential to wreak havoc on routing infrastructure, the periodicity and predictability of packet sizes allows for meaningful performance optimizations within network devices. For example, preferential route caching strategies based on packet size or packet frequency may provide significant improvements in packet throughput. We hope to ex-plore these issues further on a network processor testbed [42].
VI. CONCLUSION
With the explosion in on-line, multiplayer network games, it is becoming imperative to characterize this component of In-ternet traffic that will remain a sizable portion of overall usage. To this end, we have and analyzed the network traffic of several popular on-line games and have shown that the workload they impart consists of large, highly periodic bursts of small packets with predictable long-term rates. This can be attributed to the synchronous nature of current game designs, the need to uni-formly deliver a high degree of interactivity, and the phenom-enon ofnarrowest last-mile link saturation. In addition to the aggregate traffic behavior, we have also shown that game players themselves have interesting session-time and geographic loca-tion distribuloca-tions. Session-times of players are not heavy-tailed and have a mean that is under 30 min while the geographic lo-cations of players exhibit distinct time-of-day variations.
FENGet al.: TRAFFIC CHARACTERIZATION OF POPULAR ON-LINE GAMES 499
Fig. 21. Unreal Tournament 2003.
REFERENCES
[1] S. McCreary and K. Claffy, “Trends in wide area IP traffic patterns: A view from ames Internet exchange,” inProc. 13th ITC Specialist Sem-inar on Measurement and Modeling of IP Traffic, Sep. 2000, pp. 1–11. [2] Id Software [Online]. Available: http://www.idsoftware.com/ [3] The Official Half-Life Web Site [Online]. Available:
http://half-life.sierra.com/
[4] Counter-Strike: A Counter-Terrorism Half-Life Modification [Online]. Available: http://www.counter-strike.net/
[5] P. Barford and M. Crovella, “Generating representative web workloads for network and server performance evaluation,” inProc. ACM SIGMET-RICS, Jul. 1998, pp. 151–160.
[6] R. C. Cacereset al., “Measurement and analysis of IP network usage and behavior,”IEEE Commun. Mag., vol. 38, no. 5, pp. 144–151, May 2000.
[7] M. Crovella and A. Bestavros, “Self-similarity in world wide web traffic: Evidence and possible causes,” inProc. ACM SIGMETRICS, May 1996, pp. 160–169.
[8] A. Feldmann, A. Gilbert, and W. Wilinger, “Data networks as cascades: Investigating the multifractal nature of Internet WAN traffic,” inProc. ACM SIGCOMM, vol. 28, Sep. 1998, pp. 42–55.
[9] W. Leland, M. Taqqu, W. Willinger, and D. Wilson, “On the self-sim-ilar nature of ethernet traffic (extended version),”IEEE/ACM Trans. Net-working, vol. 2, no. 1, pp. 1–15, Feb. 1994.
[10] B. Mah, “An empirical model of HTTP network traffic,” inProc. IEEE INFOCOM, Apr. 1997, pp. 592–600.
[11] V. Paxson and S. Floyd, “Wide-area traffic: The failure of Poisson mod-eling,” inProc. ACM SIGCOMM, Aug. 1994, pp. 257–268.
[12] V. Paxson, “Empirically derived analytic models of wide-area TCP con-nections,”IEEE/ACM Trans. Networking, vol. 2, no. 4, pp. 316–336, Aug. 1994.
[13] , “End-to-end Internet packet dynamics,” in Proc. ACM SIG-COMM, Sep. 1997, pp. 139–152.
[14] A. Veres and M. Boda, “The chaotic nature of TCP congestion control,” inProc. IEEE INFOCOM, Apr. 2000, pp. 1715–1723.
[15] A. Goel, C. Krasic, K. Li, and J. Walpole, “Supporting low latency TCP-based media streams,” inProc. 10th IEEE Int. Workshop on Quality of Service (IWQoS), May 2002, pp. 193–203.
[16] W. Feng, F. Chang, W. Feng, and J. Walpole, “Provisioning on-line games: A traffic analysis of a busy counter-strike server,” inProc. ACM SIGCOMM Internet Measurement Workshop, Marseille, France, Nov. 2002.
[17] GameSpy: Gaming’s Home Page. GameSpy Industries (2002). [Online]. Available: http://www.gamespy.com/
[18] H. Fuchs, Z. M. Kedem, and B. F. Naylor, “On visible surface generation bya prioritree structures,” inProc. ACM SIGGRAPH, vol. 14, Jul. 1980, pp. 124–133.
[19] Mshmro.com [Online]. Available: http://www.mshmro.com/
[20] T. Henderson and S. Bhatti, “Modeling user behavior in networked games,” inACM Multimedia, 2001, pp. 212–220.
[21] T. Henderson, “Latency and user behavior on a multiplayer game server,” inProc. Networked Group Communication, 2001, pp. 1–13. [22] J. Kristoff. (1997) Understanding 56 Kbps Modems. [Online]. Available:
http://homepage.interaccess.com/ jkristof/56kmodem.html
[23] M. Claypool, D. LaPoint, and J. Winslow, “Network analysis of Counter-Strike and Starcraft,” inProc. 22nd IEEE Int. Performance, Computing, and Communications Conf. (IPCCC), Phoenix, AZ, Apr. 2003, pp. 261–268.
[24] Half-Life Admin Mod Home [Online]. Available: http://www.ad-minmod.org/
[25] AMX Mod Server Plugin [Online]. Available: http://amxmod.net/ [26] Geobytes Home Page (2003). [Online]. Available:
http://www.geobytes.com/
[27] W. Feng and W. Feng, “On the geographic distribution of on-line game servers and players,” inProc. NetGames 2003, May 2003, pp. 173–179.
on user performance in Warcraft III,” inProc. NetGames 2003, May 2003, pp. 3–14.
[35] I. S. MacKenzie and S. Ware, “Lag as a determinant of human perfor-mance in interactive systems,” inProc. INTERCHI, 1993, pp. 488–493. [36] S. Floyd and V. Jacobson, “Random early detection gateways for con-gestion avoidance,”IEEE/ACM Trans. Networking, vol. 1, no. 4, pp. 397–413, Aug. 1993.
[37] S. Kunniyur and R. Srikant, “Analysis and design of an adaptive virtual queue (AVQ) algorithm for active queue management,” inProc. ACM SIGCOMM, Aug. 2001, pp. 123–134.
[38] W. Feng, D. Kandlur, D. Saha, and K. Shin, “A self-configuring RED gateway,” inProc. IEEE INFOCOM, Mar. 1999, pp. 1320–1328. [39] , “The BLUE active queue management algorithms,”IEEE/ACM
Trans. Networking, vol. 10, no. 4, pp. 513–528, Aug. 2002.
[40] C. Hollot, V. Misra, D. Towsley, and W. Gong, “On designing improved controllers for AQM routers supporting TCP flows,” inProc. IEEE IN-FOCOM, 2001, pp. 1726–1734.
[41] M. Borella, “Source models of network game traffic,” Computer Commun., vol. 23, no. 4, pp. 403–410, Feb. 2000.
[42] E. Johnson and A. Kunze, “IXP1200 Programming,” Intel Corp., 2002.
Wu-chang Fengreceived the Ph.D. degree in com-puter science and engineering from the University of Michigan, Ann Arbor, in 1999.
He is an Assistant Professor in the Computer Science Department, Portland State University, Port-land, OR. His research interests include networking, security, and on-line games.
Dr. Feng was awarded the IEEE Communications Society 2003 William R. Bennett prize as well as a 2002 IBM Research Best Paper prize in 2002. He is a member of the ACM.
Wu-chi Fengreceived the Ph.D. degree in computer science and engineering from the University of Michigan, Ann Arbor, in 1996.
He is an Associate Professor in the Computer Science Department, Portland State University, Port-land, OR. His research interests include multimedia networking, video sensor systems, and network gaming.
Dr. Feng is currently serving as an editor for the ACM/SpringerMultimedia Systems Journal. He is a member of the ACM.
Jonathan Walpolereceived the Ph.D. degree in com-puter science from Lancaster University, U.K.
He is a Professor in the Computer Science De-partment, Portland State University, Portland, OR. His research interests include operating systems, networking, distributed systems and multimedia computing.