SOCIAL SECURITY: AN EVALUATION OF CURRENT PROBLEMS AND PROPOSED SOLUTIONS
by
DANIEL PAUL LENSING
B.B.A., University of Iowa, 2008
A REPORT
submitted in partial fulfillment of the requirements for the degree
MASTER OF ARTS
Department of Economics College of Arts and Sciences
KANSAS STATE UNIVERSITY Manhattan, Kansas
2014
Approved by: Major Professor William F. Blankenau, PhD
Abstract
This paper examines several different issues which could make the various Social Security programs insolvent. I evaluate each cause and how it is related to the problems experienced by each program to determine potential policy changes. I draw the majority of my data and information from peer-reviewed scholarly articles, as well as government agencies such as the Social Security Administration, Bureau of Labor Statistics, and the Congressional
Research Service.
Section 1 of the paper explains the history of the Social Security program and the circumstances creating it. Section 2 goes into greater detail explaining different issues which could make the system insolvent. These areas are: earnings inequality, changes in healthcare, increased life expectancy, changes in the dependency ratio, general trust fund issues, disability trust fund issues, political climate, and recessions/reduced earnings. In Section 3, I evaluate two different proposed plans to fix Social Security. The first plan is an academic plan, the Diamond-Orszag Plan; the second is a plan created by a think-tank, The Heritage Plan. Section 4 gives a conclusion of the implications of the paper and explains the benefits and drawbacks of the two evaluated plans.
After evaluating all the problems with Social Security and the two proposed plans, I come to the conclusion that neither plan would be ideal by itself. The Diamond-Orszag Plan is the most politically feasible plan, as it doesn’t change the framework of the current program. A combination of the two plans would be most beneficial, as The Heritage Plan has policy
specifically targeting the problems with the Medicare system, where the Diamond-Orszag Plan does not. The three different plans for changing the disability system I evaluate in Section 2.5 are specific, targeted plans and could be a nice addition to a plan such as the Diamond-Orszag
Plan. In any case, the sooner politicians finally start taking Social Security’s instability seriously, the better. The longer we wait, the more complex and difficult the problem will become.
Table of Contents
List of Figures ………... vi
List of Tables ………... vii
Abbreviations ………. viii
Chapter 1: Introduction ……….. 1
1.1 A Brief History of the Origins of Social Security ……… 1
1.2 Circumstances Creating Social Security ……….. 2
1.3 Social Security's Initial Design ……… 3
Chapter 2: Social Security's Current Challenges ………... 6
2.1 Growing Income Inequality ………. 6
2.2 The Role of Healthcare in Social Security's Insecurity ………. 10
2.3 Increased Life Expectancy ………. 13
2.4 Effects of Changes in the Dependency Ratio ……… 16
2.5 Old Age and Survivors Trust Fund Issues ………. 18
2.6 Disability Trust Fund Problems ………. 20
2.7 Lack of Political Pressure for Reform ………... 27
2.8 Recessions and Declines in Taxable Earnings ………... 30
Chapter 3: Evaluation of Proposed Plans to Fix Social Security ………. 33
3.1 The Diamond-Orszag Plan ………. 33
3.2 The Heritage Plan ……….. 37
Chapter 4: Conclusion ……….. 42
List of Figures
Figure 1 ……… 58 Figure 2 ……… 58 Figure 3 ……… 59 Figure 4 ……… 59 Figure 5 ……… 60 Figure 6 ……… 60 Figure 7 ……… 61 Figure 8 ……… 61 Figure 9 ……… 62List of Tables
Table 1 ………. 54 Table 2 ………. 55 Table 3 ………. 56 Table 4 ………. 56 Table 5 ………. 57Abbreviations
American Institute of Certified Public Accountants ... AICPA Annual Report of the Board of Trustees of the Federal Old-Age and Survivors Insurance and
Federal Disability Insurance Trust Funds ... Trustees Report Board of Trustees of the Federal Old-Age and Survivors Insurance and Federal Disability
Insurance Trust Funds ... Trustees Committee on Economic Security ... CES Earnings Support Insurance ... ESI Gross Domestic Product ... GDP Old-Age and Survivors Insurance and Federal Disability Insurance Trust ... OASDI Old-Age and Survivors Insurance ... OASI Personal Disability Insurance ... PDI Social Security Disability Insurance ... SSDI Universal Short-Term Private Disability Insurance ... UPDI
Chapter 1: Introduction
1.1 A Brief History of the Origins of Social Security
Social Security is an important pillar of the American retirement system, and something that many elderly Americans rely upon to live a financially secure life. The program “provides the majority of income for two-thirds of elderly beneficiaries, and all income for 20 percent of elderly beneficiaries” (Diamond and Orszag, 2005a, p. 11). The notion of social insurance was not a necessity in the American economy prior to the Industrial Revolution. Prior to that,
America was still a heavily rural nation with the majority of citizens performing agricultural jobs where they provided their own means by which they lived (Yasar, 2009). They grew and
provided their own food, and “lived in extended families that provided the main form of economic security for family members who could not work” (DeWitt, 2010, p. 2).
The Industrial Revolution, and all the scientific and medical advances that were created by it, increased life expectancy for American citizens and also caused a great shift of workers from rural to urban (Yasar, 2009). For example, the number of Americans aged 65 and older grew from 1.15 million in 1870 to 9.02 million in 1940, an increase of 784 percent (DeWitt, 2010). Meanwhile, in 1880, America was 72 percent rural and 28 percent urban. Over just a 50 year period, this shifted to 56 percent urban and 44 percent rural in 1930 (DeWitt, 2010).
Beyond these factors, the Industrial Revolution also caused a commodification of labor because America's economy switched from an agricultural economy to an industrialized
capitalist economy. Before this transformation of labor, people simply got old and were unable to work. Only after the commodification of labor did the notion of “retirement” develop (Myles, 1984). “Older workers could not maintain levels of productivity required by a constant search
for efficiency in production, increasing mechanization and rationalization of the labor process.” (Yasar, 2009, p. 845) To solve this problem, retirement was created as a way to free the
enterprise from having to provide work for older, less productive workers. This helped managers realize “they could alter not only the 'stock' of labor (that is the composition of the labor force) but also its 'flow'” (Myles, 1984, p. 13). This principle of controlling the flow of labor was the primary reason why public and private pension systems were created (Yasar, 2009).
1.2 Circumstances Creating Social Security
By the time America instituted Social Security in 1935, 20 nations already had a form of social retirement assistance (DeWitt, 2010). Germany was the first in the world to create a social retirement system in 1889 (DeWitt, 2010; Martin and Weaver, 2005). European retirement systems not only raised funds from workers and employers, but also from general government funds. This was a key difference between the American system and the Europeans, and
something that President Franklin Roosevelt stressed before Social Security's creation (DeWitt, 2010).
In the years prior to the passing of Social Security in 1935, there was already a push by many organizations and social advocates for a social welfare system (Martin and Weaver, 2005). By 1935, 30 states had already put in place some form of old-age social assistance (DeWitt, 2010). There were several federal pension movements being discussed and advocated for
throughout the country. The most famous of these plans was the Townsend Plan, which was very generous (Martin and Weaver, 2005). The plan would give elderly individuals, who were 60 and older, $200 a month (DeWitt, 2010; Martin and Weaver, 2005). At the time, the average working American only made around $100 a month (DeWitt, 2010; Martin and Weaver, 2005).
With talk about implementation of these various plans escalating, President Roosevelt felt it was necessary to put together a realistic and functional form of social old-age assistance
(Kollmann, 1996). He created the Committee on Economic Security (CES) to study the social retirement plans already in place in other countries around the world (Kollmann, 1996). It didn't take long for the CES to finish their work; they started in 1934, and submitted their proposal to Congress in 1935 (DeWitt, 2010; Kollmann, 1996). On August 14, 1935, after only 18 days of debate in the House and Senate, the bill passed (DeWitt, 2010; Martin and Weaver, 2005).
1.3 Social Security's Initial Design
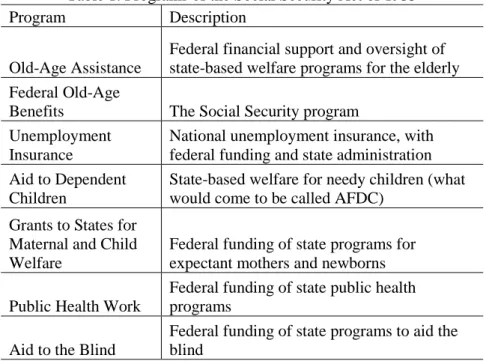
The original Social Security Act had seven programs that made up the entire 1935 bill. These programs were: old-age assistance, federal old-age benefits, unemployment insurance, aid to dependent children, grants to states for maternal and child welfare, public health work, and aid to the blind (Kollmann, 1996; Martin and Weaver, 2005). Table 1 provides a brief description of each of these programs.
The largest and most significant of these programs was the Federal Old-Age Benefits program, the forerunner to today's Old-Age, Survivors, and Disability Insurance (OASDI). This is the original Social Security and provided assistance to covered workers when they became eligible at age 65 (DeWitt, 2010; Martin and Weaver, 2005). Many people eligible for the program when it started paying out benefits in 1942, had not worked long enough under the program requirements to obtain an adequate benefit amount based on actuarial guidelines (DeWitt, 2010). Thus, there was an initial subsidy for these workers to ensure they were able to receive the minimum benefits to ensure them “adequate” and “equitable” monthly payments to afford them some small level of economic security in retirement (DeWitt, 2010).
The Social Security Act of 1935 had three major policy-making areas: coverage, benefits, and financing. Coverage was very limited initially, with approximately 60 percent of the labor force participating in the program in 1935 (Kollmann, 1996). Occupational category was the determining factor for eligibility for the program. The majority of covered workers eligible for benefits were employed in commerce and industry (Martin and Weaver, 2005). “Among the excluded groups were the self-employed, government employees, persons already age 65, the military, professionals (doctors, lawyers, etc.), employees of nonprofit organizations, and agricultural and domestic workers” (DeWitt, 2010, p. 7).
Benefits were only paid to retirees and individual workers; no dependents were eligible for post-mortem payments (Kollmann, 1996). These benefits were calculated based on the total cumulative wages a worker earned in covered employment (Martin and Weaver, 2005). The greater the length of time spent in covered employment, the greater the benefit amount. Also, the benefit formula had a weighting aspect (which still exists today), such that “workers with lower earnings levels receive a proportionately higher benefit, relative to their prior earnings, than workers with high wages” (DeWitt, 2010, p.6)
Payroll taxes were placed on employers and employees equally to be the primary
financing mechanism for Social Security. The initial tax rate was 1 percent each (employer and employee separately), with an increase every three years to reach an eventual rate of 3 percent for each party in 1949 (Kollmann, 1996; Martin and Weaver, 2005). The initial wage cap was $3,000, which subjected 92 percent of all covered wages and 97 percent of all covered workers to Social Security taxation (DeWitt, 2010).
A standard problem with starting a pension system is that costs are lower in the beginning when few people qualify, but increase over time when more people qualify, and can increase at a
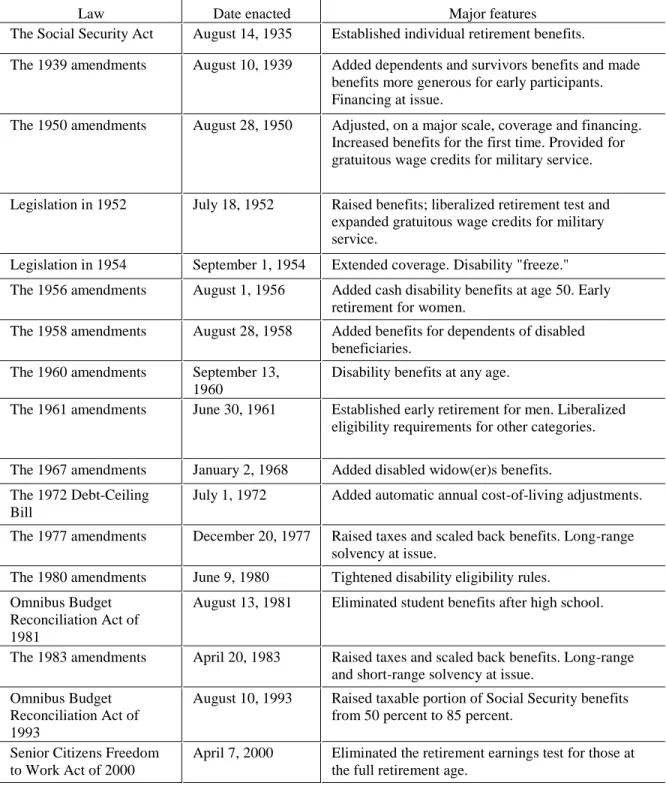
pace that could possibly outgrow the growth rate of funding (DeWitt, 2010). As a means to combat this problem, the Social Security reserve was created. Several members of Congress (mainly Republicans) believed that the reserve was unworkable (Martin and Weaver, 2005). They “made two arguments: (1) Congress would spend the money in the reserve for purposes of which opponents might not approve, and (2) the idea of government bonds as a repository of genuine economic value was dubious” (DeWitt, 2010, p. 5). Despite the opposition, the law was passed with large bipartisan support (See Table 2 for brief descriptions of all major Social
Security legislation).
The initial qualifying age of 65 was set based on two principles. The first was that close to half of the states’ social pensions used this as the eligible age for benefits (DeWitt, 2010). Secondly, the actuaries working for the CES obtained a reasonable actuarial balance with this retirement age, after experimenting to find the cost effects of various different ages (DeWitt, 2010).
Chapter 2: Social Security's Current Challenges
Social Security benefits are calculated using a formula which takes into account the following five variables: a worker’s career earnings, career earnings relative to the general wage level, number of years in employment, age at retirement, and earnings by a given worker’s spouse (Garr and Morrissey, 2009). Those people who retire early and begin receiving benefits at age 62 receive lower monthly benefit payments than an individual who waits to begin
collecting benefits at the normal retirement age of 66 (Biggs, 2011). The benefit amount is based on an average of the highest 35 years of a worker’s covered earnings, adjusted for wage growth, and then divided by 12 to produce the monthly benefit amount (Biggs, 2011). This amount is then entered into a progressive benefit formula to ensure that the amount of benefits replaces a larger proportion of pre-retirement earnings for lower income individuals than high-income individuals (Biggs, 2011). This formula is key to understanding many of the challenges facing the system currently. To ensure solvency in the long run for Social Security, problems affecting these variables mentioned above will need to be addressed.
2.1 Growing Income Inequality
One of Social Security's major problems is a widening gap in income inequality between the wealthy and the poor. According to Yasar (2009), a “declining wage share and fewer ‘good jobs,’ along with increasing wage inequality coupled with the presence of the cap on taxable earnings, seem to be the important macroeconomic factors that have been weakening total contributions to the system” (p. 856). The cap on taxable earnings for 2013 was $113,700 (Social Security Administration, 2014b). Today, this cap on taxable earnings places
approximately 83 percent of earnings under the taxable limit, whereas in 1983 approximately 90 percent of earnings were under the taxable limit (Garr and Morrissey, 2009).
Figure 1 shows that the percent of workers earning below the taxable earnings cap has been increasing at the same time the percent of total earnings below the cap is decreasing. This ever-widening gap between these two statistics began around 1980, and heightened in the late 1990s primarily “because salaries for top earners grew faster than the pay of workers below the cap” (Mulvey, 2010, p. 4). Between 1979 and 2007, the top one percent of income earners accounted for 53.9 percent of the total increase in U.S. income (Price and Sommeiller, 2014). During this same time period, the average income for the bottom 99 percent of earners grew by just 18.9 percent (Price and Sommeiller, 2014). Even more substantial is that between 2009 and 2012 (post-Great Recession), the top one percent of income earners captured 95 percent of total income growth (Saez, 2013).
The growing disparity in income levels has been primarily due to an increasing gap in the wage and profit share between labor and capital. In 2005, while labor experienced its share of corporate income falling to its lowest level (79.1 percent), capital reached its highest level (20.9 percent) since 1960 (Yasar, 2009). To accompany this shift in shares of corporate income, the demographic for shares of gross domestic product (GDP) also changed. In 2006, the share of corporate profits in GDP obtained its highest level at 10.3 percent, when wages were at its lowest share of GDP (45.3 percent) since the 1960s (Yasar, 2009).
This widening gap in income inequality has led to an ever-increasing gap between per capita contribution and per capita benefit. Two important variables affecting per capita contribution are the average rate of contribution (Social Security tax) and average real wages, both of which are being negatively affected by the rising level of income above the taxable
earnings cap (Yasar, 2009; Price and Sommeiller, 2014). As can be seen in Figure 2, in 1970 the ratio of per capita benefit to per capita contribution (calculated as [per capita benefit/per capita contribution] for a given year) was approximately 106 percent. As of 2012, this ratio had risen to approximately 302 percent. That is a vast disparity in a fairly short period of time, and it can be attributed to the fact that “real hourly wages declined steadily between the mid-1970s and the late 1990s” (Yasar, 2009, p. 854). Over the last three business cycles, the number of “good jobs” paying a minimum of $17 per hour has declined (Yasar, 2009). Also, the average income of the top one percent of income earners grew over ten times as much (200.5 percent) as the bottom 99 percent from 1979 to 2007 (Price and Sommeiller, 2014).
Yet another reason for the decline or stagnation in wages is the increasing cost of fringe benefits (non-taxed benefits), such as Healthcare Savings Accounts and health insurance (Yasar, 2009). The rising costs of healthcare have caused health insurance plan premiums to continually increase year after year, increasing 160 percent from 1999 to 2011 (Henry J. Kaiser Family Foundation, 2011). Employers cannot afford to pay continually higher premiums on health insurance for workers and thus may intrinsically deduct it from potential wage increases, or pass on the premium costs to employees. Between 1999 and 2011, workers contributions to
premiums rose 168 percent, which is higher than the 160 percent increase in overall premiums (Henry J. Kaiser Family Foundation, 2011). Because fringe benefits are untaxed, the increasing costs associated with them decreases a given employee’s taxable earnings, thus decreasing the amount an employee pays into Social Security (Garr and Morrissey, 2009). The 2008 Social Security Trustees' Report projected that fringe benefits will lower real wage growth from 1.3 percent to 1.1 percent and increase the 75-year deficit by about 0.23 percent of taxable payroll.
state-by-state basis. Nationally, there are six percent of people who earn above the taxable earnings cap. But when looked at by individual state, the percentages vary from a high of 12 percent in New Jersey, to a low of two percent in South Dakota (Mulvey, 2010). A small portion of these differences can likely be adjusted for based on cost of living, but that is very minute. Also, over time poor states tend to stay poor, while wealthy states remain wealthy (Gelman, 2013). The five states with the lowest percentage of workers earning above the cap are South Dakota, Mississippi, North Dakota, Arkansas, and West Virginia (Mulvey, 2010). The five states (including districts) with the highest percentage of workers above the cap are New Jersey, District of Columbia, Connecticut, Massachusetts, and Maryland (Mulvey, 2010). Thus, it is interesting that there is not just a disparity among workers across the country, but there is also a large disparity between the wealthiest and poorest states. Looking at the five highest-percentage states, they are all in the same wealthy, highly populated geographic region and located near Wall Street in New York, or our nation’s capital in the District of Columbia (Gelman, 2013). As a corollary, the five smallest-percentage states are located in historically poor, and largely rural locations (Gelman, 2013).
As stated earlier in this section, due to growth of earnings above the taxable earnings cap, only about 83 percent of earnings are currently subject to taxation (Garr and Morrissey, 2009). In 1983, this level was at 90 percent (Garr and Morrissey, 2009; Urban Institute, 2013b). If the earnings cap were restored back to the original level at 90 percent of earnings, 43 percent of the projected shortfall could be eliminated (Mulvey, 2010). This 90 percent level of earnings would have been approximately $216,900 in 2013 (Urban Institute, 2013b). If the cap on earnings were eliminated altogether, the program could be put back in actuarial balance over the 75-year
horizon (Mulvey, 2010). These are important implications to consider when evaluating potential plans to fix Social Security.
2.2 The Role of Healthcare in Social Security's Insecurity
Total net benefits received by an individual include cash benefits, service benefits, and rehabilitation services (Yasar, 2009). These divided by the number of people receiving Social Security benefits equal per capita benefits, which was discussed in the previous section. In 1965, the share of cash benefits was approximately 95 percent, with medical benefits (service and rehabilitation combined) only comprising approximately five percent (Yasar, 2009). Since this time, this gap has been rapidly shrinking to approximately 60 percent and 40 percent,
respectively (Yasar, 2009). These numbers show that healthcare expenditures have been claiming an increasingly larger share in total benefits, which “partially explains why per capita net benefits have been increasing at an increasing rate and widening the gap between per capita benefit and per capita contributions.” (Yasar, 2009, p. 856).
There are many possible determinants that may have caused this change, including an increasing number of beneficiaries, aging population, provision of expensive age-related healthcare services, and medical inflation, among others (Yasar, 2009). The problem is in finding the principal determinant of this increase in per capita benefit. Despite the typical assumption that the primary determinant is due to the aging of the Baby Boom generation, studies in the health services research literature show otherwise (Yasar, 2009). Burner, McKusick and Waldo (1992) projected that the aging population adds another 0.5 percent to expenditure growth each year. This number corresponds to 0.06 of the total projected annual spending growth of 8.4 percent (Reinhardt, 2003).
Expensive age-related healthcare services are yet another possible determinant, yet the research seems to state otherwise. Increases in life expectancy mean that more of the elderly will die at older ages, and end-of-life costs generally decline with age at death (See Table 3) (Cutler
and Sheiner, 1998). Also, the baby boom generation that is currently aging and entering into retirement is considerably healthier than previous generations. Disability rates among the elderly dropped over three percent from 1982 to 1994 (Cutler and Sheiner, 1998). Thus, increasing life expectancy and declining disability rates play important roles in lessening the effect of aging on Medicare spending (Cutler and Sheiner, 1998).
With the aging population and age-related healthcare services not the driving factors in Medicare spending, that leaves medical inflation as the last major driver of increasing costs. Between 1980 and 2004, household consumption expenditures on healthcare services (all services, not just specific to the elderly) rose from eight percent to 12 percent (Barbosa-Filho et al., 2007). “In 2005, the medical price index increased by well over 300 percent (1980=100) while the overall CPI increased only about 180 percent during the same time” (Yasar, 2009, p. 861). It is estimated that in 2020 “health spending on the elderly is likely to be two to three times the income available for all other goods and services” (Fuchs, 1999, p. 5).
A survey done in 1995 of 50 leading health economists found that 81 percent agreed with the statement “The primary reason for the increase in the health sector's share of GDP over the past 30 years is technological change in medicine” (Fuchs, 1999, p. 13). This rapid growth in healthcare expenditures was primarily due to a large increase in medical innovation for patients, such as new drugs, magnetic resonance imaging, angioplasties, hip replacements, and other costly new medical devices (Fuchs, 1999). Reinhardt (2003) states, “key factors [behind the growth in healthcare spending] include rising per capita incomes, the availability of promising but costly new medical technology, workforce shortages that can drive up the unit cost of healthcare, and the asymmetric distribution of market power in healthcare that gives the supply side of the sector considerable sway over the demand side” (p. 37).
There are only two ways to avoid pending economic and social crises from current healthcare expenditure trends. America needs to either slow the growth of healthcare spending on the elderly or find new ways to fund additional increases (Fuchs, 1999). Fuchs (1999) gives three routes to slow the growth of healthcare spending: “(1) reduce the rate of growth of the prices of the resources used in health care (for example, squeeze physicians’ incomes); (2)
produce the same or more services with fewer resources (for example, automate laboratory tests); or (3) slow the rate of growth of real services to patients” (p. 15). The first two options can make substantial differences in the short-run, but in the long-run, the only option that could sustainably keep costs down would be to limit services. Unfortunately, all of these options will likely
jeopardize quality of care (Fuchs, 1999).
If these three options mentioned above are not politically possible, then the only other route would be through increases in payments via taxes or higher out-of-pocket costs (Fuchs, 1999). Even with policy changes, Social Security taxes will likely have to rise, and are projected to reach approximately 16 percent by 2050 (Gonzalez-Eiras and Niepelt, 2008; Diamond and Orszag, 2005b). This 16 percent rate will certainly not be politically popular and with continual rising Medicare costs, it will be difficult to bring about enough political pressure to raise
Medicare tax rates even further (Gonzalez-Eiras and Niepelt, 2008). The only other option left is for greater out-of-pocket costs for seniors, many of whom are already on a fixed income that is stretched to the maximum. In 2020, an elderly person with average yearly medical costs of $25,000 (1995 dollars) would be required to make a 20 percent cut in other goods and services just to pay for additional medical expenses beyond what would be covered under Medicare (Fuchs, 1999).
without drastic increases to tax rates, out-of-pocket costs, or reduced medical services. One solution may be to increase admissions to medical schools, thus creating more doctors and nurses to better meet demand. Looking at information for one of the country's top medical schools, George Washington University, they only admit one percent of their applicants each year (George Washington University, 2013). The application process also takes over a year to complete (George Washington University, 2013). Many students must take out loans just to apply for medical schools, as well as having to submit multiple payments for first and second rounds of applications. This is in addition to the outrageously high costs to actually attend medical school. The website Medical School Confidant, states that a student with a 3.9 GPA and a score of 40 (99.9th percentile) on the MCAT still has a 10 percent chance of getting denied admission to any medical school.
2.3 Increased Life Expectancy
The Social Security Administration estimates that by 2050, the average 65-year-old will live 21 years in retirement. In 1955, the expected lifespan for a 65-year-old in retirement was just 15.1 years (Garr and Morrissey, 2009). This will be a significant change to take place in less than a century's time.
Over the history of Social Security, contributions have grown at a much faster pace than life expectancy at retirement (Yasar, 2009; Garr and Morrissey, 2009). This can be attributed to several different factors, including policy changes regarding Social Security’s trust funds, implementing taxation on Social Security benefits, and growth in real GDP outpacing growth in life expectancy (DeWitt, 2010; Social Security Administration, 2013a). The research appears to be ambiguous in showing a definitive positive or negative relationship between GDP growth and
life expectancy (Echevarria and Iza, 2006).
Some studies have shown that nations with low life expectancies experience higher GDP growth rates with increases in life expectancy, but nations with high life expectancies experience lower GDP growth rates with increases in life expectancy (Echevarria and Iza, 2006). What this means is that the positive relationship between GDP growth and increases in life expectancy is higher for countries with low life expectancies than it is for countries with high life expectancies. Economic intuition would lead one to believe this is attributed less to increases in life expectancy, and more with the fact that most countries with high life expectancies have larger,
well-established economies that typically do not experience large GDP growth rates. Thus, one would expect the latter of these two scenarios to be most likely to appear in the U.S., although that is not entirely the case.
Real per capita GDP (2005 dollars) has grown over 185 percent in the period from 1960-2012 (calculated using data from the World Bank (2014)). Meanwhile, life expectancy at age 65 has grown a little over 23 percent in the same time period, with life expectancy at birth growing a little over 12.5 percent from 1960-2012 (Garr and Morrissey, 2009; Social Security
Administration, 2013a). Zhang and Zhang (2005) describe it best by showing that the growth rate increases at a decreasing rate with increases in life expectancy, which falls in line with what the data shows in Figure 3. This figure shows that the period from 1960 to 2000 saw rapid growth in real per capita GDP, but has since been increasing at a decreasing rate. During the same time period, the growth rates for life expectancy have remained fairly constant. This must mean that although the United States was a well-established economy during the period 1960 to 2000, it must not have yet been to the scale to which it experienced lower GDP growth rates with increasing life expectancy, and thus shows that Zhang and Zhang (2005) and Echevarria and Iza
(2006) are correct. This shows that there appears to be a level of output an economy reaches where the growth rate of GDP starts to follow the growth pattern of life expectancy, thus causing GDP growth to increase at a decreasing rate. This may prove that as GDP growth continues to increase at a decreasing rate with increases in life expectancy, there is a good likelihood that the 0.5 percent expenditure growth rate attributed to aging will take up a greater share of the
increasing costs of Medicare (Burner, McKusick, and Waldo, 1992).
According to a Gallup Survey, the average U.S. retirement age is now 61, having risen from 57 in 1991 (Gallup Economy, 2013). The same survey also found that the average non-retired American now plans to retire at age 66, up from age 60 in 1995 (Gallup Economy, 2013). The workforce has changed dramatically since the 1990s. Currently, 19 percent of people age 65 and older remain in the workforce, up from 11 percent in the early 1990s (Langfield, 2013). Similarly, for 75-year-olds, the number has increased from 4 percent to 8 percent over the same period (Langfield, 2013).
Labor force participation by the elderly has increased as well. The Bureau of Labor Statistics reports that 40 percent of workers age 55 and older are now employed or looking for work (Langfield, 2013). This statistic is up from 30 percent in the 1990s (Langfield, 2013). These numbers can be explained by Echevarria and Iza (2006), where they find that as life expectancy increases, the retirement age also increases, but not proportionally.
If these trends continue, as it appears they will, it should alleviate some of the pressure on Medicare and Social Security costs as elderly workers will be more likely to have private health insurance offered through their employers. If the values shown in Table 3 continue to hold true into the future, the increased impact on Medicare and Social Security costs from increases in life expectancy will be less than expected. Although, even with the elderly working later into life,
they are also going to receive benefits longer as a result of increasing life expectancy. Thus, even with the average retirement age rising, unless it begins outpacing life expectancy, it will still contribute to Social Security’s insolvency.
2.4 Effects of Changes in the Dependency Ratio
The dependency ratio is defined as the ratio of active workers to retirees at a given point in time (Garr and Morrissey, 2009). Garr and Morrissey (2009) state that many critics of Social Security claim that “because the large Baby Boom generation is entering retirement age and Americans are living longer, the dependency ratio will increase dramatically in the coming years” (p. 4). This is not necessarily the case though. Looking back at the last paragraph of the
previous section, the current labor force trending toward a later retirement age should be a large boon for the dependency ratio. Also, as is predicted by both Gonzalez-Eiras and Niepelt (2008) and by Diamond and Orszag (2005a), the payroll tax rate for Social Security is going to have to eventually increase to around 16 percent to ensure solvency in the long-run. The 2013 Annual Report of the Social Security Board of Trustees states “the projected infinite horizon shortfall could be eliminated with an immediate increase in the combined payroll tax rate from 12.4 percent to about 16.6 percent” (p. 64).
Looking again at the findings in Echevarria and Iza (2006), they find that the number of people electing to retire and the Social Security tax rate are negatively correlated. Thus, as the tax rate increases to 16 percent, the average retirement age is going to increase because fewer people will be retiring (Echevarria and Iza, 2006). This predicts exactly what the statistics show from the Bureau of Labor Statistics and the Gallup Economy Survey, performed in May 2013, discussed in the previous section.
In the 2013 Annual Report of the Social Security Board of Trustees, they expect further slowing of the labor force growth rate due to “a substantial slowing of growth in the working age population in the future—a consequence of the baby-boom generation approaching retirement and succeeding lower-birthrate cohorts reaching working age” (p. 102). The Trustees project that “the labor force will increase by an average of 0.9 percent per year from 2012 to 2022 and 0.5 percent per year over the remainder of the 75-year projection period” (Social Security
Administration, 2013b, p. 102). This is a drop from a 1.0 percent growth rate from 2000-2007, and an even sharper drop from the labor growth rates of economic cycles prior to the year 2000.
Figure 4 shows the historical and projected data patterns for the dependency ratio from 1945 through 2090. This figure shows that dependency ratios for all dependents were declining until leveling off in the 1990s. With respect to those age 65 and older, the dependency ratio has been rising gradually since 1945, but now with baby boomers starting to retire, the rate of growth of the dependency ratio has increased sharply and is projected to continue this trend until around 2030 when it will level off and continue rising steadily all the way through 2090 (Social Security Administration, 2013b).
In 1983, legislation was passed that increased payroll taxes to further increase the balance of the trust fund for future retirees, as well as gradually increase the normal retirement age (DeWitt, 2010). This trust fund helps to decrease the effect the dependency ratio has on the solvency of Social Security (although this is experiencing major problems right now as well). Because of the creation of the trust fund, the dependency ratio doesn't play as important of a role, instead it is the “ratio of time people spend in paid employment over the course of their lifetimes” (Garr and Morrissey, 2009, p. 5). Labor force participation rates for people aged 60-64 have been climbing since the late 1980s. This statistic was at 55.2 percent in 2012, and is expected to
continue rising to 59.8 percent in 2022 (U.S. Bureau of Labor Statistics, 2013b). Mastrobuoni (2009) also shows that the average retirement age for the cohort (people born after 1938) subject to increasing normal retirement age legislation is rising by about 1 month every year, or 50 percent of the increase in normal retirement age set by the 1983 legislation. Thus, the dependency ratios rising values should at least be somewhat offset by the increasing average retirement age and increasing labor force participation from the 60-64-year-old age group. Due to this, the dependency ratios higher values are not as significant as otherwise thought.
2.5 Old Age and Survivors Trust Fund Issues
The current estimate by the 2013 Annual Report of the Social Security Board of Trustees has projected that the exhaustion date of the Social Security (including disability) Trust Fund to be 2033. These numbers have fluctuated each year being higher and lower than the current exhaustion estimate, but the trend over the last four years has been strictly downward (Social Security Administration, 2013b). At the date exhaustion happens, continuing taxes are expected to be enough to pay only 77 percent of scheduled benefits, eventually declining to 72 percent in 2087 (Social Security Administration, 2013b).
The only way to fix the trust fund is through policy adjustment. Smetters (2004) states that barring any “steep cuts in future benefits, creating a sustainable Social Security system will inevitably involve accumulating additional assets in the short term in order to finance benefits in the longer term–a process known as 'prefunding'” (p. 1). The current trust fund asset reserves as of the end of 2012 are $2.7 trillion (Social Security Administration, 2013b). During 2012, trust fund reserves increased by $54.4 billion because total income exceeded total expenditures. This maintained the surplus that the fund has been experiencing since the amendments passed in 1983,
but it is projected that in 2021, the cost will again begin to exceed total income, gradually eroding the fund until it's expected depletion date in 2033 (Social Security Administration, 2013a).
Comparing the 2013 Trustees Report to the 2012 Trustees Report, one improvement is that the percentage of benefits that will be covered at exhaustion of the trust fund increased from 76 percent to 77 percent. This means that even when the trust fund is completely depleted, there will still be enough revenue being generated by current Social Security taxes to pay 77 percent of benefits. This one positive can be at least partially attributed to the increasing average retirement age. The 2013 Trustees Report states that “changes in labor force participation rates increased the long-range actuarial balance by 0.01 percent of taxable payroll” (p. 74). This is a small number, but can make a large difference. This trend toward later retirement can have a positive effect on contribution amounts to the trust fund because the worker will be contributing more to the program by working a greater number of years.
The final year of the baby boom generation was 1964, thus in 2033, those people born in that final year will be turning age 69. This is eight years beyond the current average retirement age of 61. Although the vast majority of this generation will be retired at this time period, some people born later in the generation may have been retired for only a few years due to the average non-retired American expecting to retire at age 66 (Gallup Economy, 2013). The average
retirement age will only increase by year 2033 and this increase in retirement age should play a beneficial role in further extending the solvency of the trust fund, although not by enough to forgo policy intervention.
2.6 Disability Trust Fund Problems
According to the 2013 Trustees Report, at the end of 2012, there were 11 million disabled workers and dependents of disabled workers. The Disability Trust Fund is currently in a far more dire circumstance than the Old Age and Survivors (OASI) Trust Fund evaluated in the previous section. The current projection by the 2013 Trustees Report puts the trust fund depletion date at 2016. Currently, the fund is running a deficit at 85 percent of annual cost (Social Security Administration, 2013a). In 2016, after depletion, the continuing income to the Disability Trust Fund will be sufficient to pay only 80 percent of benefits (Social Security Administration, 2013a).
Federal disability insurance protects over 80 percent of all nonelderly adults from the risk of being unable to work due to a physical or mental disability (Autor and Duggan, 2006).
According to Autor and Duggan (2006), to be qualified for benefits, “an individual must have a medically determinable physical or mental impairment that is expected to result in death or to last for at least a year and that prevents the person from engaging in a 'substantial gainful activity'” (p. 1).
In 1984, there was a set of congressional reforms to disability insurance screening that led to a rapid growth in the percent of recipients suffering from back pain and mental illness. Due to this growth, the percent of individuals between the ages of 25 and 64 receiving disability benefits grew from 2.2 percent in 1985, to 4.1 percent in 2005 (Autor and Duggan, 2006). To make matters worse, because these disorders have low mortality rates and are difficult to show when an individual is cured, the average duration of disability benefits, and thus the recipient
population, have both increased. Data presented in Table 4 shows just how drastic the increases in both mental disorders and musculoskeletal disorders have been from 1983 to 2012. Probably
the single largest factor for the increase in mental disorders comes from the under-65 age group, with mental disorders comprising 59.7 percent of all disability awards for this demographic of recipients (Social Security Administration, 2013c).
Participation in the disability income program depends on an individual's decision to apply and an eligibility determination decision. Workers with low income levels have a greater incentive to apply for benefits, as there is a generous income replacement ratio for this category of workers. Thus, “there is an economic incentive for the disabled previously capable of work to stop working and for people who are not truly disabled but receive a high disutility from working to take advantage of the program” (Chen and van der Klaauw, 2008, p. 1). Data presented in Table 5 illustrates that the individuals with the lowest education levels (typically correlated with low income) have considerably higher disability rates than individuals with higher education.
Unemployment rates also seem to play a large role in the number of current disability claims. Since 1984 when the congressional reforms were passed, the number of disability applications for the non-elderly age group 18 to 64 has fluctuated with the unemployment rate very closely (See Figure 5). For the age group 18 to 64, when the unemployment rate rises (falls), disability applications also rise (fall).
Unlike the OASI Trust Fund which has specific age requirements as its qualifications, the Disability Trust Fund lends itself to subjectivity of a given states Disability Determination Services office and the system can be easily manipulated by claimants who do not have any true disabilities (Chen and van der Klaauw, 2008). When looking at state level data, it is clear to see that some of the poorest states in the nation have the highest disability rates (See Figure 6). Of the top five states with the highest rates of nonelderly disability recipients, four out of the five are in the bottom seven of the rankings for state per capita incomes. These states are West
Virginia (#47), Kentucky (#44), Mississippi (#50), and Arkansas (#45) (University of New Mexico, 2013).
Based on these high disability rates and low per capita income levels, one would expect each state to have relatively high unemployment rates, but that is not entirely the case. For these four states, only Kentucky (#40, 8.4%) and Mississippi (tied for #41, 8.7%) are in the bottom ten of unemployment rates (U.S. Bureau of Labor Statistics, 2013a). West Virginia is ranked number 15 with 6.3 percent, and Arkansas is ranked number 32 with 7.4 percent (U.S. Bureau of Labor Statistics, 2013a). One possible explanation for this is that these workers are no longer in the labor force and have elected to get themselves on disability income instead. As stated earlier in this section, because of the low levels of personal income in the state, workers have an economic incentive to fraudulently obtain disability income because the income replacement ratios are relatively high for them (Chen and van der Klaauw, 2008). Also, Black, Daniel and Sanders (2002) show evidence that disability applications rise sharply in the Appalachian coal mining regions when energy prices fall, thus resulting in layoffs and pushing workers towards disability.
Autor and Duggan (2006) state that “the rapid growth of Disability Insurance does not appear to be explained by a true rise in the incidence of disabling illness, but rather by policies that increased the subjectivity and permeability of the disability screening process” (p. 27). Due to this, there are only three ways to relieve these problems, by shortening the average length of time that claimants receive benefits by encouraging faster exit; tightening the screening process so that fewer insured workers may qualify; and reducing the incentives for qualified workers to seek benefits (Autor and Duggan, 2006). Although, only these last two options are potentially viable, as the first one was already tried by Congress with amendments to Social Security in 1980 that tightened eligibility criteria (Stapleton and Wittenburg, 2011). The result was public
backlash and the passing of the 1984 legislation which led to previously terminated disability beneficiaries being reinstated due to appeal (Autor and Duggan, 2006).
Tightening the screening process is a promising approach to resolve the problems experienced by the disability program. The Social Security Administration (SSA) has proposed two policy reforms to change the screening process. The first reform involves commissioning independent medical and vocational evaluation of disability claimants during their initial determination (Autor and Duggan, 2006). By doing this, it “would provide a healthy
counterbalance to the current requirement that Disability Determination Services examiners give highest weight to source evidence submitted by claimants and their selected medical
representatives” (Autor and Duggan, 2006, p. 29). Thus, the determination would be less likely to be skewed toward the benefit of the claimant. The second reform proposed by the SSA is to have attorney representation at Administrative Law Judge hearings on the side of the SSA (Autor and Duggan, 2006). Currently, claimants are typically represented at appeal by attorneys or medical advocates who will benefit financially from a claimant receiving benefits (Autor and Duggan, 2006). This makes the case very one-sided in favor of the claimant. The
Administrative Law Judge must base their decision on the evidence from only one side, the claimant. The Judge’s job is to protect both the interests of the claimant and that of the public. Without legal representation on the side of the SSA, nearly three-quarters of all appeals are in favor of the claimant (Autor and Duggan, 2006).
The final option for reducing the problems associated with the disability program is to reduce the incentives for qualified workers to seek benefits. Three major plans have been proposed in response to this. The first plan by Burkhauser and Daly (2011) uses experience rating to charge higher Social Security Disability (SSDI) payroll taxes to employers whose
workers make more frequent claims. Currently, employers “face no marginal incentive to minimize SSDI claims since their payroll taxes are independent of the claims” (Autor, 2011, p. 14). Thus, by using experience rating, these employers will recognize the cost of their
employees’ SSDI claims and hopefully implement incentives for their workers to remain on the job rather than apply for SSDI benefits (Burkhauser and Daly, 2011).
The benefits of this proposal is that it is very simple and will require little change to how employers currently report income tax data to the government (Autor, 2011). Also, this proposal “would motivate employers to retain workers with disabilities, ensure that they have rapid access to services, expand the purchase of personal disability insurance (PDI) coverage, and encourage workers to remain healthy” (Stapleton and Wittenburg, 2011, p. 4). In contradiction, there are two major problems as to how effective the proposal will be to help deter employees from applying for SSDI. First, this type of plan could potentially allow disgruntled employees, who have been laid off or fired, to hurt the employer by applying for SSDI with bogus disability symptoms (Autor, 2011). And secondly, depending on the extent of experience rating, if
employers would be required to pay the full present value of a typical SSDI award (~$270,000 in 2011), it would dramatically affect their hiring behavior and the extent of employee benefits provided (Autor, 2011). Specifically, employees with poor medical histories may be less likely to become employed, even though this would directly violate the Americans with Disabilities Act.
The second plan to reduce the incentive for workers to apply for SSDI is called universal short-term private disability insurance (UPDI) and has been proposed by Autor and Duggan (2010). UPDI would require both employers and employees to jointly purchase private disability insurance (PDI) (Autor, 2011). If a worker experiences a disabling condition, they would be required to receive 24 months of benefits from PDI before being able to apply for SSDI
(Stapleton and Wittenburg, 2011). Similar to workman’s compensation insurance and PDI, UPDI would emphasize that employers provide services to employees by providing
accommodations and return-to-work services (Stapleton and Wittenburg, 2011). UPDI is funded by experience-rated tax payments and employers would be required to pay up to two years of benefits, even for workers who leave their jobs (Stapleton and Wittenburg, 2011). Thus, employers have a financial incentive to do as much as they can to retain minimally disabled workers. Also, “individuals with extremely disabling conditions (e.g. stroke, late stages of certain cancers, etc.), with very limited prospects of returning to the workforce, could be permitted to apply immediately to SSDI” (Autor and Duggan, 2010, p. 18).
The third and final option to reduce the incentive of employees to apply for SSDI is to create a new social insurance program called Earnings Support Insurance (ESI) (MacDonald and O’Neil, 2006). Autor (2011) describes the primary components of the plan very well:
“One component of ESI would provide partial wage replacement for workers with disabilities who remain in employment or who find new jobs after the onset of disability. A second component would provide a dollar-for-dollar tax credit for employers to pay for the cost of reasonable accommodations. A third component would expand existing tax provisions to help offset the costs of disability-related health care expenditures for both employers and individuals.” (p. 21)
The ESI program would provide financial assistance, health, and employment services. It allows workers a variety of options to use to try and remain at work, such as applying for ESI itself or applying for a combination of ESI and SSDI (Stapleton and Wittenburg, 2011). The primary downfalls of the ESI plan is that it is more of a statement of principles and not a detailed policy, as well as it does not place much burden on the employer to incentivize them to do
everything they can to accommodate disabled workers’ needs to remain employed (Autor, 2011). There are a few benefits to ESI though, including that the program does provide workers with the means and benefits necessary to stay gainfully employed by offering health insurance and wage
replacement (Autor, 2011). Also, because ESI would pay for accommodation costs for the disabled, employers will not be burdened with those costs and will be less likely to terminate employees with disabilities because the costs to employ them will not rise as drastically as they may otherwise (Autor, 2011).
Maestas, Mullen, and Strand (2013) found that approximately 18 percent of SSDI beneficiaries would be earning more than the maximum allowed by the program if they had not received the SSDI benefits. During the 1980s and 1990s, The Netherlands made significant changes and improvements in their disability system and have made great strides to position the program for a sustainable financial future through more stringent eligibility standards and better work-support policies (Stapleton and Wittenburg, 2011). Under The Netherlands new policies, “employers must provide short-term disability benefits, and employer taxes are experience rated” (Stapleton and Wittenburg, 2011, p. 4).
During the period from 1985 to 1995, Dutch disability expenditures as a share of GDP fell from its peak of 4.2 percent to 2.6 percent, respectively (Autor, 2011). But during that same period, the percentage of the labor force enrolled in disability fell by only one percent to ten percent (Autor, 2011). As a result, the Dutch implemented new policies fully implementing experience-rated disability insurance premiums and a new policy where every disability enrollee must put together an eight week return-to-work plan in consultation with their employer and physician (Autor, 2011). These two new policies resulted in the number of disabled as a share of the Dutch labor force falling from slightly more than 10 percent in 2002 to 8.4 percent in 2007 (Autor, 2011). The policies implemented by The Netherlands have several similar features to these last three proposals that were just discussed. SSDI is the most urgent problem America has
with respect to the social safety net programs, and something must be done soon to turn the trajectory around.
2.7 Lack of Political Pressure for Reform
Based on the problems facing the Social Security system, one would expect for parents and grandparents to be thinking about their families and the debt burdens which they are placing on their children and grandchildren. Contrary to this thought, this altruistic mindset does not appear to be the norm. Currently, there is little political pressure to make changes to the system to reverse the systematic intergenerational transfer that is happening as a result of the weakening of the Social Security system (Grafstein, 2009). Grafstein (2009) suggests that support of
“intergenerational transfer beyond what underlying economic growth would justify is due to each generation’s perception that its descendants will find the intergenerational insurance less
valuable” (p. 713). Thus, his model shows that if an individual has a greater belief that their children will have greater upward mobility within social classes, they are less likely to think altruistically about their children’s future needs of Social Security and less likely to pressure politicians for reform of the program (Grafstein, 2009).
This problem presented by Grafstein (2009) is further reinforced by Smetters (2004), who shows that politicians become more comfortable with declining surpluses, but at a rate that is decreasing in magnitude over time. Thus, it makes sense that our politicians continue to remain inactive with respect to Social Security reform. They do not have the incentive to make any changes in the near future because there is no political pressure to do so, and they have become accustomed to the fact that the program is not indefinitely solvent, but also not yet at the brink of insolvency (Grafstein, 2009; Smetters, 2004) With the 2013 Trustees projection for exhaustion
of the trust fund to be in 2035 (2033 if funds are drawn from the OASI into the SSDI Trust Fund), that leaves politicians with an ample amount of time to maintain the status quo and not press for Social Security reform (Social Security Administration, 2013b).
Social Security is a very divisive issue, especially when it comes to any reform proposals which would cut benefits or raise Social Security taxes, thus the results Smetters (2004) has found make perfect sense. It is most likely that the Social Security program will remain unchanged until it comes near to Trust Fund exhaustion, with politicians scrambling to find a funding solution at the last minute (Arnold, 1998).
Gonzalez-Eiras and Niepelt (2008) show that demographic changes alter the relative weight that the political process attaches to the interests of old and young voters. Their model predicts a slowdown in population growth being associated with an increase in Social Security tax rates, a rising share of pensions in GDP, and lower social security benefits for retirees in the future (Gonzalez-Eiras and Niepelt, 2008). This is because younger voters oppose Social Security less emphatically than the elderly support it. As a result of these factors, they predict that at some point after 2050 the payroll tax rate for Social Security will reach 16 percent (Gonzalez-Eiras and Niepelt, 2008). This is in line with projections made by Diamond and Orszag (2005a) and the 2013 Trustees Report which shows that the infinite horizon shortfall could be immediately eliminated if the tax rate were increased to 16.6 percent. Both these models (Gonzalez-Eiras and Niepelt, 2008; Grafstein, 2009) show that without the political pressure to make the necessary changes, the program will continue its current path until it reaches a breaking point where reform is absolutely necessary, or else future retirees do not receive all of their promised benefits.
benefit structure is politically sustainable as a pay-as-you-go system since U.S. voters of median age or higher (age 48-52 at peak of baby-boom retirement) will support necessary tax increases, because in the model voters view previous contributions as sunk costs. As a result, as long as middle-aged voters believe that for a few more years of contributions, they will earn retirement and medical benefits that exceed the present value of contributions; they will continue to support Social Security (Bohn, 2003). This could change though, if the 45 and over age group began to believe the system is going to be insolvent when it comes time for them to collect benefits (Bohn, 2003). This further reinforces the findings of Gonzalez-Eiras and Niepelt (2008) that the elderly are the voters who are much more involved and place more pressure on politicians regarding the structure of Social Security. At this point, it would likely be only a few years until trust fund exhaustion, and the political pressure from the elderly’s fear of reduced benefits would force politicians to finally take action.
Each model referenced in this section has empirically shown that there is not enough political pressure to force politicians to make the changes necessary to bring back long-term solvency to Social Security. Without this pressure, we will not see any changes made until the very last minute. In the 2013 Trustees Report, the Trustees “recommend that lawmakers address the projected trust fund shortfalls in a timely way in order to phase in necessary changes and give workers and beneficiaries time to adjust to them. Implementing changes soon would allow more generations to share in the needed revenue increases or reductions in scheduled benefits” (Social Security Administration, 2013b, p. 5). This recommendation from the Trustees should be
listened to very carefully by Congress. Any time they implement drastic changes, there is generally always negative economic repercussions. By not waiting until the last minute to fix Social Security and Medicare, they can allow workers to adjust their consumption and savings
patterns to prepare for the future, as well as allow the burdens of the program to be spread over a greater number of workers and generations.
2.8 Recessions and Declines in Taxable Earnings
One factor that has negatively affected the Social Security trust funds is recessions. This is primarily due to a lower number of employed workers which results in a lower amount in taxable earnings. Looking at Figure 7, during each recession that the United States has experienced since 1980, there has been a corresponding drop in the Social Security surplus, which causes a drop in the trust fund (Ruffing, 2010). Any time that the surplus declines, Social Security needs to draw reserves out of the trust fund to supplement the amount of payroll tax revenue they are generating. This happens because Social Security benefits being paid are exceeding the amount of revenue being generated. If the trust fund is not drawn on in this scenario, beneficiaries will not receive their full benefits.
The most recent recession starting in 2008 has been the most devastating, resulting in a steep drop in the Social Security surplus from $137 billion in 2009 to $83 billion in 2010 (Ruffing, 2010). This is primarily due to a drop in taxable earnings caused by a decrease in average hours worked (Rosnick, 2012). The Trustees used an intermediate assumption in the 2012 Trustees Report that average work hours would remain unchanged, but revised their assumptions in 2013 to a decline of 0.05 percent per year over the 75-year projection period (Rosnick, 2012). Although this assumption is not likely to remain as the economy continues to recover, it shows how the drop in employment levels have affected the long-term solvency of the trust fund and Social Security’s surpluses.
The 2007 Trustees Report (pre-recession) projected there would be 169 million workers
employed in 2011 earning $6.5 trillion, but the real numbers were much lower (Rosnick, 2012). Actual statistics for 2011 show that there were only 157.7 million employed workers earning just $5.5 trillion (Rosnick, 2012). Fortunately, since 1980, the Social Security trust funds have been using the surpluses each year to purchase Treasury bonds, which had a value of over $2.7 trillion at the end of fiscal 2009 and earn an average annual interest rate of 4.7 percent (Ruffing, 2010). The interest earned in 2012 alone, was over $109 billion, but that is down substantially from the levels of the previous five years (Social Security Administration, 2012).
The only two programs with a bleaker outlook than the OASI Trust Fund are the Disability Trust Fund and the Medicare Trust Fund. Great detail was spent on the Disability Trust Fund back in Section 2.6, so I will give a brief overview of the outlook for only the Medicare Trust Fund here. The Medicare Trust Fund has been in deficit since 2008, and has been hit negatively by the recession (Rosnick, 2012). The program was projected to have small surpluses through 2010, although these surpluses actually ended in 2008 (Rosnick, 2012). In 2011, the shortfall became $28 billion, due to an inefficient health system and skyrocketing healthcare costs (Rosnick, 2012). The current projected depletion date for the Medicare Trust Fund is 2026, two years later than projected in the 2012 Trustees Reports (Social Security Administration, 2013b).
One positive, relatively speaking, compared to the OASDI (OASI and SSDI combined) Trust Fund is that the long-term actuarial imbalance for the Medicare Trust Fund is 1.11 percent of taxable payroll, down from 1.35 percent in the 2012 Report (Social Security Administration, 2013a). This is less than half the actuarial imbalance for the OASDI Trust Fund, which is estimated at 2.72 percent of taxable payroll (Social Security Administration, 2013a). In “A
Summary of the 2013 Annual Reports,” the Trustees explain the reasons for the favorable outlook for the HI Trust Fund to be due to: “(i) lower projected spending for most HI service categories, especially for skilled nursing facilities, to reflect lower-than-expected spending in 2012 and other recent data; (ii) lower projected Medicare Advantage program costs that reflect recent data suggesting that certain provisions of the Affordable Care Act will reduce growth in these costs by more than was previously projected; and (iii) a refinement in projection methods that reduces assumed per beneficiary cost growth during the transition period between the short-range projections and the long-short-range projections.” Although, they also go on to explain these favorable changes are partially offset by the lower projected levels of tax income that reflect lower-than-expected tax income in 2012 (Social Security Administration, 2013b).
Chapter 3: Evaluation of Proposed Plans to Fix Social Security
3.1 The Diamond-Orszag Plan
The Diamond-Orszag Plan focuses on three primary factors which contribute to Social Security’s actuarial imbalance. These factors are: improvements in life expectancy, increases in earnings inequality, and the burden of the legacy debt (Diamond and Orszag, 2005b). An American Institute of Certified Public Accountants (AICPA) (2005) report states that the “plan would finance approximately two-thirds of the current Social Security unfunded liability through payroll tax increases and the remaining one-third through benefit reductions targeted at higher-income workers” (p. 83). In this plan, Diamond and Orszag note that the actuarial deficit for Social Security over the next seventy-five years is “0.7 percent of Gross Domestic Product (GDP); projected out forever, the deficit is 1.2 percent of GDP” (Diamond and Orszag, 2005b, p. 1). According to their estimates, taxable payroll is roughly 40 percent of GDP, meaning the deficit in terms of taxable payroll is approximately 2.5 times that of the percent of GDP, which equates out to three percent (Diamond and Orszag, 2005b; U.S. Bureau of Economic Analysis, 2013).
The first proposed fix addressing increasing life expectancy calls for a balanced combination of benefit reductions and tax increases (Diamond and Orszag, 2005b). They
propose that in each year the Office of the Chief Actuary calculate the net cost to Social Security from the current improvement in life expectancy. “Half of this cost would be offset by a
reduction in benefits, which would apply to all workers age 59 and younger. The other half would be financed by an increase in the payroll tax rate” (Diamond and Orszag, 2005b, p. 2). These benefit reductions will be implemented in a progressive manner where higher-wage
workers see the largest reductions (Lemieux, 2003).
Regarding tax increases, the plan will gradually increase payroll tax rates from 12.4 percent up to 15.4 percent in 2078 (John, 2004). This will bring solvency to the program through the seventy-five year projection period, but if tax increases stop after the seventy-five year period, the trust fund reserves will again begin declining (Gokhale and Smetters, 2005). Thus, indefinite tax increases after the seventy-five year projection period will be required (Gokhale and Smetters, 2005). Raising the payroll tax rate minimizes the need to cut benefits, but the higher tax rate will also reduce the return beneficiaries receive on their taxes (Urban Institute, 2013a). This could potentially incentivize workers into early retirement if they do not see any added benefit from paying in more than they currently have (Urban Institute, 2013a). Through implementation of this aspect of the proposal, the seventy-five year actuarial deficit would be reduced by 0.55 percent of taxable payroll (Diamond and Orszag, 2005b).
The second fix is with regards to earnings inequality and a widening gap in life expectancy between the rich and the poor (Diamond and Orszag, 2005a). Since 1983, the percentage of taxable earnings below the earnings cap has decreased from 90 percent to 83 percent today (Garr and Morrissey, 2009; Urban Institute, 2013b). The taxable maximum in 2013 was $113,700 (Social Security Administration, 2014b). Diamond and Orszag (2005b) propose gradually raising this taxable maximum so that 87 percent of taxable payroll is below the maximum by 2063. This is approximately halfway to its 1983 level of 90 percent (Garr and Morrissey, 2009; Urban Institute, 2013b). Mulvey (2010) supports this argument by stating that in 2005, if the maximum taxable earnings were raised from $90,000 to $150,000, which was 90 percent of taxable earnings at the time, it would have eliminated 43 percent of the projected shortfall. This statistic is clearly in line with Diamond and Orszag’s results of eliminating 0.43
percent of the taxable payroll deficit by employing less than half that amount of increase in taxable maximum (Diamond and Orszag, 2005b). This is because 0.43 percent of the taxable payroll deficit as projected by the Trustees in 2005 was approximately 22 percent of the total projected shortfall. Thus, when doubling this amount, it equals a reduction in the taxable payroll deficit of 44 percent, which is nearly the same percent Mulvey (2010) shows when the taxable maximum is raised to the 90 percent earnings level.
The Diamond-Orszag Plan will also gradually reduce “the highest tier of the benefit formula, affecting the 15 percent of workers with the highest lifetime earnings” (Diamond and Orszag, 2005b, p. 3). By reducing the highest tier of the benefit formula, they are increasing the progressiveness of the system since wealthier people tend to live longer, thus receiving more benefit payments and placing a greater strain on the system (Diamond and Orszag, 2005b). It is projected that raising the taxable maximum to 90 percent, while not increasing benefits for those above the current maximum, would eliminate 1.74 percent of taxable payroll (Urban Institute, 2013b). This is over half of the current funding shortfall the Diamond-Orszag Plan is proposing to eliminate (Diamond and Orszag, 2005b)
The final aspects of the proposed plan involve funding the legacy debt. The legacy debt is essentially that “benefits paid to almost all current and past cohorts of beneficiaries exceeded what could have been financed with the revenue they contributed” (Diamond and Orszag, 2005b, p. 3). The first aspect of the financing of the legacy debt mandates Social Security coverage for all newly hired state and local government workers, eventually leading to all workers bearing their fair share of the cost of the nation’s generosity (John, 2004; Diamond and Orszag, 2005b). The second aspect creates a legacy tax on earnings above the maximum taxable earnings base, causing the extremely wealthy to contribute to financing the legacy debt in proportion to their