University of Arkansas, Fayetteville
ScholarWorks@UARK
Theses and Dissertations5-2019
Diffuse Reflectance Spectroscopy to Quantify In
Vivo Tissue Optical Properties: Applications in
Human Epithelium and Subcutaneous Murine
Colon Cancer
Gage Joseph Greening
University of Arkansas, Fayetteville
Follow this and additional works at:https://scholarworks.uark.edu/etd
Part of theBioimaging and Biomedical Optics Commons,Biomedical Devices and
Instrumentation Commons,Cancer Biology Commons, and theMolecular, Cellular, and Tissue Engineering Commons
This Dissertation is brought to you for free and open access by ScholarWorks@UARK. It has been accepted for inclusion in Theses and Dissertations by an authorized administrator of ScholarWorks@UARK. For more information, please [email protected].
Recommended Citation
Greening, Gage Joseph, "Diffuse Reflectance Spectroscopy to Quantify In Vivo Tissue Optical Properties: Applications in Human Epithelium and Subcutaneous Murine Colon Cancer" (2019).Theses and Dissertations. 3251.
Diffuse Reflectance Spectroscopy to Quantify In Vivo Tissue Optical Properties: Applications in Human Epithelium and Subcutaneous Murine Colon Cancer
A dissertation submitted in partial fulfillment of the requirements for the degree of
Doctor of Philosophy in Engineering with a concentration in Biomedical Engineering
by
Gage Joseph Greening University of Arkansas
Bachelor of Science in Biomedical Engineering, 2014
May 2019 University of Arkansas
This dissertation is approved for recommendation to the Graduate Council.
___________________________ Timothy J. Muldoon, M.D., Ph.D. Dissertation Director
___________________________ ___________________________ Narasimhan Rajaram, Ph.D. Yong Wang, Ph.D.
Committee Member Committee Member
___________________________ Kyle P. Quinn, Ph.D.
Abstract
Colorectal cancer is the 4th most common and 2nd deadliest cancer. Problems exist with predicting which patients will respond best to certain therapy regimens. Diffuse reflectance spectroscopy has been suggested as a candidate to optically monitor a patient’s early response to therapy and has been received favorably in experimentally managing other cancers such as breast and skin. In this dissertation, two diffuse reflectance spectroscopy probes were designed: one with a combined high-resolution microendoscopy modality, and one that was optimized for acquiring data from subcutaneous murine tumors. For both probes, percent errors for estimating tissue optical properties (reduced scattering coefficient and absorption coefficient) were less than 5% and 10%, respectively. Then, studies on tissue-simulating phantoms were performed to test probe sensitivity and to serve as testing platforms for investigators in biomedical optics. Next, the diffuse reflectance spectroscopy probe was applied to subcutaneous murine colon tumors (n=61) undergoing either antibody immunotherapy or standard 5-fluorouracil chemotherapy. Mice treated with a combination of these therapies showed reduced tumor growth compared to saline control, isotype control, immunotherapy, and chemotherapy groups (p<0.001, <0.001, <0.001, and 0.046, respectively) 7 days post-treatment. Additionally, at 7 days post-treatment, oxyhemoglobin, a marker currently being explored as a functional prognostic cancer marker, trended to increase in immunotherapy, chemotherapy, and combination therapy groups compared to controls (p=0.315, 0.149, and 0.190). Also of interest, an oxyhemoglobin flare (average
increase of 1.44x from baseline, p=0.03 compared to controls) was shown in tumors treated with chemotherapy, indicating that diffuse reflectance spectroscopy may be useful as a complimentary tool to monitor early tumor therapeutic response in colon cancer. However, subject-to-subject variability was high and studies correlating survival to early oxyhemoglobin flares are suggested.
Dedication
Acknowledgements
There are many people I would like to thank. I am especially indebted to Dr. Timothy Muldoon, who trusted me to make appropriate research decisions and design my own methodology, and, most importantly, gave me constant encouragement in times of uncertainty. I am also indebted to my wonderful committee members, Dr. Narasimhan Rajaram, Dr. Kyle Quinn, and Dr. Yong Wang, who taught me a great deal about scientific research, and worked to provide me time and resources to pursue my research goals. Additionally, I’d like to thank Mr. Keith Tucker and Dr. Matthew Leftwich, who hired me for internships and have been excellent career mentors.
Financially, this work would not have been possible without the support of the National Science Foundation Graduate Research Fellowship Program and the University of Arkansas Doctoral Academy Fellowship.
I would like to thank my fellow colleagues, past and present, Sandra Gordon, Amy Powless, Haley James, Josh Hutcheson, Ariel Mundo, and Shelby Bess for their willingness to review manuscripts, constructively critique my research, discuss science, and talk about life. A most sincere thank you for your friendship and all you’ve done for me.
I would like to thank my parents, Greg and Stacie, whose guidance has always been strong in whatever I chose to pursue. My sister, Haleigh, has been my greatest role model as to what a good person should be. My best friend, Logan, was always open to intellectual discussions and provided constant support. Most importantly, I wish to thank my wife, Codi, who provided unwavering love, inspiration, and encouragement, even in the most challenging of times, and who always knows how to make me laugh and smile. I love you all. Without you, I would not have been able to complete this endeavor.
Table of Contents
1. Chapter 1: Introduction ...1
a. References ...39
2. Chapter 2: Specific Aim 1 – Design and characterization of broadband diffuse reflectance spectroscopy probes for in vivo tissue analysis...55
a. References ...114
3. Chapter 3: Specific Aim 2 – Characterization of poly(dimethylsiloxane)-based tissue-simulating phantoms with tunable reduced scattering and absorption coefficients with applications for diffuse reflectance spectroscopy ...123
a. References ...198
4. Chapter 4: Specific Aim 3 – Sampling depth of a diffuse reflectance spectroscopy probe for in vivo physiologic quantification of murine subcutaneous tumor allografts ...209
a. References ...240
5. Chapter 5: Specific Aim 3 – Effects of isoflurane anesthesia on physiological parameters in murine tumor allografts measured via diffuse reflectance spectroscopy ...245
a. References ...268
6. Chapter 6: Specific Aim 3 – Quantification of subcutaneous murine colon carcinoma tumors in response to chemotherapy and macrophage-targeted immunotherapy measured using diffuse reflectance spectroscopy ...274
a. References ...372
7. Chapter 7: Conclusion ...389
a. References ...396
List of Published Work
Published Manuscripts
Greening GJ, Bess SN, Muldoon TJ. “Immunohistochemistry staining for tumor-associated
macrophage polarization in murine subcutaneous colon tumor allografts,” Bio-101, 3106, (2018).
[Dissertation Chapter 6]
Greening GJ, Mundo AI, Rajaram N, Muldoon TJ. “Sampling depth of a diffuse reflectance
spectroscopy probe for in vivo physiologic quantification of murine subcutaneous tumor allografts,” Journal of Biomedical Optics, 23(8), (2018).
[Dissertation Chapter 4]
Tabassum S, Pera V, Greening GJ, Muldoon TJ, Roblyer D. “Two-layer inverse model for
improved longitudinal preclinical tumor imaging in the spatial frequency domain,” Journal of
Biomedical Optics, 23(7), (2018).
[Dissertation Chapter 3]
Greening GJ, Miller KP, Spainhour CR, Cato MD, Muldoon TJ. “Effects of isoflurane anesthesia on physiological parameters in murine subcutaneous tumor allografts measured via diffuse reflectance spectroscopy,” Biomedical Optics Express, 9(6), (2018).
[Dissertation Chapter 5]
Greening GJ, Rajaram N, Muldoon TJ. “Multimodal imaging and spectroscopy fiber-bundle
microendoscopy platform for non-invasive in vivo tissue analysis,” Journal of Visualized
Experiments, 116, (2016).
[Dissertation Chapter 2]
Greening GJ,James HM, Dierks MK, Vongkittiargorn N, Osterholm SM, Rajaram N, Muldoon
TJ. “Towards monitoring dysplastic progression in the oral cavity using a hybrid fiber-bundle imaging and spectroscopy probe,” Scientific Reports, 6(26734), (2016).
[Dissertation Chapter 2]
Greening GJ, Powless AJ, Hutcheson JA, James HM, Dierks MK, Rajaram N, Muldoon TJ,
“Fiber-bundle microendoscopy with sub-diffuse reflectance spectroscopy and intensity mapping for multimodal optical biopsy of stratified epithelium,” Biomedical Optics Express, 6(12), (2015).
[Dissertation Chapter 2]
Greening GJ, Istfan R, Higgins LM, Balachandran K, Roblyer D, Pierce MC, Muldoon TJ,
“Characterization of thin poly (dimethylsiloxane)-based tissue simulating phantoms with tunable reduced scattering and absorption coefficients at visible and near infrared wavelength,” Journal
of Biomedical Optics, 19(11), (2014).
Published Books
Greening GJ, James HM, Muldoon TJ. “Optical Phantoms: Diffuse and sub-diffuse imaging
and spectroscopy validation,” SPIE Spotlights, (2015).
[Dissertation Chapter 3]
Conference Proceedings
Greening GJ,Rajaram N, Muldoon TJ. “In vivo measurement of non-keratinized squamous
epithelium using a spectroscopic microendoscope with multiple source-detector separations,”
Proceedings of SPIE, 9715, (2016).
Greening GJ, Powless AJ, Hutcheson JA, Prieto SP, Majid AA, Muldoon TJ, “Design and
validation of a diffuse reflectance and spectroscopic microendoscope with poly (dimethylsioxane)-based phantoms,” Proceedings of SPIE, 9332, (2015).
Conference Presentations
Greening GJ, Rajaram N, Muldoon TJ, (May 2018). “Sampling depth of a diffuse reflectance
spectroscopy probe in murine subcutaneous tumor allografts,” Poster presentation at the SPIE Translational Biophotonics Conference, Houston, TX.
Greening GJ, Gordon SP, James HM, Muldoon TJ, (Jan 2018). “Monitoring therapeutic
response of murine tumor allografts of colon carcinoma in response to combined immunotherapy and chemotherapy,” Oral presentation at the SPIE Photonics West BiOS Conference, San Francisco, CA.
Greening GJ, Rajaram N, Muldoon TJ, (May 2016). “A hybrid imaging and spectroscopy probe
for monitoring dysplasia,” Poster presentation at the SPIE Translational Biophotonics Conference, Houston, TX.
Greening GJ,Rajaram N, Muldoon TJ, (Feb 2016). “In vivo measurement of non-keratinized squamous epithelium using a spectroscopic microendoscope with multiple source-detector separations,” Oral presentation at the SPIE Photonics West BiOS Conference, San Francisco, CA.
Greening GJ, Powless AJ, Hutcheson JA, Prieto SP, Majid AA, Muldoon TJ, (Feb 2015).
“Design and validation of a diffuse reflectance and spectroscopic microendoscope with poly (dimethylsioxane)-based phantoms,” Oral presentation at the SPIE Photonics West BiOS Conference, San Francisco, CA.
Greening GJ, BalachandranK, Muldoon TJ, (Apr 2014). “Thin-film
polydimethylsiloxane-based optical phantoms for epithelial tissue simulation,” Poster presentation at the OSA Biomedical Optics Conference, Miami, FL.
1
Chapter 1: Introduction
1. Background
The overall health focus of this dissertation is colorectal cancer (CRC). Murine
subcutaneous allografts were used as a model for CRC. No clinical human work was performed in CRC. Mice with subcutaneous CRC were treated with chemotherapy and immunotherapy, and the tumor therapeutic response was measured using a non-invasive optical technique, diffuse reflectance spectroscopy (DRS).
Figure 1 shows the general dissertation workflow. Before DRS was implemented in the scientific investigation of therapy response in murine subcutaneous CRC allografts, an
engineering approach was taken to design a DRS probe, design tissue-simulating phantoms with tunable optical properties, and perform calibration and validation of DRS hardware to ensure robust results.
2
Figure 1. DRS was used as a non-invasive optical tool to monitor tumor therapeutic response to chemotherapy and immunotherapy in a subcutaneous mouse model of CRC. Aims 1 and 2 primarily focus on engineering design and testing of a DRS probe and the calibration and validation of DRS hardware using tissue-simulating phantoms. Aim 3 primarily focuses scientific results from treating murine subcutaneous CRC allografts with chemotherapy and
immunotherapy. Photo of DRS probe and mouse taken by author. Image of colon and colon cancer sourced from the Smart Servier Medical Art, which are free to
share, copy, and redistribute under Create Commons License CC BY 3.0. Image
of antibodies sourced from the Library of Science Medical Figures by
somersault1824, which are free to share, copy, and redistribute under Create
Commons License CC BY-NC-SA 4.0.
Therefore, this introduction opens with a discussion on the overall clinical health problem: CRC. This discussion introduces basic CRC epidemiological statistics, the biology of tumorigenesis, hypoxia, and angiogenesis, the current diagnostic and treatment standards for CRC, the emerging role of immunotherapy in CRC, and the current
methods to assess CRC tumor response to therapy, and how DRS can offer additional clinically relevant information to better assess CRC tumor response to therapy. The
3
introduction next turns to describing DRS in detail, including the exact DRS platforms used for various studies in this dissertation. We discuss the optical physics of DRS, and how information gathered from light that has scattered and absorbed in body tissues relates to both structural and functional biological characteristics. Finally, the introduction closes with a brief summary of all three specific aims. Chapters 2 and 3 represent specific aims 1 and 2, respectively. Aim 3, on the other hand, is longer, and consists of chapters 4, 5, and 6.
1.1Clinical health focus: colorectal cancer
In the United States, CRC is the 4th most common cancer with 140,000 new cases and 50,000 deaths in the United States annually. CRC has the 7th worst 5-year survival rate (~65%) of all cancers (Siegel et al., 2018). CRC makes up 8.1% of all cancers cases and 8.3% of all cancer-related death (Siegel et al., 2018). It has been estimated that individuals have a 2% and 0.9% cumulative lifetime risk of developing and dying from CRC, respectively (Stigliano et al., 2014), and the disease is more prevalent in
males (54% of cases) compared to females (46% of cases) (Siegel et al., 2018). Although the incidence of CRC in the U.S. has been decreasing over the past several decades, there are still nearly 1.25 million U.S. residents (~0.4% of the population) living with CRC (Marley et al., 2016), costing the U.S. $14 billion annually (Yabroff et al., 2007; Yabroff
et al., 2011). Furthermore, per person costs
Summary of acronyms
5-FU 5-fluorouracil
CCL2 Monocyte chemoattractant protein-1
CSF2 Colony-stimulating factor 2
DRS Diffuse reflectance spectroscopy
Hb Hemoglobin
LACC Locally advanced colorectal cancer
LCC Left-sided colorectal cancer
pCR Pathological complete response
RCC Right-sided colorectal cancer
RTE Radiative transport equation
StO2 Tissue oxygen saturation
SDS Source-detector separation
TAM Tumor-associated macrophage
THC Total hemoglobin concentration
TME Tumor microenvironment
TNM Tumor, node, and metastasis
μa Absorption coefficient
4
associated with CRC treatment are $30 thousand within a year of diagnosis (Luo et al., 2009). In developing countries, on the other hand, CRC incidence is expected to increase over the next decade as population and life expectancy increase (Stigliano et al., 2014). Although there has been a steady reduction in CRC incidence and mortality since the 1970’s, primarily attributed to reduction in preventable risk factors, advances in early detection, and nationwide screening initiatives (Siegel et al., 2018; Levin, 2016), research into monitoring tumor therapeutic response to better personalize patient treatment is still needed and an active area of research in the field of CRC (Park et al., 2014).
CRC (Figure 2) is classified in multiple ways. CRCs can either be sporadic (70-85% of cases) (Yamagishi et al., 2016; Mundade et al., 2014) or familial (15-30% of cases) (Stigliano et al., 2014; Jasperson et al., 2010). Sporadic cases arise as a result of multiple rare variants, which are genetic variants occurring in < 1% of the population. Familial cases arise when individuals have a genetic disposition or family history of CRC, although family history is often unreported which contributes to the large percent range of cases (Stigliano et al., 2014). Treatment of sporadic vs. familial CRC currently does not differ significantly as chemotherapy and surgical resection remain the curative standard, although patients with certain subtypes of familial CRC may be screened and treated earlier (Esplin et al., 2014). Alternatively, CRC can be classified on where the disease occurs. CRC can arise in the rectum (31% of cases), left colon (30% of cases), or right colon (39% of cases) (Mik et al., 2017; Siegel et al., 2018). The left and right colon have different embryological origins (hindgut vs. midgut, respectively) (Baek, 2017) and many
believe that left-sided (LCC) and right-sided CRC (RCC) should be considered separate diseases because they have different characteristics and oncological outcomes (Lim et al., 2017; Qin et al., 2017; Hussain et al., 2016). Although LCC and RCC are currently treated identically, these
5
diseases may be screened and treated differently in the future (Mik et al., 2017). Next, CRC can be histologically classified into adenocarcinomas (>90% of cases) or other types (<10% of cases), such as neuroendocrine, squamous cell, adenosquamous, spindle cell, and
undifferentiated carcinoma (Fleming et al., 2012). Finally, a recent 2015 collaborative gene expression-based subtyping initiative has classified CRC into four distinct subtypes: CMS1 (14%), CMS2 (37%), CMS3 (13%), CMS4 (23%), as well as 13% of cases with mixed features. It is anticipated that the CMS subtype classification will have the biggest impact on future targeted therapies (Guinney et al., 2015).
Figure 2. The primary health focus of this dissertation is CRC. Images sourced from the Smart Servier Medical Art, which are free to share, copy, and
redistribute under Create Commons License CC BY 3.0.
1.1.1 Hypoxia in colorectal cancer
Hypoxia is a condition of insufficient tissue oxygen saturation and arises due to
uncontrolled and rapid proliferation of cancer cells in the absence of efficient vasculature (Eales
et al., 2016). Initial tumor growth occurs without angiogenesis (Tafani et al., 2016). When
intercapillary distances exceed the diffusion limit of oxygen (200 μm), average oxygen partial pressure (pO2) drops from ~35 mmHg to ~10 mmHg (Tafani et al., 2016). Intratumoral hypoxia
6
is spatially heterogenous, with between 50-60% of a solid tumor’s mass being hypoxic on average (Vadde et al., 2017). While much is known about how hypoxia affects the tumor
microenvironment, the exact biological mechanism by which cells first detect low oxygen levels is under active investigation (Hamanaka et al., 2009). Despite this knowledge gap, hypoxia has several broad effects on tumors which will be briefly described here, including maintaining cancer cell stemness (Vadde et al., 2017), inducing release of damage-associated molecular patterns (DAMPs) (Tafani et al., 2016), increasing production of reactive oxygen species (ROS) (Tafani et al., 2016), and triggering angiogenesis and vascularization of the tumor mass (Eales et al., 2016).
In the colon and rectum, superficial glandular epithelial cells (of which > 95% of CRC cases arise)(Marley et al., 2016; Hinck et al., 2014; Xue et al., 2012) ubiquitously express a family of transcription factors, known as hypoxia inducible factors (HIF) (Ulivi et al., 2016), of which HIF-1 is the best studied (Vadde et al., 2017). HIF-1 consists of two subunits: HIF-1α and HIF-1β (Ulivi et al., 2016). HIF-1β is constitutively active whereas the activity of HIF-1α is oxygen-regulated (Ulivi et al., 2016). HIF-1α gene expression has been shown to significantly increase with increased CRC stage (Mansour et al., 2016). In normoxic conditions, HIF-1α undergoes hydroxylation of two proline residues (P402 and P564) via prolyl hydroxylase 2 (PHD-2) (Ulivi et al., 2016; Vadde et al., 2017; Cejudo-Martin et al., 2005). Hydroxylated HIF-1α then binds to the Hippel-Lindau tumor suppression protein (pVHL) located on the E3
ubiquitin ligase complex, which mediates ubiquitination and proteasomal degradation of HIF-1α (Maxwell et al., 2001; Vadde et al., 2017). Alternatively, in hypoxic conditions, HIF-1α
circumvents ubiquitination. From here, HIF-1α, or the structurally related HIF-2α, can act alone to regulate the tumor microenvironment or move inside the cell to the nucleus where it
7
dimerizes with HIF-1β to form a complex which serves as a transcription factor for a variety of genes that support CRC progression (Ulivi et al., 2016). An extensive list of HIF-1 or HIF-1α target genes that support cancer progression has been previously published (Semenza, 2010).
In the stem cell theory of cancer, stemness is defined as the property of self-renewal and proliferative and differentiation potential of a subpopulation of cancer cells (Lathia et al., 2017). With regards to maintaining stemness of CRC in hypoxic conditions, activated HIF-1α interacts with the intracellular domain of the transmembrane protein, Notch1. In the presence of HIF-1α, the half-life of Notch1 increases which stimulates the Notch signaling cascade (Vadde et al., 2017; Cejudo-Martin et al., 2005). The Notch signaling cascade, described in detail elsewhere (Wang et al., 2012), maintains cancer cell stemness by increasing proliferation and
differentiation potential (Vadde et al., 2017). Additionally, HIF-2α (also known as EPAS 1, HLF, or HRF), which is also expressed in CRC, acts as a transcription factor for the Octamer-binding transcription factor 4 gene (Oct-4) and thus upregulates Oct-4 expression (Covello et al., 2006; Santoyo-Ramos et al., 2014). Oct-4 expression has been shown to increase going from normal tissue to benign polyps to CRC tissue with expression ratios of 4.4%, 12.7%, and 42,4%, respectively (Zhou et al., 2015). Specifically, Oct-4 maintains cell stemness within the CRC tumor microenvironment and is also a useful biomarker and potential therapeutic target (Vadde
et al., 2017; Lathia et al., 2017), Therefore, hypoxic conditions contribute to stemness,
progression, and malignancy of CRC.
Next, hypoxia induces necrosis and the subsequent release of DAMPs (Hernandez et al., 2016). DAMPs are a broad array of intracellularly sequestered molecules, which, upon necrosis or other cellular injury or stress, are actively secreted or passively released extracellularly (Land, 2015; Eppensteiner et al., 2018). In CRC, DAMPs include adenosine, ATP, calreticulin,
8
HMGB1, S100A4, S100A8, S100A9, and IL-33 (Hernandez et al., 2016). These DAMPs act as ligands for receptors on nearby tumor cells, dendritic cells, myofibroblasts, or mast cells. Broad downstream pro-tumor effects include tumor growth and progression, tumor regrowth in wound-healing sites such as tumor margins, and metastasis (Hernandez et al., 2016). Additionally, DAMPs such as HMGB1 has been shown to be highly expressed in solid CRC tumors (Sims et al., 2010). However, ATP has been shown to induce an anti-tumor immune response
(Ghiringhelli et al., 2009) and calreticulin has been shown to improve chemotherapy-induced tumor regression (Obeid et al., 2007), and thus DAMPs are considered “double-edged” in that they can have both pro-tumor and anti-tumor effects (Hernandez et al., 2016). However, data regarding hypoxia-necrosis-DAMP pathways in CRC is relatively sparse, yielding an intriguing research gap (Hernandez et al., 2016).
Cancer cells require high ROS levels to proliferate (Sosa et al., 2013). In both normal and cancerous cells, mitochondria are the main producers of ROS, which include hydroxyl radicals, superoxides, and hydroperoxides (Tafani et al., 2016). Under normoxic conditions, complexes I, II, and III of the mitochondrial electron transport chain (ETC) produce low concentrations of ROS during oxidative phosphorylation (Kondoh et al., 2013; Görlach et al., 2015; Hamanaka et al., 2009). Alternatively, under hypoxic conditions in solid tumors, ROS levels increase,
although the exact biological mechanism is currently under investigation (Tafani et al., 2016). ROS levels also increase early in the tumorigenesis, such as during carcinogen exposure or chronic inflammation (Tafani et al., 2016). Increases in ROS can cause mitochondrial DNA damage and mutation (Lievre et al., 2005), as well as inactivation of PHD-2, which would otherwise inactivate HIF-1α. Thus, ROS increase activation of HIF-1α, which, as described
9
previously, drives gene expression that contribute to CRC progression and malignancy (Semenza, 2010).
In summary, hypoxic conditions promote non-angiogenic CRC tumor progression by maintaining cancer cell stemness (Vadde et al., 2017), inducing release of damage-associated molecular patterns (DAMPs)(Tafani et al., 2016), and increasing production of reactive oxygen species (ROS) (Tafani et al., 2016). However, the most prominent effect of CRC tumor hypoxia is angiogenesis, which will be described in the following section.
1.1.2 Angiogenesis in colorectal cancer
The most well-known and studied effect of hypoxia is angiogenesis. As previously stated, 1α is activated during hypoxia and translocates to the nucleus where it dimerizes with HIF-1β. This dimerized complex, also known as HIF-α/Arnt, undergoes posttranslational
modification and binds to hypoxia response elements (HREs) of target gene promoters and enhancers with the sequence G/ACGTG (Krock et al., 2011). HIF upregulates a variety of pro-angiogenic proteins including fibroblast growth factor (FGF)(Korc et al., 2009), vascular endothelial growth factor (VEGF) (Duff et al., 2006), angiopoietin-1 and 2(Ellis et al., 2002), platelet-derived growth factor (PDGF) (Manzat Saplacan et al., 2017), as well as the angiogenic chemokine, monocyte chemoattractant protein-1 (CCL2 aka MCP-1)(Yoshidome et al., 2009), and a variety of interleukins (Krock et al., 2011). The angiogenic effects of FGF, VEGF, PDGF, angiopoietins, and interleukins are well-understood.
The less well-known effects of CCL2, and its receptor, CCR2, are briefly described here. After CCL2 is transcribed and translated by CRC cells and monocytes/macrophages, in part due to HIF-1, it binds to CCR2 on target cells which include monocytes, macrophages, memory T lymphocytes, natural killer (NK) cells, and arterial endothelial cells (Deshmane et al., 2009). The
10
CCL2-CCR2 binding on endothelial cells causes upregulation of MCP-1-induced protein
(MCPIP), which is a transcription factor for cadherins 12 (cdh12) and cadherin 19 (cdh19). It has been shown that in vitro knockdown of cdh12 and cdh19 reduced capillary formation (Niu et al., 2008), although the exact biological mechanism is not fully elucidated (Roy et al., 2012).
Finally, CCL2 induces gene expression of HIF-1α, creating a pro-angiogenic feedback loop (Hong et al., 2005). Thus, HIF-1 mediates CRC tumor angiogenesis by up-regulation of myriad pro-angiogenic growth factors, cytokines, and chemokines.
1.1.3 Clinical background: diagnostic standard for colorectal cancer
Colonoscopy is the gold standard for CRC diagnosis because of its ability to quickly examine the entire colon while simultaneously performing biopsies and polypectomies (Geiger et al., 2009) (Figure 3). Colonoscopies are recommended every 10 years beginning at age 50 for average-risk individuals, although screening prevalence is only 63% for this group (Burt et al., 2010; Society, 2017).
Figure 3. Colonoscopy is the gold standard for CRC diagnosis because of its ability to quickly examine the entire colon while simultaneously performing biopsies and polypectomies. Images sourced from the Smart Servier Medical Art, which are free to share, copy, and redistribute under Create Commons License
CC BY 3.0.
Other diagnostic tests do exist, such as the fecal occult blood test (FOBT), fecal
11
tomography colonography (CTC), but colonoscopy is still used to confirm abnormal results in most cases (Geiger et al., 2009; Society, 2017; Navarro et al., 2017). Treatment for CRC is based on the Tumor, Node and Metastasis (TNM) staging system. The TNM system stages tumors I-IV (Figure 4) based on how deep the tumor has spread, how many lymph nodes contain tumor cells, and number of distant metastases (Dienstmann et al., 2017). Stages I, II, III, and IV account for 28%, 27%, 26%, and 19% of cases at diagnosis, respectively, according to a 2013 meta-analysis of 132,696 patients based on data from the Surveillance, Epidemiology, and End Results
Program (SEER) database (Lee et al., 2013).
Figure 4. The TNM system stages tumors I-IV based on how deep the tumor has spread, how many lymph nodes contain tumor cells, and the number of distant metastases. Image sourced from the Smart Servier Medical Art, which are free to
share, copy, and redistribute under Create Commons License CC BY 3.0.
However, in locally advanced CRC (stages II and III), which account for over half of patients at diagnosis, TNM staging less clearly predicts patient prognosis, so standard treatment for both stages includes colectomy with postoperative adjuvant chemotherapy (Dienstmann et
12
al., 2017; Lee et al., 2013). Currently, the most clinically valuable method to classify tumors is the tumor, node, and metastasis (TNM) staging system, which is used to guide treatment.
1.1.4 Clinical background: treatment standard for colorectal cancer
In recent years, growing evidence has supported using preoperative neoadjuvant
chemotherapy prior to surgical resection to achieve a complete eradication of cancer cells before surgery, or, at least, a reduction in intraoperative tumor cell shedding (Zhou et al., 2013; Boland
et al., 2014). Such preoperative therapy typically uses a fluorouracil-based regimen, such as
FOLFOX (Jeon et al., 2011). A patient’s response to neoadjuvant chemotherapy is a critical prognostic indicator; patients who exhibit a significant reduction in tumor burden during
neoadjuvant chemotherapy are more likely to experience complete resection of the tumor during colectomy, have fewer local and distal recurrences (Zhou et al., 2013), and have greater 5-year disease-free survival (Martin et al., 2012). However, in patients treated with neoadjuvant chemotherapy, pathologic complete response (pCR), a complete eradication of tumor cells, and surgical downstaging still remain low (both ~20-25%) (Zhou et al., 2013). Predicting which patients will respond to neoadjuvant chemotherapy, and which drugs are most appropriate, remains challenging (Wang et al., 2017). Ideally, CRC preoperative treatment would be tailored to each patient based on initial therapeutic response, with the end goal of avoiding surgery if possible (Walker et al., 2014). At present, in locally advanced CRC, fluorouracil-based FOLFOX chemotherapy is generally given to patients in 3-4 cycles over 6-8 weeks in the neoadjuvant setting, following by surgery and by 9-12 cycles of adjuvant chemotherapy over 18-24 weeks (Zhou et al., 2013; Cheeseman et al., 2008; Habr-Gama et al., 2010). The current FOLFOX treatment regimen consists of 2,400 mg/m2 of 5-FU, 400 mg/m2 of leucovorin, and 85 mg/m2 of oxaliplatin per cycle. Occasionally, irinotecan is given instead of oxaliplatin at a dose
13
of 180 mg/m2 in the FOLFIRI treatment regimen (de Gramont et al., 2000; Cheeseman et al.,
2008; Maindrault-Goebel et al., 2000; Fuchs et al., 2007; Goldberg et al., 2004). Tumor
therapeutic response to neoadjuvant chemotherapy is assessed using radiological techniques (CT, PET-CT, or MRI) following conclusion of neoadjuvant chemotherapy (after 1.5-2 months) and before surgery (Habr-Gama et al., 2010) (Figure 5).
Figure 5. Tumor therapeutic response is not assessed until nearly 2 months following chemotherapy initiation
However, several studies have shown that therapeutic response can, in fact, be assessed on a scale of days, rather than months, using a variety of methods. However, most methods lack practicality as routine clinical applications (Park et al., 2014). Therefore, one branch of CRC research is devoted to developing clinically-translatable methods to rapidly assess (within 72 hours following therapy initiation) whether a therapy regimen is effective on a per patient basis (Berger et al., 2017; Roblyer et al., 2011). A second branch is devoted to exploring
immunotherapy, a broad term for any treatment that modulates the host immune system to fight cancer, to compliment neoadjuvant chemotherapy and increase rates of pCR and decrease rates of distal recurrence (Boland et al., 2017; Walker et al., 2014; Bouvier et al., 2015; Xiang et al., 2014). The research in this proposal exists at the interface between these two branches.
14
1.1.5 Effects of chemotherapy on colorectal cancer tumors
Fluorouracil-based chemotherapy, especially 5-fluorouracil (5-FU) used in the FOLFOX regimen (combined 5-FU, leucovorin, and oxaliplatin), has been a staple in CRC treatment for nearly 60 years (Noordhuis et al., 2004; Monteil et al., 2009), with leucovorin and oxaliplatin becoming standard in first-line chemotherapy in the early-to-mid 2000’s after successful Phase III clinical trials (Jeon et al., 2011; Wolmark et al., 1999; de Gramont et al., 2000; Andre et al., 2003; Goldberg et al., 2004). In the body, 5-FU is converted to fluorodeoxyuridine
monophosphate (FdUMP). FdUMP forms a complex with thymidylate synthase (TS), an enzyme that catalyzes deoxyuridine monophosphate (dUMP) to deoxythymidine
monophosphate (dTMP), which is a DNA monomer and key for DNA replication. Thus, 5-FU-mediated depletion of dTMP results in cytotoxicity and apoptosis in the rapidly growing cells in CRC (Zhang et al., 2008).
1.1.6 Immunotherapy in colorectal cancer
Immunotherapy is an emerging approach to treat a variety of cancers by modulating the immune system. Although the pathogenesis of CRC is well understood, the effects of
immunotherapy on the TME is less understood (Boland et al., 2017). Immunotherapy, in general, can fall into one of several categories: 1) adoptive cell transfer therapy (ACT) (Rosenberg et al., 2008), 2) monoclonal antibody (mAb) therapy (Weiner et al., 2009), 3) immune checkpoint inhibitors (Dine et al., 2017; Jacobs et al., 2015), 4) cancer vaccines (Guo et al., 2014), and 5) cytokine-targeted immunotherapy (Lee et al., 2011; Waldmann, 2017). The immunotherapy focus of this proposal is on cytokine-targeted immunotherapy; for brevity and focus, other categories of immunotherapy are not discussed. Several mAb immunotherapy drugs are FDA approved for CRC, including nivolumab (Mehrvarz Sarshekeh et al., 2018) and pembrolizumab
15
(Birendra et al., 2017), as well as ipilimumab, which is currently under FDA priority review. Other drugs such as durvalumab and tremelimumab, also mAbs, are undergoing clinical trials (Grierson et al., 2017). The mAb immunotherapy drugs have been a breakthrough for treating MSI-high metastatic CRC (Grierson et al., 2017), one of several subtypes of CRC (Guinney et al., 2015). However, this subtype is estimated to represent less than 20% of all CRC cases (Guinney et al., 2015; Boland et al., 2011). Thus, there has been renewed research interest in cytokine-targeted immunotherapy to compliment neoadjuvant chemotherapy regimens to capture a wider variety of patients (Lynch et al., 2016). Whereas most cancers have, in general,
benefitted from immunotherapeutics, CRC, aside from MSI-high metastatic CRC, has not (Boland et al., 2017). One overarching hypothesis as to why CRC has benefitted less from immunotherapy compared to other cancers is the controversial role of tumor-associated macrophages (TAMs) in the TME (Erreni et al., 2011).
1.1.7 Tumor-associated macrophage controversy in colorectal cancer
TAMs, the most abundant immune cell in the TME, also have the most substantial and pervasive effect of any immune cell in the TME (Allavena et al., 2008; Chen et al., 2005; Erreni
et al., 2011; Marech et al., 2016). In CRC, TAMs have been shown to have both anti-tumor and
pro-tumor functions, depending on whether they are polarized more towards an M1 (classical) or M2 (alternative) phenotype and their physical location within the tumor (Marech et al., 2016). CRC cells, independent of sub-type (Lim et al., 2016; Becht et al., 2016), recruit circulating monocytes via chemotaxis to the TME through monocyte chemoattractant protein-1 (CCL2), a highly elevated chemokine in CRC (Marech et al., 2016; Chun et al., 2015; Becht et al., 2016;
Lim et al., 2016). Monocytes differentiate into M2-polarized TAMs through a variety of
16
responsible for monocyte-TAM differentiation), CCL2, CXCL12, TGFα, MFG-E8, and MIF produced by CRC cells, helper T-cells, regulatory T-cells, mesenchymal stem cells, and
previously differentiated TAMs (Liu et al., 2015). CCL2 is primarily responsible for monocyte recruitment, which leads to TAM infiltration into the TME. Broad anti-tumor functions of
classically activated M1-polarized TAMs include inflammation and immune response (Funada et al., 2003; Sugita et al., 2002; Zhou et al., 2010). On the other hand, pro-tumor functions of alternatively activated M2-polarized TAMs include tumor growth, angiogenesis,
immunosuppression, and matrix remodeling (Liu et al., 2015) (Figure 6).
Figure 6. TAMs in CRC generally have pro-tumor functions. Image of macrophage sourced from the Library of Science Medical Figures by
somersault1824, which are free to share, copy, and redistribute under Create
Commons License CC BY-NC-SA 4.0.
For tumor growth and angiogenesis, TAMs release a variety of pro-angiogenic growth factors (GFs) including VEGF, PDGF, EGF, FGF, TGF-β, MMP9, CXCL8, IL-1, IL-6, and IL-8
(Liu et al., 2015). Additionally, TAMs suppress the activity of cytotoxic (CD8+) T-cells, whose
otherwise elevated expression is associated with increased 5-year survival in CRC patients (Ziai
et al., 2018), by releasing immunosuppressive factors including IL-10, TGF-β, CCL17, CCL18,
CCL22, and PGE2 (Liu et al., 2015). For matrix remodeling, TAMs release a variety of proteolytic enzymes called matrix metalloproteases (MMPs) which allow for tumor expansion and release of ECM-sequestered pro-angiogenic GFs. Finally, TAMs release a variety of
17
cytokines such as IL-10, CXCL12, and MIF that help differentiate monocytes into TAMs (Marech et al., 2016; Erreni et al., 2011; Barbera-Guillem et al., 2002; Burmeister et al., 2017; Ucuzian et al., 2011). It has recently been shown that macrophages induce resistance to 5-FU chemotherapy, and that this TAM-induced resistance may contribute to the heterogenous patient response to chemotherapy (Zhang et al., 2016; Zhang et al., 2008). Currently, a gap in CRC research is how cytokine-targeted immunotherapy affects tumor-associated macrophages in the colon TME. Furthermore, does altering TAM population impact tumor response to
chemotherapy? If so, can this impact be quantified by clinically translatable tools on a scale of days rather than months after treatment initiation?
1.1.8 Current methods to assess tumor response to therapy
This study proposes using DRS as a tool to monitor early tumor therapeutic response to chemotherapy and CCL2-targeted immunotherapy. However, other methods to quantify
therapeutic response do exist. Clinically, after initiation of neoadjuvant chemotherapy, tumor response is not assessed for nearly 2 months using radiological imaging methods (Kim et al., 2015; Habr-Gama et al., 2010). There are several solutions to this problem, all with advantages and disadvantages. One clinical assessment tool is quantifying carcinoembryonic antigen (CEA), a cell adhesion glycoprotein elevated in the blood of CRC patients that correlates with tumor stage. However, this test, although widely used and inexpensive, is non-specific does not sufficiently predict positive responders to therapy (Dreyer et al., 2017). Many biomarkers, such as p53, Ki67, and VEGF, are under investigation to correlate with initial tumor response, but the literature shows conflicting results (Kim et al., 2015). Both cancer stem cell markers (CD133, CD44, and CD24) and gene expression profiling show promising results for predicting tumor response, although it is generally agreed that these methods have several practical limitations in
18
clinical practice despite high potential for elucidating the complex genetic response of CRC
(Kim et al., 2015). On the other hand, several optical and spectroscopic methods have shown
promise in assessing tumor response after neoadjuvant chemotherapy. Several diffuse spectroscopy-based studies have shown a significant increase in oxyhemoglobin, or
concentration of oxygen-bound heme in blood (Stadler et al., 2008), within one day after starting neoadjuvant chemotherapy (Figure 7).
Figure 7. DRS is a clinically translatable & complimentary tool that can quantify oxy-hemoglobin flare (tumor response) to guide clinicians in modifying or ceasing treatment.
This increase, referred to as the “oxyhemoglobin flare,” was shown in patients with partially or pathologically complete responding tumors but not in nonresponding patients (Roblyer et al., 2011). The oxyhemoglobin flare has been extensively shown by the Tromberg group in clinical trials of locally advanced breast cancer patients receiving neoadjuvant
chemotherapy (Falou et al., 2012; Ueda et al., 2013; Tromberg et al., 2017). However, a gap in research is that the oxyhemoglobin flare has not been quantified after combinatorial
19
chemotherapy and immunotherapy, and furthermore, has not been quantified in CRC tumors. DRS is a probe-based spectroscopy tool, operating under the same principals as described in the above studies, with the ability to accurately assess oxyhemoglobin in vivo (Chin et al., 2017; Rajaram, Gopal, et al., 2010; Rajaram et al., 2016; Jayanthi et al., 2011; Greening, Rajaram, et al., "Multimodal Imaging and Spectroscopy Fiber-Bundle Microendoscopy Platform for Non-Invasive, in Vivo Tissue Analysis," 2016; Greening, James, et al., 2016; Greening, Rajaram, et al., "In Vivo Measurement of Non-Keratinized Squamous Epithelium Using a Spectroscopic Microendoscope with Multiple Source-Detector Separations," 2016; Hennessy et al., 2015; Glennie et al., 2015; Yu et al., 2014; Glennie et al., 2014; Karsten et al., 2013; Spliethoff et al., 2014). In the past decade, there have been 6 clinical trials using DRS in CRC (Jermyn et al., 2017; Tanis, Evers, et al., 2016; Spliethoff et al., 2016; Tanis, Spliethoff, et al., 2016; Wang et al., 2009; Douplik et al., 2010). However, all trials focus on early cancer diagnostics and
intraoperative surgical guidance, rather than tracking tissue response to therapy. Thus, our group believes that non-invasively quantifying the oxyhemoglobin flare following initiation of
chemotherapy and cytokine-targeted immunotherapy via DRS is worth exploring.
1.1.9 Significance of clinical health problem
At present, there have been no studies correlating tumor perfusion response (via clinically translatable DRS) with biological correlates, such as TAMs and associated cytokines, in the TME following combinatorial cytokine-targeted immunotherapy and chemotherapy in a mouse model of CRC. We expect that DRS can potentially be used in the clinic to monitor the
oxyhemoglobin flare in colon tumors of patients in response to neoadjuvant therapy initiation (Fig. X). We have built and validated a DRS platform that can monitor the oxyhemoglobin flare in response to therapy initiation in a mouse model of CRC. We note that, although we have
20
claimed DRS is potentially clinically translatable (i.e. fits through the biopsy port of a standard colonoscope with minimal interference with established clinical workflow), the specific DRS platform used in this study is not translatable since we hope to quantify daily perfusion metrics in mouse subcutaneous tumor allografts, which necessarily require a larger probe size.
1.1.10 Research perspectives of diffuse reflectance spectroscopy
DRS has been received favorably in the clinical management of certain cancers such as breast and skin cancer, pioneered in part by the Tromberg and Tunnell groups, respectively (Tromberg et al., 2017; Ueda et al., 2013; Roblyer et al., 2011; Shah et al., 2004; Hennessy et al., 2015; Bish et al., 2014; Sharma et al., 2014; Bish et al., 2011; Rajaram, Reichenberg, et al., 2010; Rajaram, Aramil, et al., 2010). Adoptability in CRC has been milder, although the
Richards-Kortum group has done a lot of work with microendoscopy imaging systems compatible with the biopsy port of standard colonoscopes (Parikh et al., 2014; Chang et al., 2013) or upper GI endoscopes (Muldoon et al., 2011; Muldoon et al., 2010; Muldoon et al., 2008; Muldoon et al., 2007; Pierce, Schwarz, et al., 2012; Pavlova et al., 2009; Schwarz et al., 2008). DRS systems, which can be of comparable physical size to microendoscopes, have also been integrated with colonoscopes in clinical research studies (Schols et al., 2015). In fact, future studies in the Translational Biophotonics and Imaging Laboratory at the University of Arkansas will explore DRS in a colonoscope in an orthotopic mouse model of CRC. Although physically feasible, clinical adoptability of DRS (i.e. integration of DRS within standard colonoscopy workflow) is not yet scientifically justified. Therefore, one goal of my PhD work was to lay the foundation for our laboratory to be a pioneer in compiling evidence to justify using DRS in the clinical management of CRC. In addition to DRS, long-term clinical prospects of cytokine-targeted immunotherapy are promising. Neutralizing antibodies for specific cytokines involved
21
in pro-tumor pathways have shown therapeutic activity in both murine models and in several human cancers. Several research groups are engineering innovative targeted cytokine delivery approaches to reduce systemic toxicity. Overall, cytokine-targeted immunotherapy will continue to be an active cancer research field (Lee et al., 2011; Waldmann, 2017). This research
capitalizes on this prospect and will help clarify how blocking of several key intercellular communication pathways affects certain aspects of the colon TME and tumor therapeutic response.
1.1.11 Murine subcutaneous allograft model of colorectal cancer
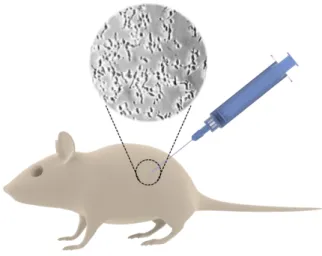
In the studies reported in this dissertation, Balb/c mice were subcutaneously injected with CT26 cells in sterile saline (Figure 8). CT26 cells are colon carcinoma cells derived from the Balb/c mouse strain. CT26 cells were originally induced in 1975 via
N-nitroso-N-methylurethane-(NNMU) and are an undifferentiated cell line (Ojo-Amaize et al., 2007). The CT26 cell line is currently one of the most common models of murine CRC. As such, Balb/c mice were chosen as the host organism since CT26 cells were originally derived from this mouse strain (Castle et al., 2014). A 2014 genomic report verified that subcutaneous CT26 tumor allografts in Balb/c mice have gene expression profiles similar to sporadic, undifferentiated, and metastatic human CRC (Castle et al., 2014) and are a valid model for an in vivo CRC test system.
22
Figure 8. Balb/c mice were the model organization for the studies presented here. CT26 cells were injected subcutaneously into the left flank to form colon tumor allografts. Image of mouse and syringe sourced from the Library of Science Medical Figures by somersault1824, which are free to share, copy, and
redistribute under Create Commons License BY-NC-SA 4.0.
1.2Engineering focus: diffuse reflectance spectroscopy
1.2.1 Introduction to diffuse reflectance spectroscopy platforms
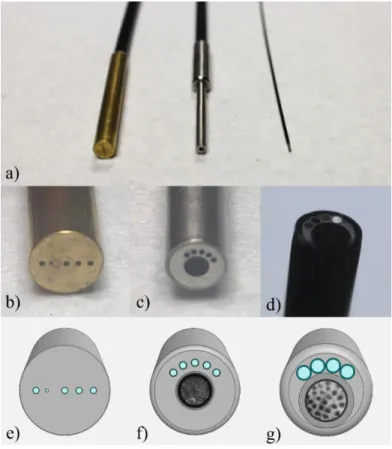
In this dissertation, we have engineered three DRS systems (Figure 9); however, only two systems were used for data collection in this dissertation. The first system, described in detail in Chapter 2 and briefly in Chapter 3, combines DRS with fiber-based high-resolution
microendoscopy (HRME) (Figure 9, acf). This system was used for initial feasibility testing to investigate a combined DRS-HRME system and was tested on various in vitro and human in vivo
platforms. Additionally, a novel third modality was included, diffuse reflectance intensity mapping (DRIM), although this modality was only briefly explored in Chapter 2. The second system, described in detail in Chapters 4-6, is a uni-modal DRS system that was optimized to quantify tissue optical parameters in subcutaneous colon tumors in mice (Figure 9, abe). This system was designed to test the feasibility of using DRS as a method to quantify tumor therapeutic response to chemotherapy and immunotherapy. A third DRS system, described briefly in the overall discussion (Chapter 7), is a combined DRS-HRME system optimized to fit
23
within the biopsy port of a small animal colonoscope to test the feasibility of using combined DRS-HRME as a method to monitor tumor therapeutic response in orthotopic murine colorectal tumors (Figure 9, adg). The engineering of this third system was pioneered by Ariel Mundo of the Translational Biophotonics and Imaging Laboratory (Muldoon Lab), while I served as a technical advisor based on my previous DRS experience.
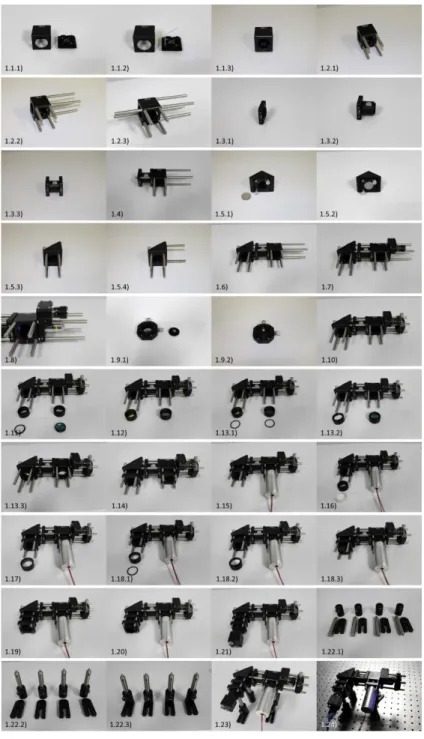
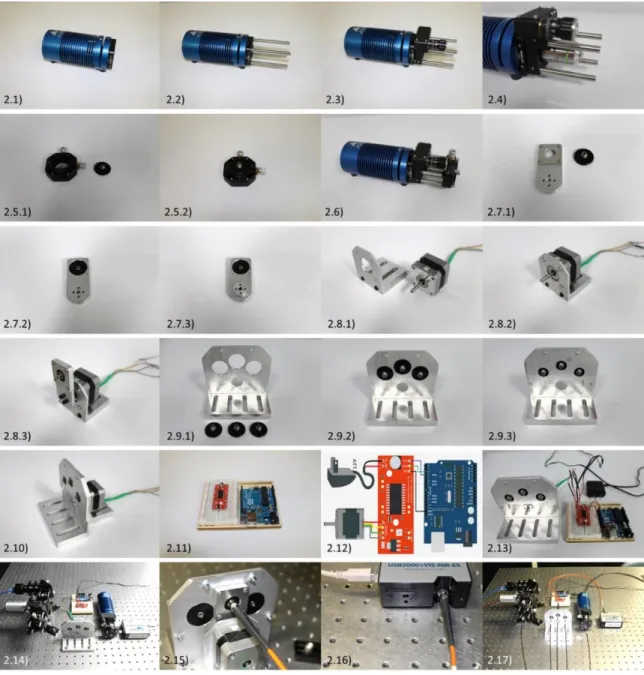
Figure 9. In this dissertation, we have engineered three DRS systems (a). The first system (c, f) was used for initial feasibility testing to investigate a combined DRS-HRME system and was tested on various in vitro and human in vivo
platforms. The second system (b, e) was designed to test the feasibility of using DRS as a method to quantify tumor therapeutic response to chemotherapy and immunotherapy in the Balb/c-CT26 subcutaneous model of CRC. The third system (d, g) is a combined DRS-HRME system optimized to fit within the biopsy port of a small animal colonoscope to test the feasibility of using combined DRS-HRME as a method to monitor tumor therapeutic response in orthotopic murine colorectal tumors. Photo and 3D renderings of probe taken and created by the author.
24
1.2.2 High-resolution microendoscopy
HRME will be briefly described here since it is used as an imaging modality for two of the three DRS systems. HRME is a non-invasive diagnostic imaging technique that provides sub-cellular resolution images of tissue in vivo. Tissue samples are topically stained with a
fluorescent contrast agent like proflavine, an acridine-derive fluorescent dye that intercalates DNA. Proflavine highlights cell nuclei with appropriate excitation light to allow visualization of morphological features (Muldoon et al., 2007; Pierce, Guan, et al., 2012; Pierce et al., 2011; Quinn et al., 2012; Chang et al., 2013; Keahey et al., 2015; Parikh et al., 2014; Prieto et al., 2015). Other contrast agents, such as benzoporphyrin-derivative monoacid ring A (BPD-MA) and fluorescein, have also been investigated for similar purposes (Pierce et al., 2011). Generally, excitation light is delivered to the specimen though a coherent image fiber consisting of tens of thousands of individual fibers. The image fiber is placed in direct contact with tissue to excite fluorescent contrast agent and resultant fluorescence is collected by the same image fiber. Lateral and axial resolution are approximately 4 and 20 µm, respectively, with variable fields-of-view depending on the diameter of the image fiber and any distal optics. The primary advantages of HRME are low cost and portability, making this technique clinically translatable (Muldoon et al., 2007; Muldoon et al., 2011; Parikh et al., 2014; Chang et al., 2013; Quinn et al., 2012; Pierce,
Guan, et al., 2012; Keahey et al., 2015; Pierce et al., 2011). Development of these systems has
led to clinical studies in the upper and lower gastrointestinal tracts (Muldoon et al., 2007; Muldoon et al., 2011; Parikh et al., 2014; Chang et al., 2013) and cervix (Quinn et al., 2012; Pierce, Guan, et al., 2012; Keahey et al., 2015). However, a limitation of HRME is insufficient depth resolution, minimizing effectiveness in detecting dysplastic changes in the sub-epithelial microenvironment. Only cells on the topmost 20 µm can be visualized and thus some
25
information is lost that would normally be apparent with histopathological analysis (Keahey et al., 2015; Muldoon et al., 2007; Muldoon et al., 2011). While other microendoscopy methods, such as laser scanning confocal systems, are able to perform axial optical sectioning to resolve cellular structures below the surface, these systems require the use of complex galvanometer or microelectromechanical (MEMS)-based approaches to raster scan the excitation source across the surface of the tissue (Rivera et al., 2011; Piyawattanametha et al., 2010; Chen et al., 2015). Fiber bundle microendoscopy, as described in this manuscript, does not include these features in favor of increased robustness and decreased cost. An additional limitation of HRME is its inability to quantify changes in tissue scattering and absorption (Muldoon et al., 2007; Pierce,
Guan, et al., 2012; Pierce et al., 2011; Quinn et al., 2012; Chang et al., 2013; Keahey et al.,
2015; Parikh et al., 2014). Thus, HRME techniques could benefit from additional quantitative and depth sensitive modalities.
1.2.3 Diffuse reflectance spectroscopy
Recent work has described DRS, which uses short source-detector separations (SDS) (less than 1 mm) to non-invasively interrogate deeper within epithelia and quantify optical properties (Kanick et al., 2014; Kanick et al., 2009; Hennessy et al., 2014; Jayanthi et al., 2011; Zonios et al., 1999; Marin et al., 2005; Rajaram, Reichenberg, et al., 2010). Optical properties depend on tissue morphology and can provide a means to quantify dysplastic changes (Jayanthi
et al., 2011). More specifically, broadband DRS has been used in multiple clinical studies
including quantifying hemoglobin absorption to distinguish between different grades of oral cancer (Jayanthi et al., 2011), distinguishing between adenomatous colon polyps and normal tissue (Zonios et al., 1999), diagnosing cervical dysplasia in vivo (Marin et al., 2005), and quantifying changes associated with non-melanoma skin cancer (Rajaram, Reichenberg, et al.,
26
2010). These studies have shown that DRS can be a useful, non-invasive method to quantify the health of small volumes of tissue although the ability to resolve fine cellular detail with
spectroscopy is non-existent (Rajaram, Reichenberg, et al., 2010; Marin et al., 2005; Zonios et al., 1999; Jayanthi et al., 2011). DRS is used in this study because it can indicate tumor
perfusion, which is affected by treatment with chemotherapy and immunotherapy. Alteration of the monocyte and TAM population in the colon TME via cytokine-targeted immunotherapy is hypothesized to alter downstream pro-angiogenic signals (Liu et al., 2015). As tumors grow, they require an adequate oxygen supply, nutrients, and the ability to remove waste such as CO2,
catabolites, and other toxins (Cuenod et al., 2013). Angiogenesis is a normal process of new blood vessel formation from already existing nearby blood vessels, and is utilized by tumors to meet their growing metabolic demands (Nishida et al., 2006; Dighe et al., 2012). Angiogenesis is known to increase tumor perfusion, defined as blood flow through the tumor’s circulatory
network (Cuenod et al., 2013). Functional changes in angiogenesis-induced perfusion occur prior to structural/morphological changes, such as tumor growth (Cuenod et al., 2013; Hu et al., 2007). It is well known that tumor perfusion is a strong predictor of therapeutic response to chemotherapy. Delivery of cytotoxic drugs, such as 5-FU, and availability of oxygen are critical factors in inducing apoptosis of colon tumor cells (Turley et al., 2012). DRS is a probe-based technique that can measure bulk tumor perfusion. DRS has several advantages including ability to quantify the functional oxyhemoglobin flare (as a quantifier of early perfusion) and tissue optical properties, non-invasiveness, depth-sensitivity, potential for clinical translation, ease-of-implementation in the laboratory, and scalability (physical size) for different tissue types in question. Because of the inherent scalability and adaptability of DRS, each DRS system and probe must be extensively calibrated to extract accurate perfusion metrics. This aim focuses on
27
validating a DRS platform for in vivo assessment of tissue perfusion and quantification of tissue optical properties, all of which may be affected by chemo- and/or immunotherapy-induced changes to the TME. Fundamental tissue optical properties are the reduced scattering coefficient (μs’), which depends on light scattering from cell nuclei, lipid membranes of cells and organelles,
keratin (in skin), and collagenous, elastic, and reticular fibers (Lister et al., 2012; Arifler et al., 2007; Kumka et al., 2012; Sandell et al., 2011), and absorption coefficient (μa), which depends
on hemoglobin concentration ([Hb]) and oxygen saturation (SaO2) (Prahl, 2015; Greening,
James, et al., 2016; Rajaram, Reichenberg, et al., 2010; Rajaram, Aramil, et al., 2010; Rajaram, Gopal, et al., 2010; Rajaram et al., 2008). The μa also relies on melanin, fat, and water, although
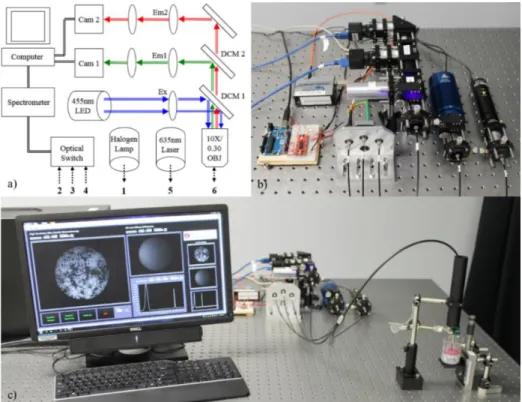
these physiological parameters are not quantified in this study (Spliethoff et al., 2014; Prahl, 2015). A mobile, all-inclusive spectroscopy suite, which integrates with all three custom DRS probes, was created to monitor in vivo tissue properties (Figure 10).
Figure 10. DRS setup for in vivo measurements on tissue or tissue-simulating phantoms. Photo taken by the author.
Bulk, volume-averaged tumor perfusion was optically quantified by DRS-derived oxyhemoglobin (product of total hemoglobin concentration and tissue oxygen saturation). The
28
post-processing DRS software to quantify µs’ and µa is based on the damped least-squares fitting
method, in which a curve is iterated to “best-fit” the raw spectra. Based on the best-fit curve, µs’
and µa experimental values are extracted. Once µa is accurately quantified, THC and StO2 of in
vivo tissue can be derived (process described in detail in Chapters 2 and 4).
1.3Diffuse reflectance physics
1.3.1 Turbid media
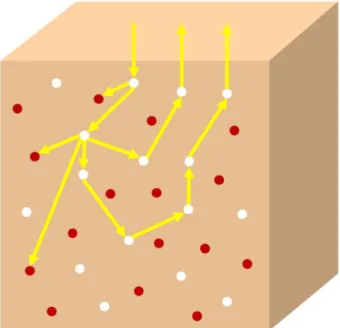
DRS is one a simple and widely used technique for non-invasively studying biological tissues. All biological tissues, including colorectal and CRC tissue, are considered turbid media (Zonios et al., 2011). But what is exactly meant by the term, turbid media? Turbid media is any medium which has significant scattering due to randomly distributed optical nonuniformities. A light wave/photon contacting or passing through the turbid media will change direction based on the index of refraction throughout the medium (Figure 11). A photon will continue scattering throughout the turbid media until it is absorbed by an absorber or is transmitted or diffusely reflected from the media. Light propagation through biological tissues can indicate the structural and functional makeup of the tissue due to scattering, absorption, and fluorescence events; however, light propagation through turbid media is a challenging problem (Romanov et al., 2012).
29
Figure 11. An oversimplification of the movement of photons through turbid media. Photons can be scattered by scattering agents (white circles) or absorbed by absorbing agents (red circles). Image created by the author.
Light propagation in tissue can be fully described by the radiative transport equation (RTE). The RTE states that the total radiance for photons traveling in a specific direction through time and space is equal to the sum of all sources that affect (increase or decrease) radiance. Radiance is defined as the quantity of photons per unit volume. A more detailed description of the RTE can be found in numerous sources (Liemert et al., 2012; Liemert et al., 2014; Wilson et al., 2011). The RTE has been successfully used to model photon transport in turbid media. However, the RTE is mathematically and computationally intensive, and because of this, research has sought to create simpler models that approximate the RTE (Liemert et al., 2014; Liemert et al., 2012; Wilson et al., 2011; Kim et al., 2006; Kim, 2004; Kim et al., 2003).
One such simplification used in biological tissues is the diffuse approximation. The diffusion approximation is a method that has been used to determine μs’ and μa in tissue (Wilson
et al., 2011; Reif et al., 2007; Gibson et al., 2005; Kim, 2004; Kim et al., 2003). However, the
30
the μs’ must be much greater than the μa, and 2) large source-detector separations must exist
(Reif et al., 2007). Some sources have also claimed that the diffusion approximation is not valid in media that exhibit anisotropic scattering (Gibson et al., 2005). These requirements ensure that any collected photons have traveled through large volumes of tissue. In turn, this ensures that extracted optical properties represent an accurate average of the real optical properties. However, in many cases, investigators used small endoscopy devices, to sample thin tissues with a small sampling depth. This is the case for dysplasia or cancers that are confined to the epithelium, which is only between 100-500 µm thick (Rajaram et al., 2008).
Therefore, a distinction must be made between what is meant by the diffuse regime, in which the diffusion approximation is valid, and the sub-diffuse regime, in which the diffusion approximation is not valid (Reif et al., 2007; Subramanian et al., 2007; Turzhitsky, Rogers, et al., 2010; Turzhitsky, Radosevich, et al., 2010; Bosschaart
et al., 2011; Kanick et al., 2014). For many of the cases listed here, the validity of the
diffusion approximation begins to fail for one of two reasons. The first reason is that μs’
is not much greater than μa (Reif et al., 2007; Turzhitsky, Radosevich, et al., 2010;
Turzhitsky, Rogers, et al., 2010; Subramanian et al., 2007; Bosschaart et al., 2011). The μs’ is considered “not much greater” than the μa when albedo is less than 0.9 (Rajaram et al., 2008). The second reason the diffusion approximation begins to fail is the use of small source-detector separations common to small endoscopic probes. A source-detector separation is considered “small” if it is less than approximately one reduced mean free path (Rajaram et al., 2008; Subramanian et al., 2007; Bosschaart et al., 2011; Kanick et al., 2014). Therefore, although most “diffuse reflectance spectroscopy” is really “sub-diffuse reflectance spectroscopy”, the term “sub-“sub-diffuse” will not be used for clarity.
31
1.3.2 Light scattering in turbid media
There are two primary types of scattering: Rayleigh scattering and Mie scattering (Figure 12). Simply, Rayleigh scattering refers to scattering by particles much smaller than the
wavelength of light. Mie scattering refers to scattering by particles larger or of comparable size to the wavelength of light. However, it is more correct to say that all scattering is Mie scattering, and Rayleigh scattering is the Rayleigh limit of Mie scattering (Jacques, 2013). Biological tissue typically exhibits Mie scattering. In biological tissue, organelles such as mitochondria and cell nuclei are the primary scattering agents (Mourant et al., 1998). Striations in collagen fibrils are also responsible for scattering (Arifler et al., 2007). The magnitude of scattering is typically quantified with μs’, which can be measured with DRS.
Figure 12. Rayleigh and Mie scattering in biological tissue (a turbid media). Mie scattering is the name for scattering by a sphere of any size, whereas Rayleigh scattering is a type of Mie scattering in which the scattering agents are much smaller than the wavelength of light (Jacques, 2013). Image created by the author.
1.3.3 Light absorption in turbid media
In addition to μs’, DRS can also measure μa. The μa depends on the concentration of
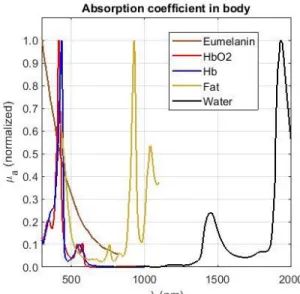
absorbing agents in the biological tissue. In living systems, there are 5 primary absorbers spanning the ultraviolet to near-infrared spectrum (approximately between 300-2000 nm):
32
melanin, oxygenated hemoglobin, deoxygenated hemoglobin, fat, and water. The normalized μa
of these 5 absorbers are shown in Figure 13 (Prahl, 2015).
Figure 13. Normalized absorption coefficients of melanin, oxygenated hemoglobin, deoxygenated hemoglobin, fat, and water in biological tissues. Graph created by the author using data by Scott Prahl (Prahl, 2015).
Our studies report absorption in the visible and very near-infrared spectrum (~450 to 800 nm). Therefore, in the following studies for this dissertation, water is not looked at because absorption is negligible below 1400 nm. Melanin is not analyzed since albino mice (Balb/c) were used as the test subjects. Additionally, some studies were done in the oral mucosa of health human volunteers – oral mucosa does not contain melanin. Finally, fat was not analyzed because, although fat does contribute slightly to absorption in the visible to near-infrared spectrum, it is negligible compared to the two primary absorbers, oxygenated and deoxygenated hemoglobin. Figure 14 shows the absolute μa of
oxygenated and deoxygenated hemoglobin in whole blood compared to the μa of fat
(Prahl, 2015; Greening, James, et al., 2016; Greening, James, et al., 2015; Greening et al., 2018; Greening, Powless, et al., 2015).
33
Figure 14. Absorption coefficients of melanin, oxygenated hemoglobin, and deoxygenated hemoglobin below 1000 nm. Graph created by the author using data by Scott Prahl (Prahl, 2015).
1.4Concluding remarks to introduction
Chapters 2 and 3 represent specific aims 1 and 2, respectively. Aim 3, on the other hand, is longer, and consists of chapters 4, 5, and 6. The following aims were designed to address the investigation and optimization of using DRS as a technique to monitor in vivo tissue health and tumor therapeutic response, specifically in murine colon cancer.
1.5Specific Aims
The overall health focus of this dissertation is CRC. Murine subcutaneous allografts were used as a model for CRC. Specifically, for my dissertation work, I looked at murine
subcutaneous CRC allografts as a model for CRC from two angles. First, can DRS be used as a platform to monitor tumor therapeutic response in this CRC tumor model? Second, does
treatment with standard chemotherapy and macrophage-targeted immunotherapy alter the TME? Combining these two angles (Figure 1), do these TME alterations correlate with DRS data?
Before DRS was implemented in the scientific investigation of therapy response in murine subcutaneous CRC allografts, the first step (Aim 1) was to engineer and characterize a