University of Mississippi University of Mississippi
eGrove
eGrove
Electronic Theses and Dissertations Graduate School
2012
Development and Comparative Predictive Validity of an Outpatient
Development and Comparative Predictive Validity of an Outpatient
Medication Exposure Measure for Risk Adjustment Using
Medication Exposure Measure for Risk Adjustment Using
Retrospective Claims Data
Retrospective Claims Data
Kyle Dennis NullFollow this and additional works at: https://egrove.olemiss.edu/etd Part of the Pharmacy and Pharmaceutical Sciences Commons
Recommended Citation Recommended Citation
Null, Kyle Dennis, "Development and Comparative Predictive Validity of an Outpatient Medication Exposure Measure for Risk Adjustment Using Retrospective Claims Data" (2012). Electronic Theses and Dissertations. 211.
https://egrove.olemiss.edu/etd/211
DEVELOPMENT AND COMPARATIVE PREDICTIVE VALIDITY OF AN OUTPATIENT MEDICATION EXPOSURE MEASURE FOR RISK ADJUSTMENT USING
RETROSPECTIVE CLAIMS DATA
A dissertation presented in partial fulfillment of requirements for the degree of
Doctor of Philosophy in Pharmaceutical Sciences in the Department of Pharmacy Administration
The University of Mississippi
by
KYLE DENNIS NULL
ABSTRACT
Background
The purpose of this study was to develop and test a measure of outpatient prescription utilization (medication exposure measure, or MEM) that may be coupled with the CMS-HCC and CMS-RxHCC methodologies to improve risk-adjusted payments to Medicare Part C and Part D plans. Studies have identified prescription measures that predict future expenditures; however, many are easily manipulable by health plans or practitioners, thus limiting their utility as risk-adjusters. The addition of a non-manipulable prescription utilization measure to existing risk-adjustment models may improve prediction, reducing adverse risk selection incentives by health plans. A secondary objective of this study was to evaluate the utility of adding prescription measures to the Charlson’s Comorbidity Index, Elixhauser’s Index, and RxRisk to predict year-2 expenditures, hospitalization counts, emergency department visits, and mortality.
Study Design
The study design utilized a retrospective cohort from the 5% Medicare national sample, which used year-1 (2007) inputs to predict the year-2 (2008) economic and clinical outcomes. The sample included beneficiaries with continuous enrollment in fee-for-service Medicare Parts A, B, and D for a minimum of 12 months in the base year and a minimum of 1 month in year-2. An interaction between the end-of-year Medicare Part D benefit phase and the prescription measures
was included to account for the influence of the coverage gap (i.e., “donut hole”) on the prescription measures.
Results
Overall, the addition of the prescription-based measures to risk-adjustment models resulted in enhanced predictive validity for the economic and clinical outcomes tested compared to the risk-adjustment model alone. The addition of any prescription measure to the risk-adjustment models did not meaningfully improve model performance in predicting year-2 medical expenditures; however, the prescription measures, particularly the MEM, markedly improved prediction of year-2 pharmacy expenditures.
Conclusions
Although adding MEM to the HCC models used to predict medical expenditures does not appear to be a useful method of enhancing risk-adjusted payments, the MEM performed particularly well with the RxHCC predicting year-2 pharmacy expenditures. Incorporating the MEM into Medicare Part D risk-adjustment models (i.e., with RxHCC) would improve risk-adjusted capitated payments from both the perspectives of CMS and the health plans.
DEDICATION
This dissertation is dedicated to my friends and family who have supported me in all of my academic and personal endeavors.
ACKNOWLEDGMENTS
This dissertation would not have been possible without the help of many people. First, I would like to thank my dissertation committee members, Dr. Jeff Hallam, Dr. Donna West-Strum, and Dr. Yi Yang. Most of all, I would like to thank my committee chair, Dr. John Bentley. I would also like to thank Dr. Ben Banahan for his assistance in submitting the data use agreement and for this consults on using Medicare data and Dr. Vennela Thumula for her gratuitous statistics consults.
Most importantly, I would like to thank my family - my dad, Dennis Ray Null, my mom, Gloria Watkins Null, my sister, Apryl Renée Null, and my maternal grandmother, DeLoris “Mimi” Watkins - who never faltered in their support. I could have never pursued graduate education without the support of my wife, Brandy Dawn Null – thank you for letting me do this! Finally, I would like to acknowledge my twin boys, Paxton Kyle and Dylan Cade. Although, they arguably slowed me down while finishing my dissertation, I know that this endeavor will positively impact their lives for years to come.
The work reported was conducted under Centers for Medicare and Medicaid Services (CMS) data use agreement (DUA) number 22762. The views expressed are those of the authors and do not necessarily reflect those of CMS or the University of Mississippi.
TABLE OF CONTENTS
ABSTRACT ... ii
DEDICATION ... iv
ACKNOWLEDGMENTS ...v
LIST OF TABLES ... xiv
LIST OF FIGURES ... xviii
LIST OF EQUATIONS ... xix
CHAPTER I - INTRODUCTION ...1
Background ...1
Medicare Prospective Payment System ... 1
Diagnosis-Based Input Models ... 2
Pharmacy-Based Input Models ... 3
Incorporating Prior Costs and Healthcare Utilization ...4
Prescription-based Count Measures ... 5
Operational Criteria for Evaluating Risk-Adjustment Methods ... 5
Statement of Problem ...6
Conceptual Framework ...7
Study Aims and Research Questions ...8 Specific Aim 1 ... 9 Specific Aim 2 ... 9 Specific Aim 3 ... 10 Study Significance...11 Limitations ...12
CHAPTER II - LITERATURE REVIEW AND CONCEPTUALIZATION ...13
Overview ...13
Risk-adjustment Models ...13
Risk of What? ...14
Resource Distribution ...15
Analyses of Risk-adjustment Models ...16
Regression ... 16
Predictive Ratio ... 18
Evolution of Risk-adjustment Models Used by CMS ...20
Average Adjusted Per Capita Costs (AAPCC) ... 20
Functional Status and Objective Health Measures ... 23
Diagnostic Cost Groups (DCG) ... 23
Principal Inpatient Diagnostic Cost Group Model (PIP-DCG) ... 25
Diagnostic Cost Group/Hierarchical Condition Category Model (DCG/HCC) ... 25
CMS-Hierarchical Condition Category (CMS-HCC) ... 27
CMS-RxHCC... 27
Non-CMS Diagnosis-Based Risk Adjusters ...28
Diagnosis-Based Measures ... 28
Pharmacy-Based Measures ... 29
Comparison Studies ... 31
Simple Resource Counts ...32
Development of the Medication Exposure Measure ...34
Medication Exposure is Related to Health Outcomes ... 34
Extending the Simultaneous Polypharmacy Measure ... 36
Medication Exposure is Not an Adherence Estimate ... 39
Value of the Medication Exposure Measure ... 39
Study Design ...41
Data Source ...41
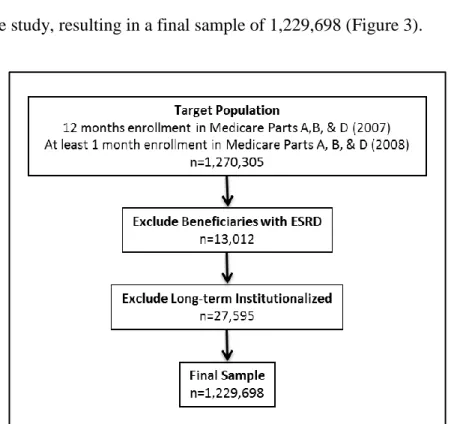
Sample Selection ...42
SPECIFIC AIM 1 – THE MEDICATION EXPOSURE MEASURE ...43
Measures...43
Medication Exposure Measure ... 43
Unique Drug Count ... 44
Simple Prescription Count ... 44
Statistical Analysis ...45
SPECIFIC AIMS 2 & 3 – MEDICATION EXPOSURE MEASURE AS A RISK ADJUSTER .46 Independent Variable Measures ...46
Medication Exposure, Unique Drug, and Simple Prescription Count ... 46
Demographic Variables ... 46
Hierarchical Condition Categories (HCCs) and RxHCCs ... 47
Charlson’s Comorbidity Index (CCI) ... 48
Elixhauser’s Index ... 49
RxRisk-V ... 49
Expenditures ... 49
Clinical Outcomes ... 52
Model Testing ...52
Statistical Analysis ...54
CHAPTER IV – DATA ANALYSIS AND RESULTS ...56
Sample Description ...56
SPECIFIC AIM 1 – MEDICATION EXPOSURE MEASURE...61
Prescription Fill-based Measures ...61
Relationship between the Prescription Measures ...65
Medication Exposure and Unique Drug Count ... 66
Medication Exposure and Simple Prescription Count ... 67
SPECIFIC AIM 2 - CMS RISK-ADJUSTMENT MODELS ...68
Hierarchical Condition Category (HCC) Model ...68
Expenditures ... 68
Influence of Part D Benefit Phase ... 70
HCC + MEM Model Performance ... 72
Hospitalizations ... 76
Mortality ... 85
Rx Hierarchical Condition Category (RxHCC) Model ...87
Expenditures ... 87
Influence of Part D Benefit Phase ... 89
Hospitalizations ... 94
Emergency Department Visits ... 98
Mortality ... 102
SPECIFIC AIM 3 – NON-CMS RISK-ADJUSTMENT MODELS ...104
Charlson Comorbidity Index (CCI) ...104
Expenditures ... 106
Hospitalizations ... 107
Emergency Department Visits ... 110
Mortality ... 113
Elixhauser Index ...115
Expenditures ... 116
Hospitalizations ... 117
Mortality ... 125
RxRisk ...127
Expenditures ... 128
Hospitalizations ... 129
Emergency Department Visits ... 133
Mortality ... 137
CHAPTER V - SUMMARY AND CONCLUSIONS ...139
SPECIFIC AIM 1 – MEDICATION EXPOSURE MEASURE...139
Major Findings ...139
SPECIFIC AIM 2 – CMS RISK-ADJUSTMENT MODELS ...140
Major Findings ...140
Expenditure Outcomes ... 140
Clinical Outcomes ... 141
SPECIFIC AIM 3 – NON-CMS RISK-ADJUSTMENT MODELS ...142
Major Findings ...142
Expenditure Outcomes ... 142
Clinical Outcomes ... 143
Study Limitations ...145
Future Research ...148
Conclusions ...150
LIST OF REFERENCES ...151
APPENDICES ...169
APPENDIX A – CMS PROVIDER CODE LIST ...170
LIST OF TABLES
Table 1 – Common Outcomes Predicted by Risk-adjustment models ... 14
Table 2 – Abridged Legislative History of CMS Risk-Adjustment Methodologies ... 21
Table 3 – HCC/RxHCC Age/Sex Groups ... 47
Table 4 – Models tested in the study ... 54
Table 5 – Final Sample Descriptive Statistics (n=1,229,698) ... 58
Table 6 – Descriptive Statistics for Outcome Variables Used in the Study ... 59
Table 7 – Benefit Phase Groupings with PDE File Variable Descriptions ... 62
Table 8 – Descriptive statistics for prescription-based measures by Part D benefit phase ... 64
Table 9 – Medication exposure measure and prescription-based descriptive statistics ... 64
Table 10 – Pearson Product-Moment Correlation Coefficients for Prescription Measures ... 65
Table 11 – Model R2 for AAPCC and HCC Models with Expenditures as DV ... 69
Table 12 – Model R2 for the AAPCC and HCC models with Benefit Phase Interaction ... 71
Table 13 – Predictive ratios for HCC + MEM model (Ordinary Least Squares Model) ... 73
Table 14 – Predictive ratios for HCC + MEM model (GzLM Gamma Distributed Model) ... 73
Table 15 – Frequency Distrubtion of Hospitalizations (2008) ... 76
Table 16 – HCC+Unique Drug Count Model Predicting Hospitalization Counts ... 77
Table 17 – HCC+Rx Count Model Predicting Hospitalization Counts ... 78
Table 18 – HCC+MEM Model Predicting Hospitalization Counts ... 78
Table 20 – Frequency Distrubtion of Emergency Department Visits (2008) ... 81
Table 21 – HCC+Unique Drug Count Model Predicting Emergency Department Counts ... 82
Table 22 – HCC+Rx Count Model Predicting Emergency Department Counts ... 83
Table 23 – HCC+MEM Model Predicting Emergency Department Counts ... 83
Table 24 – HCC-based emergency department visit count model summary ... 84
Table 25 – HCC Models Predicting Year-2 Mortality ... 85
Table 26 – Odds Ratio and Parameter Estimates for HCC Models Predicting Year-2 Mortality 86 Table 27 – Model R2 for AAPCC and RxHCC Models with Expenditures as DV ... 88
Table 28 – Model R2 for the AAPCC and RxHCC models with Benefit Phase Interaction ... 90
Table 29 – Predictive ratios for RxHCC + MEM model (with Benefit Phase Interaction) ... 91
Table 30 – RxHCC+Unique Drug Count Model Predicting Hospitalization Counts ... 94
Table 31 – RxHCC+Rx Count Model Predicting Hospitalization Counts ... 95
Table 32 – RxHCC+MEM Model Predicting Hospitalization Counts ... 95
Table 33 – RxHCC-based hospitalization count model summary ... 96
Table 34 – RxHCC+Unique Drug Count Model Predicting Emergency Department Counts ... 99
Table 35 – RxHCC+Rx Count Model Predicting Emergency Department Counts ... 99
Table 36 – RxHCC+MEM Model Predicting Emergency Department Counts ... 100
Table 37 – RxHCC-based emergency department visit count model summary ... 100
Table 39 – Odds Ratio and Parameter Estimates for RxHCC Models Predicting Year-2 Mortality
... 103
Table 40 – Charlson Comorbidity Index Descriptive Statistics ... 105
Table 41 – Charlson Comorbidity Index Model Summary (Expenditures) ... 106
Table 42 – CCI+Unique Drug Count Model Predicting Hospitalization Counts ... 107
Table 43 – CCI+Rx Count Model Predicting Hospitalization Counts ... 108
Table 44 – CCI+MEM Model Predicting Hospitalization Counts ... 108
Table 45 – CCI-based hospitalization count model summary ... 109
Table 46 – CCI+Unique Drug Count Model Predicting Emergency Department Counts ... 110
Table 47 – CCI+Rx Count Model Predicting Emergency Department Counts ... 111
Table 48 – CCI+MEM Model Predicting Emergency Department Counts... 111
Table 49 –CCI-based emergency department visit count model summary ... 112
Table 50 – Charlson Comorbidity Index Model Predicting Year-2 Mortality ... 113
Table 51 – Odds Ratio and Parameter Estimates for CCI Models Predicting Year-2 Mortality 114 Table 52 – Elixhauser Index Distribution ... 115
Table 53 – Elixhauser Index Model Summary (Expenditures) ... 116
Table 54 – ELIX+Unique Drug Count Model Predicting Hospitalization Counts... 117
Table 55 – ELIX+Rx Count Model Predicting Hospitalization Counts ... 118
Table 56 – ELIX+MEM Model Predicting Hospitalization Counts ... 118
Table 58 – ELIX+Unique Drug Count Model Predicting Emergency Department Counts ... 121
Table 59 – ELIX+Rx Count Model Predicting Emergency Department Counts ... 122
Table 60 – ELIX+MEM Model Predicting Emergency Department Counts ... 122
Table 61 – Elixhauser-based emergency department visit count model summary ... 123
Table 62 – Elixhauser Index Model Predicting Year-2 Mortality ... 125
Table 63 – Odds Ratio and Parameter Estimates for Elixhauser Models (Year-2 Mortality) .... 126
Table 64 – RxRisk Score Distribution ... 127
Table 65 – RxRisk Model Summary (Expenditures) ... 128
Table 66 – RxRisk+Unique Drug Count Model Predicting Hospitalization Counts ... 129
Table 67 – RxRisk+Rx Count Model Predicting Hospitalization Counts ... 130
Table 68 – RxRisk+MEM Model Predicting Hospitalization Counts ... 130
Table 69 – RxRisk-based hospitalization count model summary ... 131
Table 70 – RxRisk+Unique Drug Count Model Predicting Emergency Department Counts .... 134
Table 71 – RxRisk+Rx Count Model Predicting Emergency Department Counts ... 134
Table 72 – RxRisk+MEM Model Predicting Emergency Department Counts ... 135
Table 73 – RxRisk-based emergency department visit count model summary ... 135
Table 74 – RxRisk Model Predicting Year-2 Mortality ... 137
Table 75 – Odds Ratio and Parameter Estimates for RxRisk Models Predicting Year-2 Mortality ... 138
LIST OF FIGURES
Figure 1 – Medication Exposure Explanation ... 35
Figure 2 – Project Study Period ... 41
Figure 3 – Sample selection ... 56
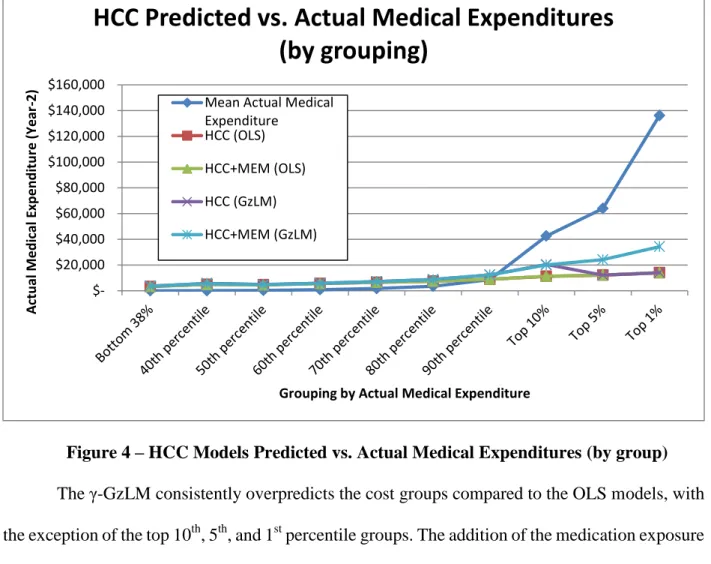
Figure 4 – HCC Models Predicted vs. Actual Medical Expenditures (by group) ... 74
Figure 5 – HCC Predicted vs. Actual Medical Expenditures ... 75
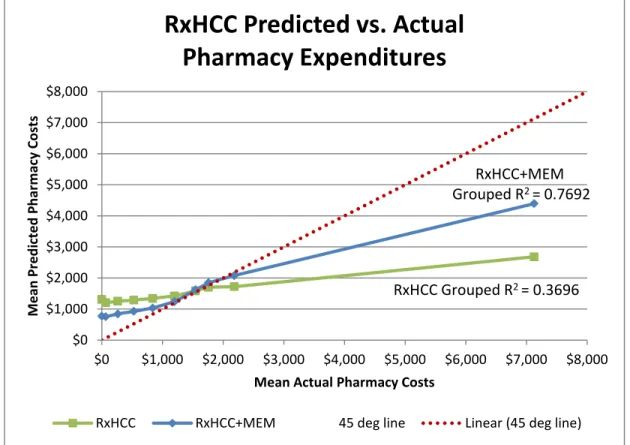
Figure 6 – RxHCC Model Predicted vs. Actual Pharmacy Expenditures (by grouping) ... 92
LIST OF EQUATIONS
Equation 1 – Grouped R2 ... 17
Equation 2 – Adjusted R2 ... 18
Equation 3 – Predictive Ratio ... 18
Equation 4 – Medication Exposure ... 37
Equation 5 – Average Medication Exposure ... 37
Equation 6 – MedPAR Payment ... 50
Equation 7 – Pharmacy Plan Payment ... 50
Equation 8 – Annualized Expenditure ... 51
CHAPTER I - INTRODUCTION
Background
Medicare Prospective Payment System
When Medicare was established in 1965, hospital payments were based on “fee-for-service” reimbursements modeled after the private health insurance sector’s “retrospective cost-based reimbursement” payment methodology (Office of Inspector General, 2001). Because reimbursements were directly related to the services performed, this reimbursement method left little reason for hospitals to control costs. To help curtail the growing cost of the Medicare hospital benefit (Medicare Part A), Congress enacted The Social Security Amendments of 1983, which created the first prospective payment system in which hospitals would receive a prospective payment based on a risk adjustment process which grouped medical services into diagnosis-related groups (DRGs) (Fetter, 1991). This allowed Medicare to adjust payments based on the patient’s condition while incentivizing the hospital to become more cost effective.
In 1982, Congress passed the Tax Equity and Fiscal Responsibility Act (TEFRA), which allowed for demonstration projects involving risk contracts with full prospective payments to health maintenance organizations (HMOs) (Ash, Porell, Gruenberg, Sawitz, & Beiser, Adjusting Medicare capitation payments using prior hospitalization data, 1989). The TEFRA Medicare
HMO demonstration projects laid the foundation for the creation of Medicare+Choice (Medicare Part C) by the Balanced Budget Act of 1997. The original Medicare+Choice set capitated payments at 95 percent of an enrollee’s county’s adjusted average per capita cost (AAPCC) based on fee-for-service (FFS) expenditures by geographic area and adjusted for age, gender, welfare status, and institutional status (Pope et al., 2004). A major limitation of the AAPCC formula was the inability to adjust capitated payments to account for differences in health status of enrolled members, and as a result, health plans disproportionately sought out healthier individuals in the years following the implementation of the AAPCC payment methodology (Thomas, Lichtenstein, & Wyszewianski, 1986). New payment methodologies that accounted for differences in health status were implemented by the Centers for Medicare and Medicaid Services (CMS) to incentivize Medicare+Choice plans to enroll sicker beneficiaries. These enhanced payment methodologies used diagnostic data to categorize individuals based on their health conditions and some models also provided estimates of disease severity. Risk-adjustment models using demographic information in combination with year-1 diagnostic data have been found to predict year-2 costs better than demographic models alone (Ash, Porell, Gruenberg, Sawitz, & Beiser, Adjusting Medicare capitation payments using prior hospitalization data, 1989).
Diagnosis-Based Input Models
The conceptual justification for including diagnoses in risk-adjustment methods is that certain diagnoses are associated with predictable higher levels of health care needs and ultimately, higher expenses (Ellis & Ash, 1995/96). Diagnosis-based inputs for risk-adjustment models often include the basic information included in the demographic-based models, but as the name implies they also incorporate diagnosis-based information. Examples of diagnosis-based models include
adjusted clinical groups (ACG), ambulatory diagnostic groups (ADG), Charlson’s comorbidity index (CCI), diagnostic cost groups (DCG), diagnosis-related groups (DRG), Elixhauser’s index, and diagnostic cost group-hierarchical condition category (DCG-HCC) models (Pope et al., 2004). The commonality among diagnosis-based models is that they all use International Classification of Diseases, 9th Revision, Clinical Modification (ICD-9-CM) codes as the basis for inferring diagnoses, with the main differences between the methodologies being the approach for disease groupings and the conditions which are selected for model inclusion (Greenwald, 2000). DCG-HCC-based models are generally considered to be the most accurate of the risk-adjustment models at predicting year-2 medical costs and mortality (Pope, Adamache, Walsh, & Khandker, 1998; Rosen et al., 2001; Sales et al., 2003; Li, Kim, & Doshi, 2010). An amended DCG-HCC model, referred to as CMS-HCC, has been used by Medicare since 2004 to calculate risk-adjustment payments to Medicare Advantage plans (Pope et al., 2011). Predecessors to the DCG-HCC model have been used by CMS since 2000 (Ash et al., 2000; Pope et al., 2000a). Since the implementation of Medicare Part D in 2006, CMS has used another diagnosis-based model based on the DCG-HCC model to risk adjust capitated payments to Medicare Part D plans. This model, called CMS-RxHCC, uses diagnoses that are predictive of drug expenditures (Robst, Levy, & Ingber, 2007).
Pharmacy-Based Input Models
Risk-adjustment models that use pharmacy-based inputs infer a disease state or condition from prescription claims to predict future outcomes or expenditures. There are several benefits to utilizing pharmacy data to calculate risk-adjustment scores. Compared to diagnostic claims data, pharmacy claims are often more readily available, more timely, and more complete than diagnostic
data (Von Korff, Wagner, & Saunders, 1992). Initial work on the Chronic Disease Score (CDS) pharmacy-based risk-adjustment model by Von Korff et al. (1992) served as the foundation for several other risk-adjustment models using pharmacy-based inputs, including MedicaidRx and RxRisk (Gilmer, Kronick, Fishman, & Ganiats, 2001; Fishman, Goodman, Hornbrook, Meenan, Bachman, & O'Keeffe Rosetti, 2003). Inferring conditions from prescription claims presents some problems with pharmacy-based inputs compared to diagnosis-based inputs. Some drugs may be used for multiple conditions or may not be linked to a condition at all, leading to misclassifications or the inability to classify patients into a condition category. Several studies have found evidence to suggest that models using year-1 diagnostic and pharmacy data predict year-2 drug costs better than diagnostic data alone, possibly because of the enhanced ability to assign conditions using both diagnostic- and pharmacy-based inputs (Schneeweiss et al., 2001; Zhao et al., 2005).
Incorporating Prior Costs and Healthcare Utilization
A study conducted by the Society of Actuaries found that adding prior costs as an independent variable to risk-adjustment models used for underwriting, not for prospective payment, significantly increased the predictive accuracy of the models (Winkelman & Mehmud, 2007). While prior costs predict future expenditures, they are not included in risk adjustment used for prospective payment because of the potential for manipulation from health plans (Ash, Zhao, Ellis, & Kramer, 2001; Zhao, Ash, Haughton, & McMillan, 2003).
Simple counts of health care utilization, including counts of physician visits, hospital claims, and unique prescriptions, have also been found to improve the predictive validity of risk-adjustment models when coupled with common risk adjusters (Farley, Harley, & Devine, 2006; Perkins, et al., 2004; Schneeweiss, Seeger, Maclure, Wang, Avorn, & Glynn, 2001). Farley
et al. (2006) posit that the addition of simple counts to comorbidity measures, including prescription counts, more accurately account for disease severity by capturing the intensity of resource utilization. Another potential explanation is that simple prescription counts add a unique dimension of medication utilization to a diagnosis-based risk adjuster, thus improving the predictive ability of the measures when the two are used in concert.
Prescription-based Count Measures
Farley et al. (2006) defined unique prescription count as the number of unique prescription classes filled in a one-year period. The count of unique prescriptions over the course of one year outperformed simple prescription count, physician visit count, and hospitalization count in predicting year-2 expenditures, with diagnosis cluster count being the only count variable to perform better (Farley, Harley, & Devine, 2006). A study that used the number of distinct prescription drugs (distinct chemical entities) found that it was the best predictor of future physician visits and expenditures compared to several diagnosis- and pharmacy-based variables (Schneeweiss et al., 2001). Perkins et al. (2004) found that a count of the number of prescription subclasses had similar predictive ability compared to prescription count, and was a better predictor of future expenditures compared to several diagnosis- and pharmacy-based risk adjusters. Prescription-based count measures are a useful addition to models predicting future healthcare utilization; however, they have not been incorporated into current capitated payment risk-adjustment models.
Operational Criteria for Evaluating Risk-Adjustment Methods
While prior costs and utilization add predictive validity to risk-adjustment models, these measures have not been included in risk-adjusted payment models. This is partly due to the ability
of health plans and providers to manipulate current costs and utilization in an effort to increase future prospective payments. In 1994, the General Accounting Office, now called the Government Accountability Office (GAO), identified a set of operational criteria for evaluating risk-adjustment methods, noting that a good risk-adjustment method would:
1. be able to predict health care costs with accuracy, 2. treat participating HMOs reasonably and fairly,
3. be difficult for participating health plans to manipulate, 4. respect patient privacy and confidentiality,
5. create incentives for appropriate care, and
6. be feasible and inexpensive to administer (U.S. GAO, 1994a).
Given these guidelines, developing an intractable, claims-based measure to augment current diagnosis- and pharmacy-based input models, while also capturing resource intensity in the same manner as the previously described simple count measures, would be ideal. A measure that approximates medication utilization, which is dependent on both prescribing behavior and patient medication consumption behavior, would be less susceptible to manipulation (i.e., unlike unique prescription count) and could create incentives for appropriate care through medication management.
Statement of Problem
Risk-adjustment models and comorbidity measures in health research use diagnosis- and pharmacy-based inputs to arrive at a health condition attributed to individuals in the population. Medication utilization has not been routinely incorporated into these models, even for pharmacy
benefit-based prospective payment calculations (i.e., CMS payments to Medicare Part D plans) where such inclusion would seem sensible. Measures similar to unique drug count, defined here as the number of unique chemical entities captured in an administrative claims database over a given time period, have been found to improve the predictive ability of common risk adjusters. While unique prescription counts provide some estimate of medication use or resource utilization, they are an imprecise global measure, often misestimating true medication exposure. Little work has been conducted using administrative claims data to develop and refine a medication utilization measure. This study seeks to develop and test a novel measure that will conceptually reflect medication exposure better than prescription counts. As a corollary, the medication exposure measure should outperform prescription counts in predicting clinical and economic outcomes when coupled with select risk-adjustment measures.
Conceptual Framework
Study Purpose
The primary purpose of this study is to develop and test a measure of outpatient medication exposure, which may be used to risk-adjust Medicare payments to health and pharmacy plan participants. The medication exposure measure: 1) will better reflect medication exposure compared to current methods, 2) should outperform other prescription-based count measures in the prediction of health and economic outcomes, 3) will be reasonably straightforward to calculate, and 4) will not be easily manipulable by health plans or practitioners.
The specific objectives of this study were to develop and describe a global measure of medication exposure using administrative claims data and to test the predictive validity of this
measure when coupled with diagnosis- and pharmacy-based risk-adjustment measures. While the primary purpose of this study is to test a medication exposure measure with Medicare payment risk adjusters (CMS-HCC and CMS-RxHCC), relevant comorbidity estimates common in the literature, including Charlson’s Comorbidity Index, Elixhauser’s Index and RxRisk, will be included because of the potential interest of a medication exposure measure to researchers utilizing these comorbidity estimates. Risk adjusters were selected for this study based on their prevalence in the literature, on the expected influence that the medication exposure measure would have on the predicted outcomes, and on the availability of code and required variables to calculate the risk adjuster. This study will provide information to better understand the utility of this measure on predicting health and economic outcomes.
Study Aims and Research Questions
The specific aims of this study were designed to: 1) examine the relationship between the outpatient medication exposure measure and the prescription-based count measures unique drug count and simple prescription count, 2) examine the predictive validity of the medication exposure measure when coupled with CMS risk-adjustment models (i.e., CMS-HCC and CMS-RxHCC), and 3) examine the predictive validity of the medication exposure measure when coupled with non-CMS diagnosis-based (i.e., Charlson’s Comorbidity and Elixhauser Indices) and pharmacy-based risk-adjustment models (i.e., RxRisk).
The central hypothesis is that the outpatient medication exposure measure will be distinct from a unique drug count and a simple prescription count measure and when added to diagnosis- and pharmacy-based risk adjusters, the combined model will explain more variance and will more accurately predict health and economic outcomes compared to diagnosis- and pharmacy-based
risk-adjustment measures alone. This central hypothesis is based on evidence in the extant literature that suggests the addition of simple count variables, such as unique drug and conventional prescription counts, to risk-adjustment models result in enhanced predictive validity and variance explanation compared to the risk-adjustment model alone (Farley, Harley, & Devine, 2006; Perkins, et al., 2004; Schneeweiss, Seeger, Maclure, Wang, Avorn, & Glynn, 2001). It is also based on the observation that prescription count-based measures often misestimate actual medication exposure. The basis for the proposed research is to provide insight to health plan risk-adjustment procedures as well as to provide a medication utilization-based covariate for health outcomes researchers.
Specific Aim 1
The objective of specific aim 1 is to develop an outpatient medication exposure measure using retrospective administrative claims data and to compare this measure to prescription-based count measures, including a count of unique drugs and a simple prescription count calculated for the same individual.
Research Question 1: What is the relationship between the medication exposure measure and the prescription-based count measures, unique drug count and simple prescription count?
Specific Aim 2
The objective for specific aim 2 is to evaluate the predictive validity of the outpatient medication exposure measure for health and economic outcomes compared to unique drug count and simple prescription count for Medicare risk-adjustment models. Comparisons will be made
between the medication exposure measure and the other prescription count measures when coupled with the CMS-HCC and CMS-RxHCC models.
Research Question 2: Will the outpatient medication exposure measure provide better predictive validity of health and economic outcomes compared to the prescription-based count measures, unique drug count and simple prescription count, when combined with the CMS-HCC model?
Research Question 3: Will the outpatient medication exposure measure provide better predictive validity of health and economic outcomes compared to the prescription-based count measures, unique drug count and simple prescription count, when combined with the CMS-RxHCC model?
Specific Aim 3
The objective for specific aim 3 is to evaluate the predictive validity of the outpatient medication exposure measure on health and economic outcomes compared to the prescription-based count measures, unique drug count and simple prescription count, on non-CMS risk-adjustment models. Comparisons will be made between the medication exposure measure and the prescription-based count measures when coupled with the diagnosis-based risk adjusters, Charlson’s Comorbidity and Elixhauser’s Index, and with the pharmacy-based risk adjuster, RxRisk.
Research Question 4: Will the outpatient medication exposure measure provide better predictive validity of health and economic outcomes compared to the prescription-based count measures, unique drug count and simple prescription count, when combined with the Charlson Comorbidity Index risk-adjustment model?
Research Question 5: Will the outpatient medication exposure measure provide better predictive validity of health and economic outcomes compared to the prescription-based count measures, unique drug count and simple prescription count, when combined with the .Elixhauser Index risk-adjustment model?
Research Question 6: Will the outpatient medication exposure measure provide better predictive validity of health and economic outcomes compared to the prescription-based count measures, unique drug count and simple prescription count, when combined with the RxRisk risk-adjustment model?
Study Significance
The results of this study may be used to enhance risk adjustment for payment models and for researchers to use in studies requiring risk-adjusted estimates of some health or economic outcome.
Limitations
All conditions included in the risk-adjustment models tested do not warrant drug treatment, so adding a measure of medication exposure will not contribute to the predictive validity of those diseases. By design, the disease categories selected for the CMS-RxHCC model should include more diseases that warrant drug therapy compared to the CMS-HCC model. The medication exposure measure only includes outpatient drugs which are submitted to Medicare Part D plans for reimbursement, and does not include J-code billed drugs or drugs received during inpatient hospital stays.
CHAPTER II - LITERATURE REVIEW AND CONCEPTUALIZATION
Overview
This chapter will provide an overview of the risk-adjustment literature, including methods used to adjust capitated payments and those used as comorbidity estimates or covariates in research studies. Statistical analysis unique to the risk-adjustment for capitated payments literature will be contrasted with methods common in the research literature. The risk-adjustment literature overview will contain both diagnosis- and pharmacy-based input models, as well as a review of the resource utilization-based predictors that have been studied in risk-adjustment models. A cursory discussion of laws and regulations affecting risk-adjusted payments will be included when relevant. Finally, the chapter will conclude with the conceptualization of the medication exposure measure.
Risk-adjustment Models
There are three basic sources of inputs for the risk-adjustment models discussed in this manuscript: 1) demographic-based inputs including variables like gender and age, 2) diagnosis-based inputs using codes from medical records that are mapped to diagnostic categories, and 3) pharmacy claims-based inputs using prescription claim data mapped to diagnostic categories. Common outcomes predicted by risk-adjustment models are outlined in Table 1.
Table 1 – Common Outcomes Predicted by Risk-adjustment models
Costs Clinical
Prescription Hospitalizations
Medical Emergency Department Visits
Total Costs Mortality
Risk adjustment can occur retrospectively, concurrently, or prospectively. Prospective risk-adjustment models are used to calculate capitated payments to health plans, whereas retrospective models may be estimated to adjust previous payments or in the context of reinsurance (U.S. GAO, 1994b). Concurrent models are useful for provider profiling and interventions orchestrated by the health plan and typically have more predictive power compared to prospective risk-adjustment models (Cucciare & O'Donohue, 2006; Ash et al., 2000).
Risk of What?
From the perspective of adjusting capitated payments, risk adjustment has been defined as “the process of adjusting health plan payments, health care provider payments and individual or group premiums to reflect the health status of the plan members” (Cumming, Knutson, Cameron, & Derrick, 2002; Winkelman & Mehmud, 2007). However, not all risk-adjustment models are used to adjust capitated payments. Risk adjustment is also used to account for patient-related factors when examining outcomes of medical care (Iezzoni, 2003). Other terms to describe this same concept include case-mix adjustment, comorbidity estimation, and severity of illness, among others (Greenwald, 2000; Duncan, 2011). Deciding on a proper definition of risk adjustment is largely dependent on perspective. Health plans are primarily concerned with financial loss, whereas clinicians and patients are more concerned with clinical loss, such as a decrease in functional status (Duncan, 2011). The perspective of this study is that of a researcher, who may be
concerned with predicting both financial and clinical loss. As such, the term “risk adjustment” will be used throughout this manuscript regardless of the perspective or outcome of interest.
Resource Distribution
Many researchers reference the “Pareto Principle” or “80/20 Rule” when describing how resources are utilized or distributed throughout a population (Institute of Medicine, 2002). Analysis of healthcare spending has found a similar, “Pareto-like” principle in effect. A study conducted by Berk & Monheit (2001) reported the distribution of United States health expenditures has remained relatively static since as early as the 1960s; with the top 10 percent of individual expenditures accounting for 60 to 70 percent of total expenditures and the top 30 percent accounting for about 90 percent of total expenditures. Another study found that 30% of a company’s employees accounted for 80% of their medical spending; with the mean cost for 70% of the company’s employees was $901, whereas the average cost for the total study sample was $3,150. (Rula, Hobgood, Hamlet, Zeng, & Montijo, 2009). This type of expense distribution remains relatively static from year to year; however, most patients do not stay in the same “bracket” for consecutive years. In a study of a large employee group, researchers found that the high-cost bracket consisted of 73% to 83% “first-timers” and only 12% to 18% of those individuals remained in the high-cost bracket the next year (Lynch & Gardner, 2009). In fact, less than 1% of the total study sample remained in the high-cost bracket for two or more consecutive years (Lynch & Gardner, 2009). Ash et al. (2001) had a similar finding when using year-1 costs and diagnostic information to predict year-2 expenditure group membership. Patient flow between expense brackets is dynamic because high-cost events are episodic (Rula, Hobgood, Hamlet, Zeng, & Montijo, 2009). In a disease-specific sample, about 30% of individuals with diabetes were
re-hospitalized over a one-year period; however, these individuals accounted for more than 50% of all diabetes-related hospital expenses (Agency for Healthcare Research and Quality, 2005). Individuals with repeat, same year hospitalizations cost nearly three times as much as individuals with a single hospital stay ($23,100 vs. $8,500) (Jiang, Stryer, Friedman, & Andrews, 2003). The dynamic nature of individual health expenditures highlights the importance of building models to accurately predict future healthcare expenditures at the group level.
Analyses of Risk-adjustment Models
Risk-adjusted models for capitated payments are typically estimated as ordinary least squares (OLS) regression models, which predict total health care expenditures for an individual over a given time period (usually one year) using a number of demographic and diagnosis-related variables (Axelrod & Vogel, 2003; Iezzoni, 2003). The purpose of these models is to predict next-year costs for managed care organizations or to aid in forecasting capitated payments. The performance of risk-adjusted models is typically assessed using the R-square statistic and the predictive ratio (Iezzoni, 2003; Pope et al., 2004; Cucciare & O'Donohue, 2006).
Regression
The R-square statistic represents the proportion of variance in the dependent variable explained by the variables included in the model. Several approaches have been suggested to selecting an appropriate R-square based on the study purpose. The R-square from OLS regression has been used frequently in reporting the variance explained in risk-adjustment models; however, several authors have questioned whether it is appropriate for risk-adjustment models (Ash, Porell, Gruenberg, Sawitz, & Beiser, Adjusting Medicare capitation payments using prior hospitalization data, 1989; Ash & Byrne-Logan, 1998; Iezzoni, 2003). The criticism is based on the way that
R-square from OLS regression is calculated, with the error from each individual’s expected and observed costs contributing to the error term of the model. Because individual prediction of healthcare expenses is fraught with error and the level of granularity that individual predictions offer is often unnecessary for risk-adjusted payment models, some authors have suggested the use of grouped R2 as an alternative (Ash, Porell, Gruenberg, Sawitz, & Beiser, Adjusting Medicare
capitation payments using prior hospitalization data, 1989; Ash & Byrne-Logan, 1998; Iezzoni, 2003). The error for grouped R2 is based on the difference between the expected and observed
costs for predetermined groups. The formula for grouped R2 is (Ash, McCall, Fonda, Hanchate, &
Speckman, November 2005): Equation 1 – Grouped R2 ( ) ( ) ∑ ( ̂) ∑ ( ̅) Where:
b = 1,2,…,B are partitions in the sample
= weight for each partition b (determined by partition size) = the mean of actual costs for each partition b
̂ = the mean of predicted costs for each partition b
̅ = the mean for the entire sample
A final model summary statistic that has been suggested is the adjusted R2 (U.S. GAO,
1994b; Duncan, 2011). The adjusted R2 protects against model over-fitting and allows for
comparisons to be made between models with different numbers of predictor variables by normalizing R2 with degrees of freedom (Duncan, 2011). The formula for adjusted R2 is:
Equation 2 – Adjusted R2
( )
Where:
N = the number of observations, and
k = is the number of parameters in the model
Selecting the “most appropriate” statistic to measure a model’s predictive power largely depends on the research question. Unfortunately, there are inconsistencies in the risk adjustment literature for which R2 statistic is reported, making meaningful comparisons across published
papers difficult.
Predictive Ratio
The predictive ratio, a ratio of the model predicted costs to the actual costs of the target population, is also used to examine the accuracy of a risk-adjustment model (Iezzoni, 2003; Cucciare & O'Donohue, 2006). A calculated predictive ratio equal to 1 would signify that the risk-adjusted model predicted costs perfectly. Accordingly, values less than 1 would mean that the model under-predicted costs and values over 1 would suggest the model overpredicted costs (Ash et al., 2000).
Equation 3 – Predictive Ratio
Demographic and diagnosis-based risk models perform well when calculated for large groups (i.e., not broken down into cost groups); however, the prediction of individual deciles is
relatively poor. These models typically overpredict costs for lower cost deciles and underpredict costs for higher cost deciles (Ash et al., 2000). When calculated across a population, the predictive ratios for diagnosis-based models typically range between 0.95 to1.05 (Ash et al., 2000). Thus, if a managed care organization covers a sufficiently large group of recipients whose health care utilization follows a normal distribution (based on costs), then the predictive ratio should be close to 1.
Evolution of Risk-adjustment Models Used by CMS
Average Adjusted Per Capita Costs (AAPCC)
Medicare has had HMO-type contractors in place since its implementation on July1, 1966. The predecessors to HMOs were essentially cost contractors, who were reimbursed on a cost-basis, similar to private health plans at the time. The HMO Act of 1973 introduced risk sharing and the concept of prospective payments. These prospective payments were based on the average adjusted per capita cost (AAPCC) methodology, which was further refined in 1982 when the Tax Equity and Fiscal Responsibility Act (TEFRA) was introduced. The TEFRA set prospective payments to health plans at 95 percent of the AAPCC. The AAPCC model is essentially a demographics-based risk-adjustment model, which includes age, gender, institutional status, and Medicaid status, with adjustments made for end-stage renal disease (ESRD) and for the disabled (Zarabozo, 2000). Table 2 provides an overview of relevant legislation that affects CMS risk-adjusted capitated payments to Medicare Advantage and Part D plans (Weissman, Wachterman, & Blumenthal, 2005).
Table 2 – Abridged Legislative History of CMS Risk-Adjustment Methodologies Related Legislation HCFA/CMS Implementation Risk Adjustment Methodology Original Research Author(s) Variance Explained (R2)† TEFRA 1982 1985 Adjusted Average per Capita Cost
(AAPCC) HCFA ≈ 0.5-2% BBA 1997 2000 Principal Inpatient Diagnostic Cost Group (PIP-DCG) (Pope et al., 2000b) ≈ 6% Diagnostic Cost Group/Hierarchical Condition Category (DCG/HCC) (Ash et al., 2000) ≈ 8-9% 2004 CMS-Hierarchical Condition Category (CMS-HCC) (Pope et al., 2004) ≈ 9% MMA 2003 2006 CMS-Rx Hierarchical Condition Category (CMS-RxHCC)
(Robst, Levy, &
Ingber, 2007) ≈ 12% † Variance explained using a Medicare sample
TEFRA 1982: Tax Equity and Fiscal Responsibility Act of 1982 BBA 1997: Balanced Budget Act of 1997
MMA 2003: Medicare Modernization Act of 2003
Age is a very common predictor of health outcomes and expenses because many conditions, and thus expenses through treatment, are a result of the aging process (Fisher, 1980; Meara, White, & Cutler, 2004). Also, age is unaffected by disease processes or treatments, which makes it an ideal, stable variable to include in research (Iezzoni, 2003). Gender is another common predictor of health outcomes due to biologic differences, but there may also be behavioral differences between males and females. There is evidence that women are more likely to perform health-protective behaviors compared to men, which might suggest that women place a greater
value on their health and may seek health services in a different manner than men (Felton, Parsons, & Bartoces, 1997; Liang, Shediac-Rizkellah, Celentano, & Rohde, 1999; Ungemack, 1994). One study found that age, sex, and race were predictors of the number of prescriptions used by Medicaid recipients, with older Caucasian females having the greatest number of prescriptions filled (Kotzan, Carroll, & Kotzan, 1989).
Institutional and Medicaid status, as well as ESRD and disability status, are important predictors of future health costs because members of these groups historically have more expenditures relative to their peers (Newhouse, Manning, Keeler, & Sloss, 1989; Zarabozo, 2000). Despite the inputs included, AAPCC models only explain about 1-2 percent of the variance in future medical costs and no health status adjusters are included (Thomas, Lichtenstein, & Wyszewianski, 1986). The inability of AAPCC models to explain variability in health status led plans to selectively enroll healthier individuals and to avoid sicker ones (Dowd et al., 1996).
Including Prior Utilization and Costs
Including prior healthcare utilization and prior costs in diagnosis-based and pharmacy-based risk-adjustment models have been found to explain more variance and improve predictive validity of the risk-adjustment models (Ash, Porell, Gruenberg, Sawitz, & Beiser, Adjusting Medicare capitation payments using prior hospitalization data, 1989; Zhao et al., 2005). Numerous studies have found that prior utilization models outperform AAPCC risk-adjustment models in predicting year-2 costs (McCall & Wai, 1983; Anderson & Knickman, 1984; Beebe, Lubitz, & Eggers, 1985; Thomas, Lichtenstein, & Wyszewianski, 1986; Ash, Porell, & Gruenberg, 1986). A study conducted by Beebe et al. (1985) sought to augment the AAPCC payment methodology by assessing the feasibility of including prior Medicare use, which provided better
explanatory power than the AAPCC model alone. The payment methodology including prior Medicare use was being tested in one of the Medicare HMO demonstration projects initiated by TEFRA (Beebe, Lubitz, & Eggers, 1985). The study authors acknowledged a major concern of prior-use models was the ability to “game the system.” Similarly, prior costs have not been incorporated into risk-adjustment models used for estimating capitated payments because prior costs can be manipulated by health plans and health care practitioners.
Functional Status and Objective Health Measures
In addition to including prior use, attempts have been made to include functional status health measures, such as instrumental activities of daily living scores, to enhance HMO capitation payments (Thomas & Lichtenstein, 1986). Another study included perception-based inputs to adjust capitated payments, including perceived health status and functional health status, along with prior utilization in the AAPCC model (Epstein & Cumella, 1988). Another study found evidence that the AAPCC model was improved by including prior use and objective health status measures, such as indicators for elevated cholesterol or blood pressure levels (Newhouse, Manning, Keeler, & Sloss, 1989). Despite the increased predictive ability of including perception-based and objective health status inputs, the Health Care Financing Administration (HCFA – the forerunner to CMS) has chosen not to incorporate these into risk-adjustment models used for capitated payments, possibly due to the difficulty of gathering such information as compared to claims-based information (U.S. GAO, 1994b).
Diagnostic Cost Groups (DCG)
Ash et al. (1989) refined the AAPCC model by including diagnosis-based inputs for risk adjustment, grouping diagnosis codes from hospitalizations into clinically meaningful groups
called diagnostic cost groups (DCGs). These DCGs were first organized into 78 diagnostic subgroups, which were pooled based on the three-digit International Classification of Diseases, 8th Revision – Clinical Modification (ICD-8-CM).The 78 diagnostic subgroups were then aggregated into nine DCGs, no longer clinically similar, based on similar average total costs in the study year. Individuals were then classified into one of 10 DCGs based on their hospitalizations during the study year, with an additional category representing DCG 0 indicating no hospitalization. The relatively costliness of the DCGs increases from DCG 1 to DCG 9. Individuals are classified into the highest DCG if multiple diagnoses are found. However, only one principal diagnosis contributes to a DCG for each hospitalization. The DCG model was able to explain about 4% of the model variance compared to about 0.5% with the AAPCC model (Ash, Porell, Gruenberg, Sawitz, & Beiser, Adjusting Medicare capitation payments using prior hospitalization data, 1989).
In a follow-up study to Ash et al. (1989), refinements to the DCG model were made to include a discretionary component to hospitalizations and requiring a length of stay of at least 3 days before qualifying a hospitalization for a DCG (Ellis & Ash, 1995/96). In order to determine which diagnoses should be considered towards DCG categorization, physicians were asked to rank diagnoses based on the level of “inappropriate admissions” that might arise if it were included in a payment model. The main findings of this study were that the DCG categories remained stable compared to the Ash et al. (1989) study, suggesting that the DCG would be a reasonable candidate to risk adjust Medicare capitated payments. Additionally, the exclusion of discretionary hospitalizations from the model severely decreased the predictive power of the model. Finally, dropping the short-stay hospitalizations (length of stay less than 3 days) from the model did not lead to a meaningful difference in explanatory power (Ellis & Ash, 1995/96).
Principal Inpatient Diagnostic Cost Group Model (PIP-DCG)
A study conducted by Ellis et al. (1996) compared the AAPCC model to two DCG models: one that only used the principal inpatient diagnosis to assign the DCG (PIP-DCG) and a second that used all diagnoses from inpatient, outpatient, and physician sources (ADDCG). The PIP-DCG OLS model explained more variance in year-2 expenditures compared to the AAPCC model (AAPCC R2 = 1.02%; PIP-DCG R2 = 5.53%) and did not suffer significantly for not including
other sources of diagnoses (ADDCG R2 = 6.34%). This study updated the DCG model to use
International Classification of Diseases, 9th Revision – Clinical Modification (ICD-9-CM) codes.
As a result of the Balanced Budget Act of 1997, CMS moved from AAPCC-based payments to a model which used the principal inpatient diagnostic cost group (PIP-DCG) in 2000. This was the first time that CMS used health status measures along with demographic information (age, sex, status of Medicaid eligibility, and original reason for Medicare eligibility) to adjust capitated payments using diagnostic data from inpatient admissions. Pope et al. (2000b) refined the PIP-DCG model initially proposed by Ellis et al. (1996). This refined model contained 29 mutually exclusive cost categories for hospitalizations that are predictive of future costs (AAPCC R2 = 1.5%; PIP-DCG R2 = 6.2%). These PIP-DCG categories were ranked similar to the original
DCG model proposed by Ash et al. (1989). This model was intended as a transition model until the DCG/HCC model would be put in place (Pope et al., 2000b).
Diagnostic Cost Group/Hierarchical Condition Category Model (DCG/HCC)
Building on the Ash et al. (1989) DCG model, Ellis et al., (1996) expanded the DCG framework to allow for a secondary diagnosis from the inpatient hospital claims to be included in the model, allowed for life-sustaining medical procedures to classify individuals into groups, and
organized the DCG framework to allow for multiple coexisting conditions called DxGroups. The DxGroups allowed for multiple coexisting conditions to be grouped together and, in contrast to DCGs, assigning individuals to none, one, or multiple DxGroups. A hierarchy is then placed on related DxGroups, called hierarchical coexisting conditions (HCC), so that only the most costly, and usually most severe manifestation of a condition, is considered for payment. An example of this coding system would be an individual having a diagnosis of diabetes without complications and a subsequent diagnosis for diabetes with renal manifestations. The diagnosis with renal manifestation would override the diagnosis without complications. This same patient might have a diagnosis for some type of cancer, which would be in a separate DxGroup and count independent of the diabetes diagnosis in the model. The hierarchical model (R2 = 8.08%) outperformed the
AAPCC model (R2 = 1.02%) (Ellis et al., 1996). Pope et al. (2004) provides an example of how the
hierarchies are applied.
Ash et al. (2000) further refined the DCG/HCC model by updating the ICD-9-CM coding for the DxGroups (n=543) and grouping them into medically related groups with similar expected costs called condition categories (CC) (n=118) and then imposing a hierarchy on these condition categories, which are now called hierarchical condition categories (HCC) rather than hierarchical coexisting conditions. The DCG/HCC model performed better than the PIP-DCG and Age/Sex models based on the reported predictive ratios (Ash et al., 2000). Another study found the DCG/HCC-based model to be at least as powerful as prior costs in predicting future high-cost cases, and the combination of prior costs and diagnostic data was found to provide even more explanatory power (Ash, Zhao, Ellis, & Kramer, 2001).
CMS-Hierarchical Condition Category (CMS-HCC)
The CMS-HCC was implemented in 2004 to adjust Medicare capitated payments to Medicare Advantage plans. Pope et al. (2004) describe the modifications to the DCG/HCC model, which primarily included refining the DxGroups (n=804) and the condition categories (n=189), before CMS finally reduced the condition categories to 70 total categories. CMS makes adjustments to the condition categories each year, omitting ones which result in negative payments. The diagnoses from the HCCs in the CMS-HCC model may come from five sources: 1) principal hospital inpatient; 2) secondary hospital inpatient; 3) hospital outpatient; 4) physician; and 5) clinically trained non-physicians.
CMS-RxHCC
The Medicare Prescription Drug, Improvement, and Modernization Act (MMA) of 2003 created the Medicare drug benefit (Part D). Similar to Medicare+Choice (renamed Medicare Advantage by the MMA), CMS was to make capitated payments to private health plans to managed the drug benefit for eligible Medicare beneficiaries who opted for a Part D plan. The risk-adjustment model for these capitated payments was developing using the CMS-HCC methodology, using diagnoses from a baseline year to predict year-2 expenses. However, this model was designed using diagnoses groupings (RxHCCs) that would predict year-2 prescription drug costs, rather than medical costs (Robst, Levy, & Ingber, 2007). The CMS-RxHCC explains about 12% of the variance in year-2 prescription drug costs (Hsu et al., 2009). One contrast between the CMS-HCC model and the CMS-RxHCC model is that individual drug costs remain relatively stable from year to year, which is not the case with medical expenses. Hsu et al. (2009)
found that 88% of beneficiaries had year-2 expenditures within two deciles of their year-1 expenditures.
Non-CMS Diagnosis-Based Risk Adjusters
Diagnosis-Based Measures
The primary purpose of this study is to enhance measures used for risk-adjusted capitated payment. However, there are several non-CMS risk-adjustment measures that are common in the literature that may benefit from including a medication exposure measure. These measures use diagnosis and/or pharmacy information as inputs to predict not only costs, but also health outcomes such as hospitalizations and mortality. Two diagnosis-based models, including the Charlson Comorbidity Index and the Elixhauser Index, and one pharmacy-based model, RxRisk, will be discussed here and included in the study.
The Charlson Comorbidity Index (CCI) was initially developed by subjective physician estimates of comorbidity to predict one-year mortality for individuals being considered for a breast cancer clinical trial (Charlson, Pompei, Ales, & MacKenzie, 1987). Since its introduction, it has been validated by numerous studies (Romano, Roos, & Jollis, 1993a; Romano, Roos, & Jollis, 1993b) and widely used in the literature to predict mortality, hospitalizations, and resource use (Charlson, Pompei, Ales, & MacKenzie, 1987; Dominick, Dudley, Coffman, & Bosworth, 2005; Klabunde, Legler, Warren, Baldwin, & Schrag, 2007). The original CCI used information from patient medical charts to arrive at a physician assigned weight for 19 conditions. These weights are summed to arrive at the CCI. Later studies have adapted the CCI to use administrative claims data (Deyo, Cherkin, & Ciol, Adapting a clinical comorbidity index for use with ICD-9 administrative
databases, 1992; D’Hoore, Sicotte, & Tilquin, 1993; D'Hoore, Bouckaert, & Tilquin, 1996). Schneeweiss et al. (2004) found that the Romano, Deyo, D’Hoore, and Ghali adaptations of the CCI performed similarly in predicting one-year mortality. Given the similar performance of these adaptations, the Deyo et al. (1992) adaptation will be adopted for this study simply because it is more commonly used in the literature.
Elixhauser et al. (1998) extended the work of Charlson et al. (1987) and developed a comorbidity measure to predict inpatient outcomes including length of stay, hospital charges and in-hospital mortality. The Elixhauser Index uses a set of 30 comorbidities that were found to be associated with increases in length of hospital stay (Elixhauser, Steiner, Harris, & Coffey, 1998). Calculation of the Elixhauser Index requires diagnosis-related groups (DRGs) from the hospital inpatient claim.
Pharmacy-Based Measures
Like diagnosis-based inputs, pharmacy-based inputs have been used to develop risk-adjustment measures. Most of the pharmacy-based inputs use the national drug code (NDC) from administrative claims data to infer that an individual has a certain condition. The chronic disease score (CDS) was the first of these models to be developed (Von Korff, Wagner, & Saunders, 1992). A group of medications intended to treat chronic diseases were identified and mapped to the corresponding condition that they were intended to treat. The medications were then assigned a subjective weight based on expert judgment as to the severity of disease based on the drug therapy. The CDS was found to be correlated with physician rating of the patient’s health status (r=0.57) and with the patient’s self-rated health status (r=0.23) (Von Korff, Wagner, & Saunders, 1992). The CDS methodology has been replicated (Johnson, Hornbrook, & Nichols,
1994) and extended by other authors into pediatric populations (Fishman & Shay, 1999). In order to make the CDS measure less subjective, a follow up study derived empirical weights for the chronic conditions and found that the revised CDS explained more variance in total cost than the original CDS (revised CDS R2 = 19%; CDS R2 = 9%) (Clark, Von Korff, Saunders, Baluch, &
Simon, 1995). The study compared the CDS to ambulatory care groups, finding that the CDS was a better predictor of mortality than the ambulatory care groups.
The RxRisk model was developed based on the CDS framework. Similar to the CDS, it uses chronic condition drugs from ambulatory pharmacy claims data to predict health care costs (Fishman et al., 2003). The RxRisk model was developed by the same researchers who extended the CDS into a pediatric population. As a result, the RxRisk model included pediatric and adult individuals in its development. The authors sought to expand the CDS by having the RxRisk model include a more broad set of drugs and to make comparisons to ambulatory clinical groups (ACG) and hierarchical condition category (HCC) risk-adjustment models. Fishman et al. (2003) found that the HCC explained the most variance in healthcare costs (R2 = 15.4%), followed by
ACG (R2 = 10.2%), and then by RxRisk (R2 = 8.7%). Although RxRisk did not explain much
variance relative to the other models, combining a pharmacy-based model with other diagnosis-based models or a medication exposure measure may explain more variance than the model tested alone. An extension of the RxRisk model was developing using a Veterans Health Administration (VHA) population (Sloan et al., 2003). This updated model, called RxRisk-V, accounted for more conditions than the original model and was able to explain 10% of the variance in health costs. Because the RxRisk-V model was not tested in the same sample as the original RxRisk, drawing conclusions about which model has superior predictive power must be done with
caution. The non-weighted RxRisk-V was found to be strongly correlated (Spearman’s rho=0.848) with unique prescriptions (Farley, Harley, & Devine, 2006). Therefore, combining RxRisk-V with the medication exposure measure may not explain much additional variance, but it may be seen that the medication exposure measure will have similar explanatory power as the RxRisk-V.
Comparison Studies
Farley et al. (2006) found that the CCI and Elixhauser Index explained around 6 to 9% of the variance in log-transformed healthcare expenditures, which was the lowest of any other comorbidity estimator used in the study, including RxRisk-V, diagnosis clustering and simple resource counts. However, the variance explained for both CCI and Elixhauser increased to about 20% when those measures were coupled with count measures, including simple and unique prescription count (Farley, Harley, & Devine, 2006). Another study found that the CMS-HCC model performed better than Charlson’s and Elixhauser’s indices in predicting in-hospital and six month mortality (Li, Kim, & Doshi, 2010). This is likely due to the limited conditions that are included in the CCI and Elixhauser Index. However, researchers may still be interested in the performance of these risk adjusters when coupled with the medication exposure measure.
A study comparing Charlson’s Comorbidity Index, Elixhauser’s Index, and RxRisk-V on predicting physician visits, prescription drug use, and hospitalization in a sample with osteoarthritis found that all three significantly predicted health service use (Dominick, Dudley, Coffman, & Bosworth, 2005). This study found RxRisk-V to be a better predictor of prescription medication use, while the Elixhauser Index was better for predicting physician visits, and the Charlson better at predicting hospitalization (Dominick, Dudley, Coffman, & Bosworth, 2005).