Scalable Ranked Retrieval Using Document Images
Rajiv Jain
*, Douglas W. Oard, and David Doermann
University of Maryland, College Park, USA
ABSTRACT
Despite the explosion of text on the Internet, hard copy documents that have been scanned as images still play a significant role for some tasks. The best method to perform ranked retrieval on a large corpus of document images, however, remains an open research question. The most common approach has been to perform text retrieval using terms generated by optical character recognition. This paper, by contrast, examines whether a scalable segmentation-free image retrieval algorithm, which matches sub-images containing text or graphical objects, can provide additional benefit in satisfying a user’s information needs on a large, real world dataset. Results on 7 million scanned pages from the CDIP v1.0 test collection show that content based image retrieval finds a substantial number of documents that text retrieval misses, and that when used as a basis for relevance feedback can yield improvements in retrieval effectiveness.
Keywords: Document Image Retrieval, Feature Indexing, Interest Points, Relevance Feedback, Content Based Image Retrieval, OCR
1. INTRODUCTION
Over the past several decades, it has become increasingly popular to scan and archive documents such as forms, contracts, bills, memos, statements and correspondences for both personal and commercial purposes. There are also substantial efforts underway by large organizations, such as the National Archives, Library of Congress and Google, to preserve large quantities of historical documents and printed books by scanning them and allowing widespread access to these printed materials that would otherwise only be accessible on site. As with any large collection of documents, these collections of images also require efficient and accurate information retrieval to allow users to find documents of interest from this pixel-based content.
Traditionally, the most effective approach has been to leverage the enormous amount of research in text retrieval by first using Optical Character Recognition (OCR) algorithms to convert the scanned document images to text. Unfortunately, OCR techniques, even if they are perfect, often do not fully capture visual information such as the font, page layout, or graphical objects that could help address a user’s information needs. Furthermore, retrieval algorithms have been optimized for “clean” text, but OCR algorithms are error prone, with substantial variations in accuracy even with state of the art commercial algorithms, due to factors such as script complexity, noise, resolution, and page layout. While some techniques exist to deal with noisy text, even the best text retrieval techniques begin to break down as the character accuracy rate falls below 75-80% [1].
A large portion of traditional document image research has focused on improving OCR performance, but more recent research has focused on using images in either classification or retrieval applications to perform image retrieval against the pixel representation of the content. Recent progress in image retrieval and increasing computational power has made it possible to scale to datasets with millions of document images. While the information retrieval community has been using collections of this size for decades, pixel-based document image retrieval research has traditionally focused on much smaller sets. Moreover, image retrieval research has tended to focus on designing algorithms optimized for specific tasks such as logo recognition or page layout analysis, with the implicit assumption that such capabilities would be useful in a more global pipeline.
To the best of our knowledge, this study is the first to directly examine an image retrieval algorithm’s utility in supporting a user’s information seeking behavior on a large real world collection in an attempt to answer the question, “Is image retrieval useful for general document retrieval applications?” This paper explores whether a large scale, segmentation-free image retrieval algorithm can improve retrieval performance when compared to standard text retrieval on OCR'd data. Experiments were conducted using topics generated by lawyers, for which relevance judgments are available on a large realistic collection of document images obtained from lawsuits against tobacco companies.
2. RELATED WORK
The most common method of information retrieval on document images continues to be text retrieval on output generated from OCR programs. This is a popular option due to the efficiency of text retrieval systems as well as the increasing speed and precision of OCR technology. Unfortunately, state of the art OCR systems continue to have high character error rates (CER) and word error rates (WER) with non-ideal documents and non-Latin script languages, which can make traditional text retrieval challenging. Additionally, OCR requires many preprocessing steps including page segmentation, line segmentation, deskewing, and noise removal which can cause entire blocks of text to be missed if done poorly. The work of Doermann [1] and Beitzel et al. [2] provides an overview of recent OCR error correction and retrieval techniques that are tolerant to these types of errors. As a general rule, prior research on OCR shows that 1) for character accuracy between 70-80% character n-gram techniques perform well, 2) for 80-95% accuracy, enhanced IR techniques work well, and 3) most vector-space retrieval algorithms are tolerant to OCR above 95% accuracy [1].
In the past decade, techniques have also been developed that allow image retrieval researchers to perform query-by-example image retrieval for graphical objects within a document image. Active research supporting this includes word spotting, page layout analysis and retrieval of graphical objects, especially when OCR error rates are too high to perform adequate text retrieval. Surprisingly, little work has been done directly comparing the text retrieval against the benefits of image retrieval techniques. Page layout analysis was one of the earliest techniques for performing document image retrieval because the structure of a document image can sometimes provide as much information as the textual content. For example, when looking for official memos or forms from a company that always have the same structure, one can key off of the layout of the page even though the textual content can change. A full survey of this page layout research can be found in [1] and [10]. In recent years, there have been a number of papers exploring retrieval in document images using graphical objects such as logos, which OCR cannot handle. Wang and Chen use a decision tree to grow rectangle boundaries around candidate logos in [19]. In [18], Zhu and Doermann detect logos on a page using connected component features and a Fisher classifier. Zhu et al. extend their detection work in [20] to build a retrieval system and perform recognition by matching local shape context descriptors, reporting a MAP score of 82.6% on the Tobacco 800 dataset. Jain and Doermann [21] demonstrate a scalable image retrieval application, which outperforms the previous approach on the Tobacco 800 dataset by indexing local features from both images or text blocks and logo images. Rusinol and Llados [22] also take a similar approach and perform logo retrieval using a bag of SIFT features. They report a true positive rate of 90.2 % and a false positive rate of 1%, but the experiments are done on a different dataset that is not publicly available, making direct comparison difficult.
In cases where general purpose OCR algorithms fail and the font and script has little variation within a dataset, document image researchers have employed techniques that match the image of a word directly against a document image. Rath and Manmatha had one of the first successes using this approach in noisy handwritten historical manuscripts [17]. A word segmentation algorithm was used to extract all the words from the page and then an exemplar word was matched against all the words in a page using contour and gradient features. The average precision of this algorithm is 72%, but a downside is that the algorithm is limited by the accuracy of the page and word segmentation. More recently Rusinol et al. proposed a segmentation-free word spotting algorithm [15]. He uses dense SIFT features in a bag of features framework, which is similar to the approach in section 3, but significantly more computationally expensive. The features are mapped to code words and then represented using Latent Semantic Indexing. During retrieval, a document image is scanned over several scales for areas with similar patches and candidate patches are verified geometrically.
3. DOCUMENT IMAGE RETRIEVAL
In order to compare image retrieval to text retrieval on a large real world dataset, an algorithm is required that can scale to millions of images, query in real-time, and search for sub-images of graphical objects and textual content. However, most previous work in the image domain has only scaled only to a few thousand images. We instead created a segmentation-free image retrieval system composed of 3 primary steps: Local feature extraction, feature indexing, and geometric verification. While several papers have been published with variations in these three steps, this general approach has shown state of the art performance for many applications such as word spotting [29], retrieval of graphical objects and text blocks [23], semi-structured document recognition [5], near duplicate retrieval in document images [14], and scene and object retrieval in photographs [13]. The sections below detail the three steps for the algorithm used in this paper.
3.1 Local Feature Extraction
Local feature extraction for images can be split into 2 steps: interest point detection and feature description. A good interest point detector extracts patches from an image that are distinct and repeatable across common image transformations such
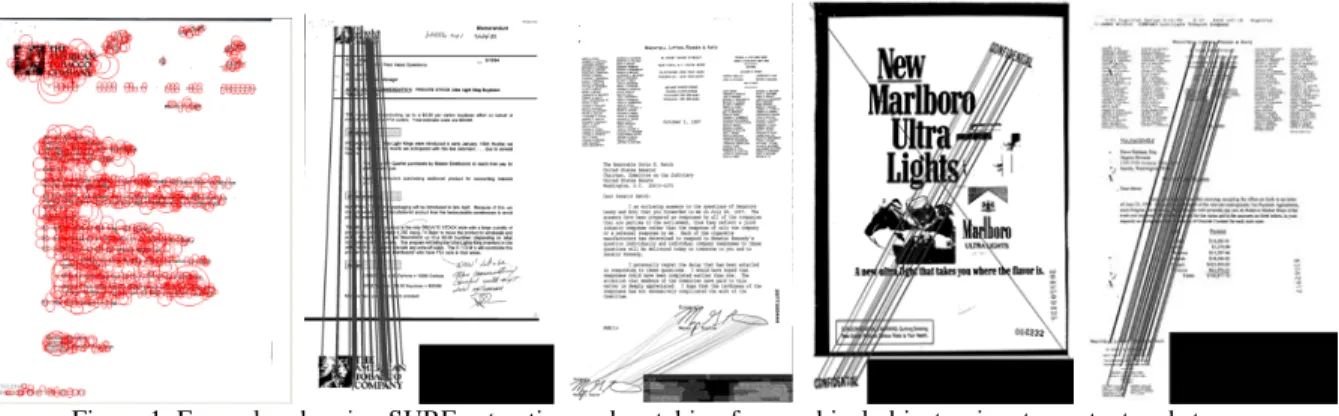
as scaling, rotation, and cropping. An illustration of these patches can be found in Figure 1. Next each patch is represented by a feature vector, which ideally captures the shape and texture of the pixels within the patch, but is invariant to noise and variations that occur across similar images. Document images are especially challenging because the pixels are often binary, meaning that there is little texture information and a substantial amount of noise present in images from the binarization process.
Figure 1: Examples showing SURF extraction and matching for graphical objects, signatures, text and stamps
Speeded Up Robust Features (SURF) [12] were chosen for this experiment because it has shown state of the art performance for image retrieval, is fast to compute, and is more resilient to binarization and noise than other popularly used local features such as SIFT [9]. SURF uses a fast Hessian interest point detector, which finds patches with the largest gradient change in comparison to neighboring patches at varying scales. The SURF feature descriptor for a given patch is calculated by first equally subdividing a given patch into a 4x4 grid. For each subsection, the Haar wavelet response Dx and Dy are computed in the x and y directions respectively. The original SURF descriptor calculates the following 4 attributes (∑Dx, ∑Dy, ∑ |Dx|, ∑|Dy|) per interest point. However, the first 2 features ∑Dx and ∑Dy contain very little information in binary images. Hence, they are excluded to form a more compact 32 dimensional feature vector and provide a 2X speed up when making feature comparisons without loss in accuracy. We use an open source C++ implementation of the SURF algorithm from the OpenCV software package and have slightly modified it to produce the smaller feature vector described above. A more detailed analysis of this algorithm can be found in the original SURF paper [12].
To build a naïve retrieval system using these descriptors one would first extract SURF features from each document image offline. Then at query time, one would extract SURF features from a region of interest in an image, do a pair-wise comparison between all the features extracted from the document and logo and then choose the document with the most matches. On average, we extract about 7000 features per document image to allow enough coverage for matching against small image queries, even at a single word level, as shown in Figure 1. Given that about 1000 features are extracted from small query regions and 32x1000x7000 calculations are required for feature comparison between just 2 images, it becomes quickly apparent that this approach will not scale to datasets with millions of images due to its computational requirements.
3.2 Feature Indexing
In order to speed up retrieval times to make this approach tractable in real time, an inverted index is built by grouping feature vectors that are distinct along the same dimensions. As shown in Equation 1, the distinctiveness D for a given position in feature vector v is defined as:
𝐷𝐷(𝑖𝑖) =v𝑖𝑖 −μ𝑖𝑖
σ𝑖𝑖 (1) Where μi and σi are the mean and standard deviation for the distribution of position i over the feature vector. Two hash keys are created for each feature vector by taking the six positions with the highest distinctiveness and the six positions with the lowest distinctiveness score and sorting the values numerically. The hash is further expanded by using one bit to represent the sign of the Laplacian in the fast Hessian detector and another bit to represent whether the hash came from the highest or lowest distinctness scores. This indexing scheme provides a hash space or “visual vocabulary” of 3,624,768. These hashes follow a power law distribution and thus hashes that occurred in more than 50 percent of the documents were discarded because they were less discriminative and less efficient to query. This is conceptually similar to a stop words list in text retrieval, where terms with high document frequency are discarded. To speed up the querying of large images
containing a many thousands of features, only the 7000 features with the lowest document frequency are retained since these features are likely to be more discriminative.
a) b) c) d)
Figure 2: Example Query. a) Query Image. b) Indexed Image. c) Brute Force matches with geometric verification. d) Indexed matches with hash collisions and geometric verification. Note about 50% of matches are lost from 2c.
This approach is similar to Locality Sensitive Hashing (LSH), which attempts to map feature vectors close in space to similar hash values [11]. Unlike traditional LSH, which typically requires a much larger random seek cost and memory footprint, this approach takes advantage of the distribution and relatively low dimensionality of SURF features to only require two hashes during indexing and retrieval. Figure 3 provides an analysis of the hashing technique given the L2 distance between SURF features compared using the brute force method between pairs of images with matching regions. SURF matches were marked true if they linked the correct region between the two images and otherwise false. Figure 3a shows the probability of a hash collision given the L2 distance between SURF features. To put these probabilities in context, Figure 3b shows that about 45% of all valid matches are retained up until SURF has a false match rate of 80% at a L2 distance of 0.1 and 40% of all valid matches are retained up until SURF has a false match rate of 96% at a L2 distance of 0.14. In practice, matches beyond a distance of 0.1 create too large a false positive rate to be useful for retrieval. While a substantial number of SURF matches are lost, prior work using this hashing function [23] showed only a slight reduction in recall due to the large number of features being extracted per image allowing many opportunities for point matches between corresponding regions. Figure 2 shows an example of the matches found using the hash index in comparison to the Brute force method. Other current state of the art feature indexing approaches such as KD-trees [3], which could potentially provide much higher recall, would also require a very large amount of RAM to be practical with the volume of features being extracted. The simplicity of this indexing scheme, its large hash space, and ability to allow efficient indexing on traditional hard disks sets this hashing technique apart from other approaches.
a) b)
Figure 3: Hash properties given L2 distance between 2 SURF features. a) Probability of a hash collision. b) Given a brute force query with matches marked true or false if they correspond with the correct region: Green – Accuracy of SURF features. Blue –Accumulating percentage of true SURF matches. Red – Percentage of true SURF matches that also have hash collisions.
As with all approximate nearest neighbor algorithms there is no guarantee that two points indexed to the same key truly match. To increase precision, a low dimensional representation of the feature vector is used to verify an indexed feature vector falls within a given distance threshold of the query. This is done with other state of the art indexing methods
0 0.2 0.4 0.6 0.8 1 0 0.05 0.1 L2 Distance
Hash Collision Probability
0 0.2 0.4 0.6 0.8 1 0 0.02 0.04 0.06 0.08 0.1 0.12 0.14 L2 Distance
as well [3, 4]. To minimize the storage cost and computational requirements of this matching, the SURF feature vector is reduced to 8 dimensions using PCA. This indexing scheme is used to create the following inverted index:
Key 1→ Doc ID→ X, Y coordinates, Orientation, Feature Vector
Key 2 → Doc ID→ X, Y coordinates, Orientation, Feature Vector
Each index key points to the unique ID for the document it was computed from and its associated feature vector. The X and Y coordinates and the orientation of the interest point are stored for geometric filtering, discussed in the next section. This index reduces search complexity by >108 over the naïve approach.
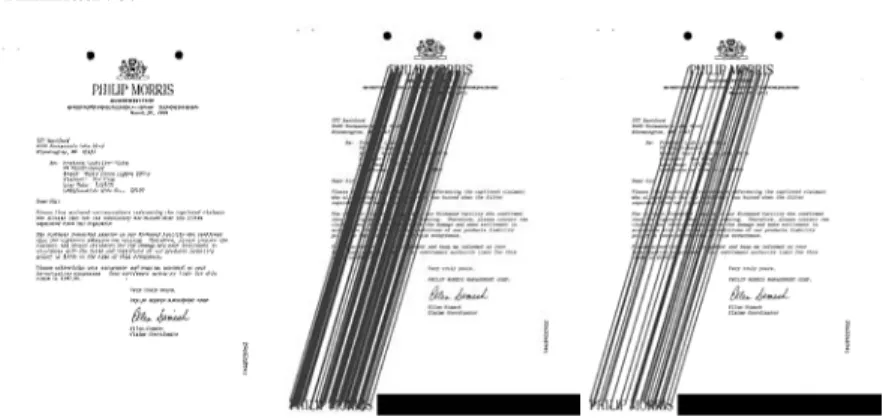
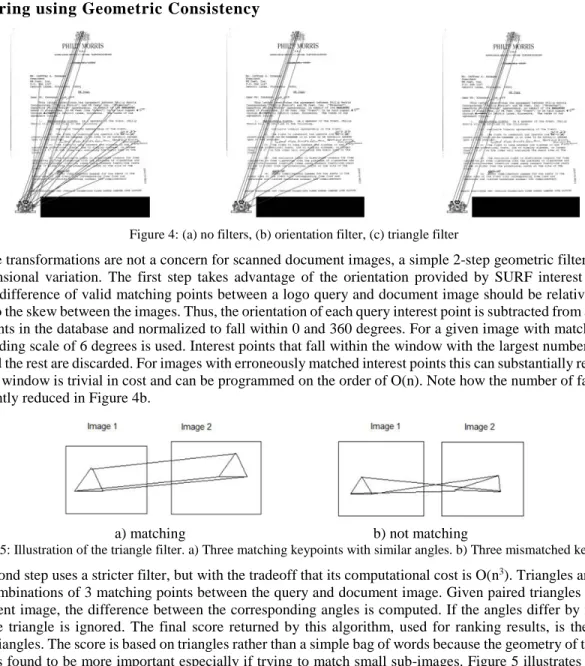
3.3 Filtering using Geometric Consistency
Figure 4: (a) no filters, (b) orientation filter, (c) triangle filter
Since affine transformations are not a concern for scanned document images, a simple 2-step geometric filter is designed for 2-dimensional variation. The first step takes advantage of the orientation provided by SURF interest points. The orientation difference of valid matching points between a logo query and document image should be relatively constant and equal to the skew between the images. Thus, the orientation of each query interest point is subtracted from all matching interest points in the database and normalized to fall within 0 and 360 degrees. For a given image with matching interest points, a sliding scale of 6 degrees is used. Interest points that fall within the window with the largest number of matches are kept and the rest are discarded. For images with erroneously matched interest points this can substantially reduce errors. The sliding window is trivial in cost and can be programmed on the order of O(n). Note how the number of false matches is significantly reduced in Figure 4b.
a) matching b) not matching
Figure 5: Illustration of the triangle filter. a) Three matching keypoints with similar angles. b) Three mismatched keypoints The second step uses a stricter filter, but with the tradeoff that its computational cost is O(n3). Triangles are computed from all combinations of 3 matching points between the query and document image. Given paired triangles in the query and document image, the difference between the corresponding angles is computed. If the angles differ by more than 3 degrees, the triangle is ignored. The final score returned by this algorithm, used for ranking results, is the number of matching triangles. The score is based on triangles rather than a simple bag of words because the geometry of the matching patches was found to be more important especially if trying to match small sub-images. Figure 5 illustrates this triangle filter and Figure 4 shows how these two filters remove false positives. To reduce the cost of the triangle filter, one could randomly sample the set of all triangles. However, we found this filtering to be nominal in cost because there were few erroneous matching points after the first filter was applied. While efficiency is always a concern, filtering can afford to be more expensive because only the top results need to be verified and this process takes less time than the index retrieval.
4. EXPERIMENTS
4.1 CDIP Tobacco Dataset
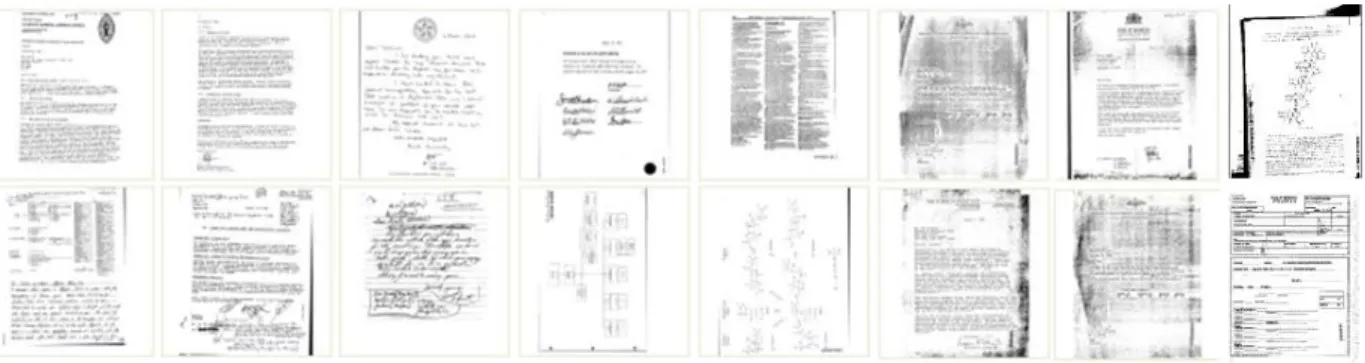
The collection used for the experiments is the Complex Document Information Processing (CDIP) test collection [6]. CDIP includes 7 million scanned documents and over 42 million pages, received from tobacco company lawsuits. All images have been scanned in binary format from many different scanners and range in resolution from 150 DPI to 300 DPI. There are many types of documents in the collection, including research papers, e-mails, letters, memos, books, and handwritten notes. The documents have many nonstandard layouts and often include graphics such as logos, tables, graphs, photos, and signatures. Figure 6 shows how noisy the images can be as a result of the binarization. The CDIP collection also includes English OCR text for each document. This collection was used for the TREC Legal Track from 2006-2008 [7, 8], but the complexity of the scanned documents resulted in poor OCR text quality, making this collection an interesting IR challenge for noisy text. TREC Legal worked with lawyers to create “mock” complaints, over 100 topics, and associated Boolean queries. It was impractical for the TREC team to ground truth the entire dataset, so instead they created relevance judgments by pooling the top results from participating systems and truth marking samples from those results. Topics with fewer than 5 judgments of “relevant” were discarded, leaving 55 topics.
Figure 6: 16 sample pages from the CDIP dataset
4.2 Experimental Design
The goal of the experiments was to compare the technique described in Section 3 to text retrieval of OCR and determine if it provided any utility in satisfying a user’s information need for a set of topics on the CDIP tobacco dataset. The setup of this experiment closely mimics the evaluation of TREC Legal. The hope was that the two modes of retrieval would be complementary and that the image retrieval results would improve retrieval performance on at least a few topics when the results of the two techniques were combined. A more modest goal of the experiment was to see if there was a positive relationship between document image retrieval and increased query performance to show that these techniques could be used in cases where OCR failed and text retrieval was not possible.
Due to limited resources (we used one server to build the index), it was not possible to process, index, and store the 1.5 TB, 42 million page collection for image retrieval. Instead, only the first page for each of the seven million documents from the CDIP collection was used resulting in 40 billion indexed features. Lucene [23] was chosen as the text retrieval system for this experiment since it is very popular both commercially and academically for text based information retrieval. Unlike text retrieval, one major drawback with most image retrieval algorithms is that it is almost impossible for a user to make a query without having an existing image of interest. To overcome this limitation in the experiments, text queries using the words from each of the TREC Legal Boolean queries were run and the text and images corresponding to the top 1000 ranked results were retained. The actual Boolean queries were not used because they do not provide ranked results. 4.2.1 Relevance Feedback
The first two experiments evaluated the two retrieval strategies using relevance feedback, where the top N relevant documents that were returned by the initial query were used to resubmit new queries. Rocchio’s algorithm, which is commonly used to perform relevance feedback, is shown in Equation 2.
𝑄𝑄𝑚𝑚 ������⃗ = (𝛼𝛼 ∗ 𝑄𝑄�����⃗𝑂𝑂) + (𝛽𝛽 ∗ 1 |𝐷𝐷𝑟𝑟|∗ � 𝐷𝐷���⃗𝚥𝚥 𝐷𝐷𝚥𝚥 ����⃗∈𝐷𝐷𝑟𝑟 ) − (𝛾𝛾 ∗ |𝐷𝐷1 𝑛𝑛𝑟𝑟|∗ � 𝐷𝐷����⃗𝑘𝑘 𝐷𝐷𝑘𝑘 �����⃗∈𝐷𝐷𝑛𝑛𝑟𝑟 ) (2)
Here 𝑄𝑄𝑂𝑂 is the original query vector, 𝐷𝐷���⃗𝚥𝚥 is a related document vector, 𝐷𝐷𝑟𝑟 is the set of relevant documents, and 𝐷𝐷𝑛𝑛 is the set of unrelated documents. 𝛼𝛼,𝛽𝛽, and 𝛾𝛾 are constants used to balance the importance of the relevance feedback results against query drift from the original query. In the experiments, unrelated documents were not used in the relevance feedback so 𝛾𝛾 was always set to zero. 𝛼𝛼 and 𝛽𝛽 were varied experimentally to determine the optimal performance for relevance feedback and verify that the relevance feedback does indeed improve performance. When comparing two systems note that (𝛼𝛼 ∗ �����⃗𝑄𝑄𝑂𝑂) cancels out and that the only metric needed to directly compare both relevance feedback algorithms is the relative ranking using only the feedback from applying:
�������⃗𝑄𝑄𝑟𝑟𝑟𝑟𝑟𝑟 = |𝐷𝐷1
𝑟𝑟|∗ � 𝐷𝐷���⃗𝚥𝚥 𝐷𝐷𝚥𝚥
����⃗∈𝐷𝐷𝑟𝑟
(3)
While application of this formula is straightforward for text retrieval by substituting TF-IDF scores, the image retrieval query vectors occupy a different vector space than the original query. Thus instead of applying the formula using the TF-IDF score from each query, the rank of the result was substituted instead. For both experiments three combinations were evaluated: the original query alone, the original query + text relevance feedback, and the original query + image relevance feedback. The image queries were conducted using the algorithm presented in Section 3 with the entire document image result. Document images submitted to the text retrieval system used the text OCR and the entire textual content was used for the text query. The first experiment simulated user relevance feedback by using the top five relevant documents returned from the initial query for relevance feedback. The second experiment simulated blind relevance feedback, where the Top 10 ranked results (relevant or not) were submitted for relevance feedback.
4.2.2 User Queries
The third experiment attempted to determine if users could improve image retrieval by only selecting relevant sub-images rather than the entire document image. In order to avoid biases, three different users selected five distinct topics from the collection on which they thought image processing would perform best. They were supplied with all relevant images from the initial query for each TREC topic and asked to select three distinct document images from the collection that they felt were most relevant to the topic. To be fair to both retrieval systems, the users were asked to select the best image sub-region and the best text sub-sub-region. Both of these sub-regions, as well as the full document image, were then submitted to both retrieval algorithms and each was treated as a new ad-hoc query when evaluating the system.
4.2.3 Evaluation Measures
Mean Average Precision (MAP) is a widely used evaluation metric that balances precision and recall into a single value metric averaged across all queries. However, recent studies have shown that MAP, breaks down when used with incomplete relevance judgments. Because the relevance judgments are sparse, we have chosen to report Bpref [24], an evaluation measure optimized for experiments with sparse relevance judgments. Bpref is a relative measurement that works by ignoring documents without relevance judgments and instead measures the number of relevant documents found above non-relevant documents in a ranked list. It is calculated by Equation 4:
Bpref = 𝑅𝑅1 �(1 − | 𝑛𝑛 ranked higher then min (R, N ) 𝑟𝑟 |
𝑟𝑟
) (4)
Where R is the number of judged relevant documents, N is the total number of judged non-relevant documents, r is a
retrieved document that is relevant, and n is the number of non-relevant documents ranked higher than r. Query results of up to a depth of 10,000 were considered due to the sparse number of relevance judgments. The experimental procedure and metrics used are consistent with the experiments done by the TREC Legal Track on this collection [8].
A measurement for precision was also used to complement the Bpref results, especially because we expected image retrieval results to be less well represented in the existing TREC Legal relevance judgments. For that reason, we asked three new assessors to provide relevance judgments for the top 10 results from 20 randomly selected queries, using each system for the three experiments. We used a majority vote to produce a new ground truth from which a traditional precision at 10 measure could be computed. These results, denoted as P(10), are informative as an indication of early precision, but are not directly comparable to the results we report using the sparse TREC Legal relevance judgments.
5. RESULTS
5.1 Simulated Relevance Feedback
a) b)
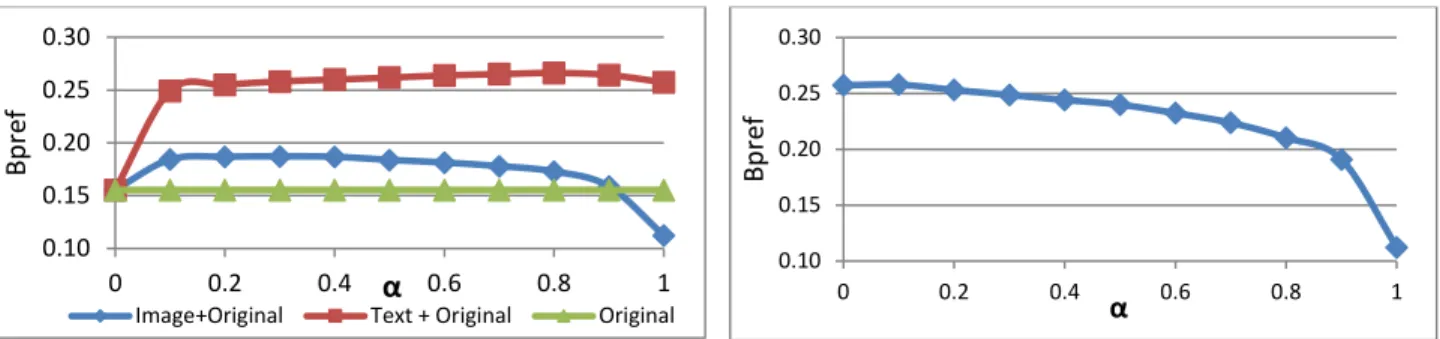
Figure 7: Simulated relevance feedback results. a) Retrieval improvement using text/image relevance feedback. b) Retrieval performance of the combined image+text relevance feedback with varying weight (α) placed on the image and text retrieval. Both image and text retrieval approaches positively impact query performance when the top relevant results were resubmitted for relevance feedback. The graph in Figure 7a shows the Bpref score in order to examine the relationship between the original query and the relevance feedback results. The image relevance feedback is optimal with a weighting
of α=.7 and β=.3, which provided an average improvement of 20% over the original query and improved 40 of the 55
queries. The text relevance feedback is optimal with a weighting of α=.2 and β=.8, which provided an average improvement
of 71% over the original query and improved 46 of the 55 queries.
Figure 8: Relevance feedback improvement of image+text retrieval over text retrieval: topics ranked worst to best based on text retrieval performance
Since both image and text retrieval positively impact relevance feedback performance, the question is now whether image + text retrieval is better than text retrieval alone. The results in Table 1 show the Bpref and Precision scores averaged across all queries. When compared independently, the text retrieval outperforms the image retrieval. Figure 7b displays the Bpref score for various weights of image and text retrieval. The image + text retrieval combination only improves the results by 0.25% mainly because there is a substantial amount of overlap between the positive matches in the two results sets. Hidden from the graph is the fact that image retrieval outperformed text retrieval on 4 queries and image + text retrieval outperformed text retrieval on 17 queries.
Table1: Bpref and Precision at 10 results for the simulated relevance feedback.
Feedback Bpref P(10)
Text 0.25 0.66
Image 0.11 0.44
The CDIP topics were not built with image retrieval capabilities in mind, and thus even modest improvement of the image retrieval system on a few queries is sufficient to indicate the potential of these algorithms in retrieval settings. One advantage of an image retrieval system is that it can work on degraded documents and in cases where the OCR fails. To test this hypothesis, the results are sorted in ascending order based on the text retrieval Bpref score and the Bpref improvement from the image + text retrieval is measured in Figure 8. The results show that several of the first 15 topics with lowest text retrieval performance have substantial improvement by combining the text and image retrieval results.
0.10 0.15 0.20 0.25 0.30 0 0.2 0.4 0.6 0.8 1 Bp ref
α
Image+Original Text + Original Original
0.10 0.15 0.20 0.25 0.30 0 0.2 0.4 0.6 0.8 1 Bp ref α -0.02 0 0.02 0.04 Bp ref I mp ro vemen t
5.2 Blind Relevance Feedback
a) b)
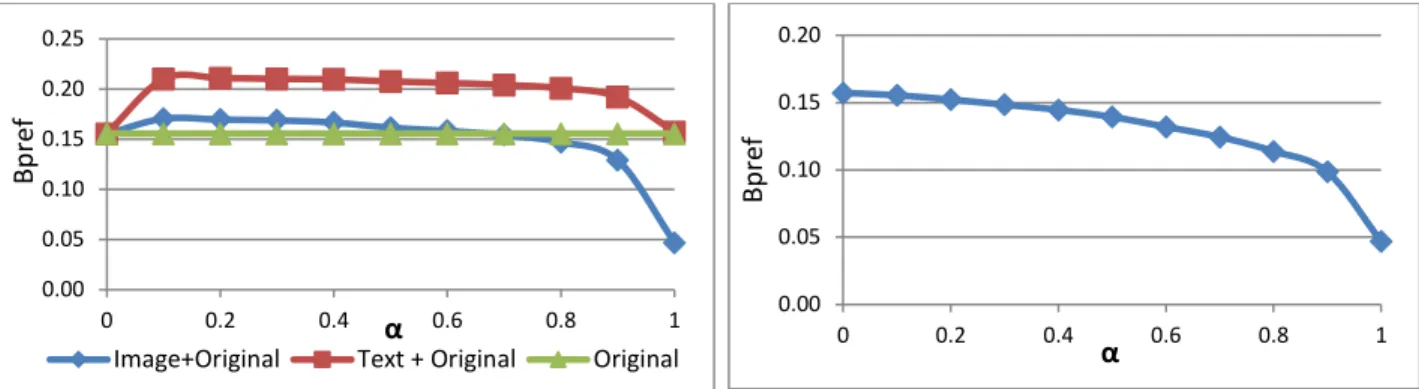
Figure 9: Blind Relevance Feedback Results. a) Retrieval improvement using text/image relevance feedback. b) Retrieval performance of the combined image+text relevance feedback with varying weight (α) placed on the image and text retrieval. The results for BRF follow the same pattern as the previous section. The graph in Figure 9a shows that both image and text retrieval approaches positively impact query performance when the top 10 results were resubmitted for blind relevance feedback with the text retrieval again outperforming the image retrieval. The blind relevance feedback for image queries is optimal with a weighting of α=.9 and β=.1 and provides an average improvement of 10% over the original query. The
text relevance feedback is optimal with a weighting of α=.2 and β=.8 and provides an average improvement of 36% over
the original query. The image retrieval improved 29 of 55 queries and the text retrieval improved performance 40 of the 55 queries.
Figure 10: Relevance feedback improvement of image+text retrieval over text retrieval: topics ranked worst to best based on text retrieval performance
The results in Table 2 also show that the precision was lower than the simulated relevance feedback and that the precision of the image retrieval was again lower than the text retrieval. This could be due to the poor performance of the original query. In many cases only one or two of the top ten documents used for BRF were actually relevant to the topic. Image retrieval in general is error prone and the fact that it was not more adversely impacted by the presence of non-relevant documents is surprising.
Table 2: Bpref and Precision at 10 results for the blind relevance feedback.
Feedback Bpref P(10)
Text 0.15 .57
Image 0.04 .34
Figure 9b shows that text retrieval outperforms any combination of text retrieval and image retrieval on average across the datasets. However, the image retrieval outperforms the text retrieval on two queries and the combined image+text retrieval performs better than text retrieval on 8 of 55 queries. The improvement of the combined image+text retrieval over text retrieval is again examined in Figure 10 for cases where the text queries performed poorly. The results are mostly negative with results appearing to somewhat improve in a couple of the bottom cases, but they also appear to get substantially worse for most of the other queries.
0.00 0.05 0.10 0.15 0.20 0.25 0 0.2 0.4 0.6 0.8 1 Bp ref α
Image+Original Text + Original Original
0.00 0.05 0.10 0.15 0.20 0 0.2 0.4 0.6 0.8 1 Bp ref α -0.04 -0.02 0 0.02 0.04 Bpr ef Im pr ov em ent
5.3 User Queries
The results in Table 3 show the Bpref scores for the text, image, and combined retrieval for the text region, image region selected by the user as well as for the entire page. Even though the image region is labeled with the word “Image” the regions selected by users contained at least some text in almost all cases. For many of the documents selected by users, there were no graphical objects and thus users struggled to select a region and often chose unique parts of the page layout. Unlike the relevance feedback results, each of the three image queries were treated as new ad-hoc queries, which is why the results may seem lower in comparison to the other two studies. The combination of both retrieval techniques was tried for various weights similar to the relevance feedback experiments and the optimal weighting scheme is shown in Table 3. Image+Text Bpref performance improved by a modest 3.3% for image region queries.
Table 3: Bpref and precision at 10 retrieval results for user selected regions
Bpref results for user queries Precision at 10 results for user queries Text Image Entire Page Text Image Entire Text 0.159 0.092 0.181 Text 0.69 0.45 0.80 Image 0.038 0.037 0.046 Image 0.45 0.45 0.49 Text+Image 0.159 0.095 0.180 Text+Image 0.71 0.49 0.80 % Change 0% 3.3% -0.5% % Change 2.8% 8.5% 0%
This is also reflected in the P(10) results in Table 3, which shows an 8.5% improvement in precision for the image region and 2.8% improvement for the text region. This suggests that there is relevant content in the image region that is not available to the OCR. The difference in relative scores between the Bpref scores and P(10) results (a factor of 4 compared to a factor of 2), also suggests that the relevance judgments are biased against image retrieval as relevant documents were likely not included in the judgment pools, lowering the Bpref scores for image querying. The image retrieval on its own outperformed text retrieval on four queries when evaluating the text region. It also outperformed text retrieval on three queries when evaluating the entire page, and 14 queries when evaluating the image regions. When the image retrieval was combined with the text retrieval it outperformed the text retrieval on seven queries for text region, eight queries for the entire page, and 15 queries for image regions. This improvement on a limited number of queries also suggests that the image retrieval may be beneficial in some unique cases when prominent visual features exist in an image. The use of sub-regions did not help query performance for either technique, likely because less information was available to the algorithms. This was the first time users had tried the image query paradigm and one explanation for the drop in performance is that they were unable to select the best documents or regions for optimal image retrieval.
5.4 Impact on Images with Poor OCR
The accuracy or quality of an OCR system is typically expressed using character and/or word error rates. However, in the absence of a substantial amount of ground truth test data, both of these values are hard to accurately measure. The work in [8] and [25] used a more ad-hoc measure known as OCR Score, which gives a rough estimate of the word error rate. OCR Scores can be calculated by counting the number of 4+ letter words in the page that appear in a dictionary and dividing it by the total number of 4+ letter words in a page. One of the major advantages of image retrieval over text retrieval is that it is not dependent on OCR output and thus hypothetically better handles poor quality document images. To evaluate this hypothesis, the top 1000 ranked results from the text and image retrieval were evaluated to determine the frequency for various ranges of OCR Scores.
Table 4: Comparison of image and text retrieval OCR Scores
OCR Score 100-95 95-90 90-80 80-70 70-60 60-50 50-25 25-0
Image Retrieval 14.3 27.5 28.7 11.3 3.42 1.98 3.08 9.56
Text Retrieval 22.2 37.8 31.5 6.6 1.4 0.4 0.1 0
The results in Table 4 show image retrieval returns substantially more documents at an OCR Score of 80% or lower. Results with an OCR Score of 25% or lower make up about 10% of the image retrieval results even though not a single result with an OCR Score this low was returned by the text retrieval system. Unfortunately, there were few relevance judgments on document images with poor OCR quality because the pooling of results in the tobacco collection was based on the top results from text retrieval systems that entered the TREC competition. Even, the TREC study in [8] showed approximately 33% of the CDIP collection had an OCR score below 50% and text retrieval approaches in the study had
difficulty retrieving documents from this subset of the collection. This made it difficult to assess how beneficial the image retrieval would be in these cases when OCR is likely to fail. The OCR score was calculated for the judgments provide by our assessors for the P(10) calculation in order to determine whether this same phenomenon was seen in the limited results available. In this case, the average OCR score for the text results was 0.89, the average OCR score for the image results was 0.81, and the distribution was similar to Table 4, providing further evidence that the text retrieval favors documents with high OCR quality.
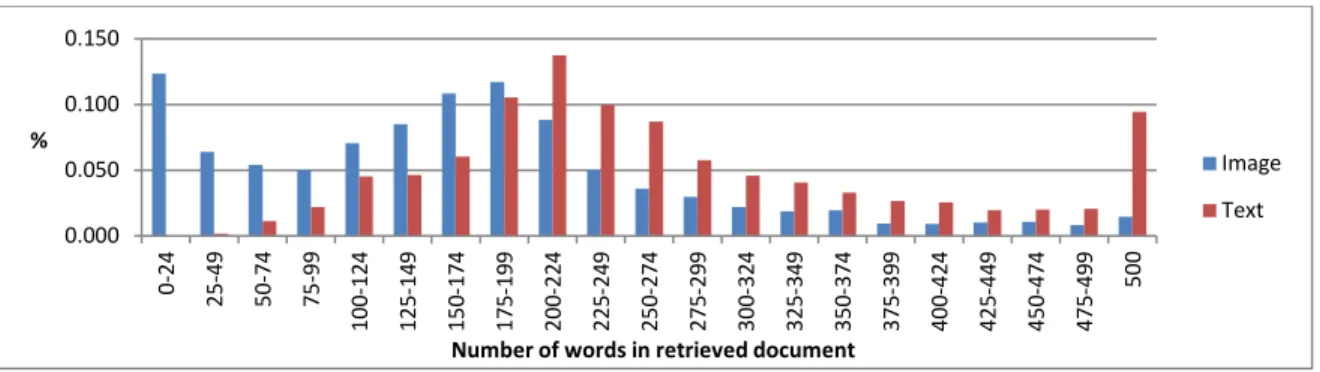
Figure 11: Percentage of documents retrieved with a given word count for both retrieval systems.
While OCR Score is a great measure for studying the effect of the word error rate on retrieval performance, it will not accurately reflect the effect of segmentation errors, where large portions of the page do not have OCR. Instead, this would be manifested by the image retrieval results having fewer words per result. The top 1000 ranked results are again taken from both retrieval systems and this time the percentage of results returned are shown for various word counts in Figure 11. The average word count for the image retrieval is far lower at 167, while the average OCR for the text retrieval is 287. The fact that 19% of the image retrieval results has less than 50 words, while only .1% of text retrieval results did indicates that that there may be relevant information on the page that the OCR is unable to extract. While image retrieval may not always be needed when OCR quality is good, these results indicate that recall may be increased if image retrieval technology is used for documents with a low OCR score or when few words are extracted from a page. Since systems that participated in the Legal Track used text retrieval of OCR or Metadata, the pooled relevance judgments are possibly biased towards the capabilities of these systems, meaning that documents with little text or poor OCR quality were less likely to have been evaluated.
5.5 Further Analysis
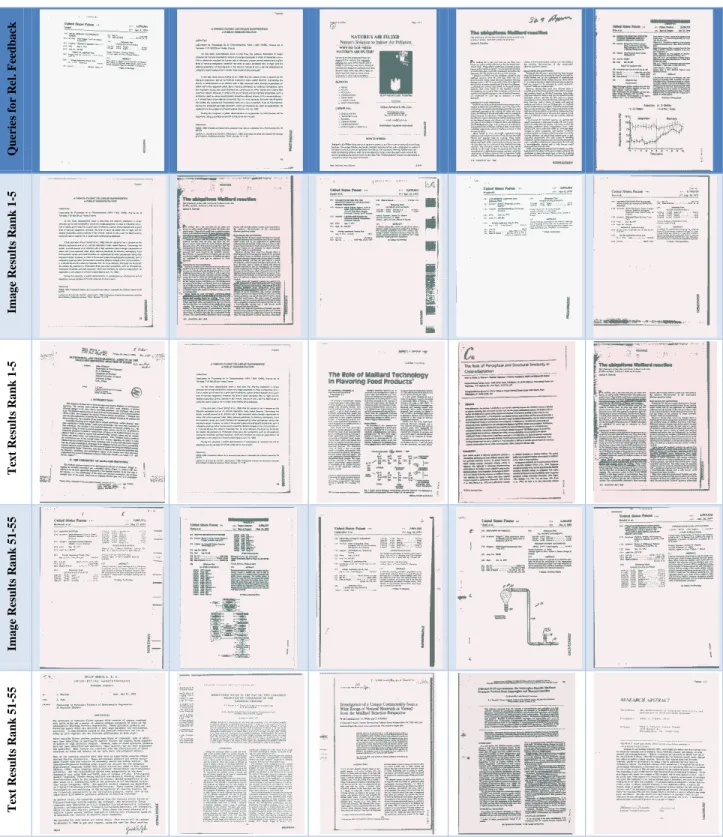
The results from simulated relevance feedback were analyzed further in order to provide greater insight into the performance of the image retrieval system. In order to give tangible examples the types of queries and results that were generated, Figures 12 and 13 include a text description of the topic (from CDIP), the initial text query (from CDIP dataset), query images used for relevance feedback, and ranked results from image and text retrieval for two of these topics. Topic 78 was chosen because the relevance feedback results using image retrieval outperformed text retrieval by 2% using the Bpref metric. Similarly, Topic 13 was chosen since the text retrieval results were far superior to the image retrieval results with a 35% increase in Bpref. As the results in Figure 12 and 13 show, the image retrieval results were generally near duplicates of the query images at the highest ranks. At lower ranks, the image retrieval results show that the system primarily matched prominent sub-images of the query images such as the US Patent header, the Lorillard logo, or the law offices header and address block.
In the case of Topic 78, which was looking for any documents related to patents of odors, the visual representation of the US Patent Header was important because it is found on all patent submissions and the image query therefore brought back a significant number of relevant patents. This is in contrast to the text retrieval results, which brought back a large number of studies referencing odors, but did not bring back a significant amount of documents also referencing patents. While the OCR did pull out “United States Patent” correctly for text retrieval, the visual importance of the header given its size, font, and location is not conveyed in the OCR text used in the relevance feedback.
Topic 13, which focuses on documents related to chocolate or candy cigarettes, presents a case in which the image retrieval system can fail if the visually prominent portions of the images are not relevant to the topic. This can also occur in cases where there is little content for the image retrieval system to match, such as a document containing pure text with no repeatable visual patterns in common with other relevant documents. Even though, the first couple of image retrieval results for this topic were relevant near duplicates, the majority of results afterwards largely contained either the Lorillard
0.000 0.050 0.100 0.150 0-24 25 -4 9 50 -7 4 75 -9 9 10 0-12 4 12 5-14 9 15 0-17 4 17 5-19 9 20 0-22 4 22 5-24 9 25 0-27 4 27 5-29 9 30 0-32 4 32 5-34 9 35 0-37 4 37 5-39 9 40 0-42 4 42 5-44 9 45 0-47 4 47 5-49 9 50 0 %
Number of words in retrieved document
Image Text
logo or the Brumbaugh law header. Since documents from these companies occurred frequently in the CDIP collection and candy cigarettes were a very small portion of their work, the vast majority of the documents returned were about the business of these companies rather than the topic of interest. The text retrieval results on the other hand focused on chocolate or candy cigarettes since the terms appear often in the query documents and likely had low document frequency raising their prominence in the TF-IDF bag of words model. Unfortunately, none of the CDIP topics centered on individual companies or people, where matching sub-images such as the headers, logos, or address blocks like in the examples above would have likely done very well. Most of the topics were focused on general illegal actions taken by all tobacco companies such as hiding harmful side effects, selling cigarettes to kids, or bribing officials, which were difficult for the image retrieval system to find repeating visual patterns relevant to the topic.
5.6 Efficiency
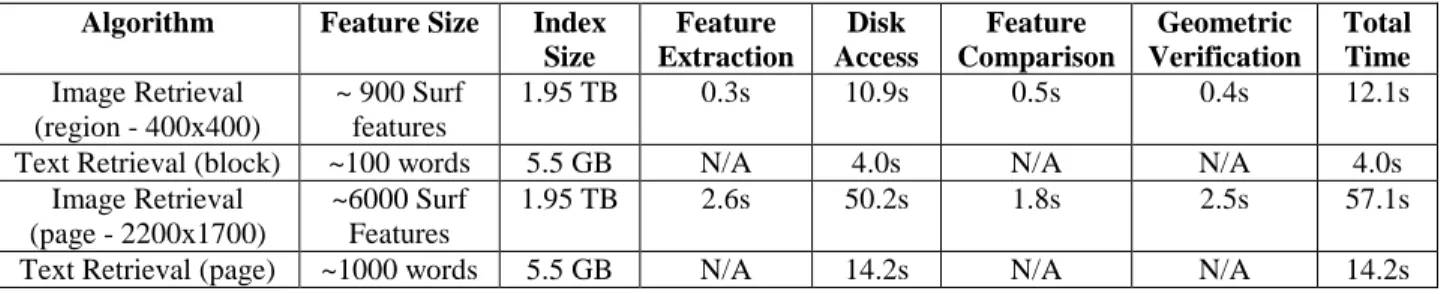
In order for an image retrieval algorithm to be useful it must scale to large numbers of images on commodity hardware and allow for modest indexing and retrieval times. Using a grid computing engine with 400 nodes, it took approximately eight hours to extract on average 7000 SURF features per page and index all seven million document images using the techniques described in Section 3. The resulting index was two terabytes in size, though more efficient use of disk space could easily reduce the index to one terabyte. While this is substantial in size, unlike many other image retrieval techniques, this algorithm is able to achieve reasonable search times with the index residing entirely on a hard disk, which is trivial in cost when compared to RAM. The algorithm was designed to have the index distributed across a large number of hard disks using a distributed database such as HBase or residing on a solid state drive to reduce the impact of random seek and disk read time when making thousands of index lookups. Due to limited resources, the index was loaded on a single server and spread across 8 disks. For typical image region queries like text blocks, titles, or logos, the average query time across all seven million images was about 13 seconds. As shown in Table 5, the vast majority of the time was spent on random disk seeks and reads. Hardware and software engineering improvements such as using solid state drives or adding more hard drives would likely greatly speed up this approach. The image retrieval approach presented in this paper is still a magnitude slower than text retrieval algorithms, but results suggest that image retrieval is still usable because not all document images require image indexing and not all users require image queries.
Table 5: Index sizes and average retrieval times for the image and text retrieval used in the experiments
Algorithm Feature Size Index Size Feature Extraction Disk Access Feature Comparison Geometric Verification Total Time Image Retrieval (region - 400x400) ~ 900 Surf features 1.95 TB 0.3s 10.9s 0.5s 0.4s 12.1s
Text Retrieval (block) ~100 words 5.5 GB N/A 4.0s N/A N/A 4.0s
Image Retrieval (page - 2200x1700)
~6000 Surf Features
1.95 TB 2.6s 50.2s 1.8s 2.5s 57.1s
Text Retrieval (page) ~1000 words 5.5 GB N/A 14.2s N/A N/A 14.2s
6. CONCLUSION
To the best of our knowledge, this study is the first to conduct a large scale comparison of whether image retrieval can satisfy a user's information needs on a large real world dataset by scaling a segmentation free image retrieval algorithm to a 7 million document image dataset. In many cases when there are handwritten words, rare languages, obscure fonts, or noisy images where OCR is likely to fail, document image retrieval may be the only viable option. The results of this study are significant in showing that current image retrieval algorithms can be used to satisfy a user’s information need for general topic based queries on large heterogeneous datasets. As a baseline, this technique was compared to text retrieval of OCR, which is the most common retrieval method on document images. While the goal was to show that the combination of image retrieval and text retrieval would outperform text retrieval in all cases, it appears that on average text retrieval alone is still superior for the English text in the tobacco corpus. However, the image retrieval significantly outperformed text retrieval on a subset of the queries and the combined image and text retrieval improved upon substantially more. This suggests that while the image retrieval algorithm is not needed in all cases, there exists a class of user topics and document images for which image retrieval is beneficial.
Future research is required to identify the set of topics or use cases for which image retrieval technology can be useful. This is a variant of the query difficulty problem, which in general is known to be hard. In this case, however, we have evidence from OCR scores and word counts that could serve as useful features. The results also indicated that the relevance
judgments from the TREC Legal dataset are biased towards the capabilities of text retrieval systems, and suggest future experiments in multimodal retrieval should try to include retrieval results from a larger variety of technologies in order to better support future use of the resulting collections.
ACKNOWLEDGMENTS
This material is based in part upon work supported by the National Science Foundation under Grant No. 1065250. Any opinions, findings, and conclusions or recommendations expressed in this material are those of the authors and do not necessarily reflect the views of the National Science Foundation.
REFERENCES
[1] D. Doermann. The indexing and retrieval of document images: a survey. CVIU, 287–298, 1998.
[2] S. Beitzel, E. Jensen & D. Grossman, Retrieving OCR text: A Survey of Current Approaches. Symposium on
Document Image Understanding Technologies, Greenbelt, MD, 2003.
[3] M. Muja et. al. "Fast Approximate Nearest Neighbors with Automatic Algorithm Configuration". VISAPP 2009.
[4] H. Jegou, M. Douze, and C. Schmid. Product quantization for nearest neighbor search. PAMI 2010.
[5] O. Augereau et. al. "Semi-structured document image matching and recognition." SPIE Electronic Imaging. 2013.
[6] D. Lewis et al. Building a test collection for complex document information processing, SIGIR, pp. 665–6, 2006.
[7] S. Tomlinson, D. Oard, J. Baron & P. Thompson. Overview of the TREC 2007 Legal Track. TREC-2007.
[8] J. Baron, B. Hedin, D. Oard & S. Tomlinson. Interactive Task Guidelines, TREC- 2008 Legal Track, 2008.
[9] D. Lowe, Distinctive image features from scale-invariant keypoints, IJCV 60(2) 91–110, 2004.
[10] S. Mao, A. Rosenfeld & T. Kanungo, Document structure analysis algorithms: a literature survey, SPIE, 2003
[11] Datar, Mayur, et al. "Locality-sensitive hashing scheme based on p-stable distributions." Symposium on
Computational geometry. ACM, 2004.
[12] H. Bay et al. SURF: Speeded up robust features, CVIU, 2008
[13] J. Philbin et al. Lost in quantization: Improving particular object retrieval in large scale image databases. CVPR, 2008. [14] Y. Ke et. al. Efficient near-duplicate detection and sub-image retrieval. ACM Multimedia, 2004.
[15] M. Rusinol et. al. Browsing Heterogeneous Document Collections by a Segmentation-free Word Spotting Method.
ICDAR, pp 63–67, 2011.
[16] K. Takeda, K. Kise & M. Iwamura, Real-time Document image retrieval for a 10 million page database with a
memory efficient and stability improved LLAH, ICDAR, 2011.
[17] T. Rath and R. Manmatha. Word spotting for historical documents. IJDAR, 2006.
[18] G. Zhu & D. Doermann. Logo matching for document image retrieval. ICDAR, pp. 606–610, 2009.
[19] H. Wang & Y. Chen. Logo detection in document images based on boundary extension of feature rectangles. ICDAR,
pp. 1335–1339, 2009.
[20] G. Zhu et al. Multi-scale Structural Saliency for Signature Detection. CVPR, pp. 1-8, 2007.
[21] R. Jain & D. Doermann. Logo Retrieval in Document Images. DAS 2012, pp. 135-139.
[22] M. Rusinol & J. Llados. Logo spotting by a bag-of-words approach for document categorization. ICDAR, pp. 111–
115, 2009.
[23] The Lucene IR Engine. http://lucene.apache.org/.
[24] C. Buckley & E. Voorhees. Retrieval evaluation with incomplete information. In SIGIR, pp. 25–32, 2004
Topic 78
Description: All documents referencing patents on odors, excluding tobacco or cigarette related patents Initial Query:patent* odor* NOT (tobacco OR cigarette)
Figure 12: Image and Text Retrieval Results for Topic 78. The first row contains the first five relevant documents returned from the initial query, which are used to perform relevance feedback. The next 4 rows contain ranked results from image and text retrieval.
Q u eri es f o r R el . F eed b a ck Im a g e Re su lt s R a nk 1 -5 T ex t Re su lt s R a nk 1 -5 Im a g e Re su lt s R a nk 5 1 -5 5 T ex t Re su lt s R a nk 5 1 -5 5
Topic 13
Description: All documents to or from employees of a tobacco company or tobacco organization referring to the marketing, placement, or sale of chocolate candies in the form of cigarettes.
Initial Query: cand* chocolate cigarette*
Figure 13: Image and Text Retrieval Results for Topic 13. The first row contains the first five relevant documents returned from the
Q u eri es f o r R el . F eed b a ck Im a g e Re su lt s R a nk 1 -5 T ex t Re su lt s R a nk 1 -5 Im a g e Re su lt s R a nk 5 1 -5 5 T ex t Re su lt s R a nk 5 1 -5 5