Comparing For-Profit and
Not-for-Profit Health Care
Providers
A Review of the Literature
LISA R. SHUGARMANNANCY NICOSIA CYNTHIA R. SCHUSTER
WR-476-MEDPAC February 2007
Prepared for the Medicare Payment Advisory Commission
W O R K I N G
P A P E R
This product is part of the RAND Health working paper series. RAND working papers are intended to share researchers’ latest findings and to solicit informal peer review. They have been approved for circulation by RAND Health but have not been formally edited or peer reviewed. Unless otherwise indicated, working papers can be quoted and cited without permission of the author, provided the source is clearly referred to as a working paper. RAND’s publications do not necessarily reflect the opinions of its research clients and sponsors.
TABLE OF CONTENTS
EXECUTIVE SUMMARY ... iv
I. BACKGROUND... 1
II. METHODS... 3
III. RESULTS... 6
IV. SUMMARY AND DISCUSSION... 36
V. REFERENCES... 38
APPENDICES - EVIDENCE TABLES APPENDIX A1: METHODOLOGICAL APPROACH – HOSPITALS... 42
APPENDIX A2: METHODOLOGICAL APPROACH – NURSING HOMES... 56
APPENDIX A3: METHODOLOGICAL APPROACH – OTHER SETTINGS OF CARE... 62
APPENDIX B1: MODEL SPECIFICATIONS – HOSPITALS... 63
APPENDIX B2: MODEL SPECIFICATIONS – NURSING HOMES... 75
EXECUTIVE SUMMARY
This report summarizes a literature review examining the relationship between ownership status and facility costs. Our systematic review covered hospitals, nursing homes, and dialysis centers as well as four post-acute care settings: Skilled Nursing Facilities (SNFs), Long-Term Care Hospitals (LTCHs), Institutional Rehabilitation Facilities (IRFs), and Home Health Agencies (HHAs). We examined journals, annals, published studies from public and private health services research organizations, and conference papers and presentations for this review, focusing on those published in the last ten years (1996-2006).
As part of this review, we responded to the questions derived from the original Statement of Work provided by MedPAC. Specifically, we addressed the following inquiries:
1) What are the most commonly used forms of regression analysis used to model facility-level per case costs? What are the strengths and limitations of these models?
2) What are the most widely used standardized costs per case measures? What are the strengths and limitations of these measures?
3) What are the most widely used severity adjusters? What are the strengths and limitations of these adjusters?
4) What assumptions about providers as economic actors (profit maximizers, etc.) are customarily part of the analysis of providers’ costs?
5) Which variables explained significant differences between for-profit and not-for-profit providers’ costs?
In addition to addressing these issues, we also reviewed the different types of model specifications in terms of the included covariates, the relationship of these covariates to costs, and the strengths and limitations of these measures.
In total, we identified 33 papers that met our inclusion criteria, from which we abstracted information about 38 models of costs. The majority (23 papers presenting 27 models) focused on acute-care hospitals as the unit of analysis. Nursing homes were the unit of analysis in eight articles presenting 9 models. We also identified one paper focusing on costs in dialysis centers. Only one paper was identified that focused on a post-acute care setting (HHAs). No publications were found for the other post-acute care settings (SNFs, LTCHs, IRFs).
The reviewed papers provide conflicting evidence on whether and how for-profit
ownership affects hospital costs, but provide consistent evidence that costs are lower among for-profit nursing homes. This review summarizes a number of factors that might affect the findings including: the approach, functional form, relevant assumptions regarding errors and efficiency, assumptions regarding behavior, the specification of output, input prices, quality, case mix, and the included provider and market controls. The report also discusses other relevant factors associated with the approach including the use of panel vs. cross-sectional analyses, and the use of state vs. national samples.
To some extent, the conflicting findings for hospitals may result from differences in methodology: the approach (i.e., statistical modeling using multivariate regression, stochastic frontier regression, etc.), the functional form (e.g., translog, Cobb-Douglas, etc.), the
specification and the data used to analyze the relationship of for-profit ownership to costs. There was no consistent pattern in the results for profit status by the analytic approach or by the
functional form used. There was substantial variation in the specification (i.e., included
covariates) in the hospital models although we did not detect a strong relationship between how well-specified a model was and the conclusion of the study effect of profit status on costs. Cross-sectional analyses of hospitals were more likely to yield inconsistent results than panel data; state-level data were more likely to yield a significant negative finding than national-level data.
Multivariate regression was also the primary approach for analysis of the nursing home industry. Still, there was no particular relationship between approach and functional form for nursing homes. There was also less variation in specification among nursing home models. Nursing home models favored state-level cross-sectional analyses over panel data methods and national data.
In this report, we first provide a brief background on the issues related to profit status and provider costs and describe the objectives of this literature review. We then discuss the methods used to identify the literature and the results from our review efforts. Additional results are shared, organized primarily around the five questions proposed in the Statement of Work provided by MedPAC. Finally, we provide a summary and a discussion of the implications of these findings for future work on the relationship between profit status and provider costs, particularly in the post-acute care setting.
I. BACKGROUND
Medicare payments for post-acute care have increased dramatically in recent years despite the implementation of prospective payment systems aimed at promoting efficiency and controlling costs. Post-acute care now comprises 13% of Medicare spending [1]. In 1999, Medicare spending for post-acute care was only $25 billion, but just six years later had increased 68% to $42 billion [2]. Increases in Medicare expenditures occurred in all four post-acute settings: skilled nursing facilities (9% annually), inpatient rehabilitation facilities (9%), home health agencies (7%), and long-term care hospitals (18%). The increase in payments cannot be fully accounted for by increases in costs. Since the implementation of the prospective payment systems, increases in Medicare payments per case have far outpaced increases in costs.
The rapid increases in Medicare payments relative to industry costs have raised concerns about profit margins and whether payments should be adjusted to more accurately reflect facility costs in each of these settings. In 2004, margins for all four post-acute care settings were
substantial: 14% for skilled nursing facilities (SNFs), 16% for home health agencies (HHAs), 16% for inpatient rehabilitation facilities (IRFs), and 9% for long-term care hospitals (LTCHs) [2]. For some settings, such as home health, margins have exceeded 12% since the
implementation of prospective payment systems [3].
But these large average margins mask substantial variation within each setting, as profit providers tend to be much more profitable than not-profit providers [2]. In 2004, for-profit SNFs earned a 16% margin relative to 4% for not-for-for-profit agencies. For-for-profit HHAs earned 18% while not-for-profit HHAs earned 8%. The pattern is similar for long-term care facilities, where for-profit providers earned 10% margins relative to 6% for not-for-profit providers. Finally, for-profit inpatient rehabilitation facilities earned margins (24%) approximately twice as large as not-for-profits (13%).
A key policy question is whether higher margins for for-profit providers are justified, because those providers are more efficient (i.e., manage their costs better) or not justified because they reflect a superior ability of for-profit providers to exploit the incentives inherent in the payment methodology. A number of empirical studies in the health economics literature have attempted to explain variability in costs based on a variety of factors including observable and unobservable provider and market characteristics. But drawing conclusions from this literature is difficult because the methodologies used to disentangle the determinants of cost variability are likely to impact their findings. Indeed, there is a substantial literature comparing the results of various approaches and specifications (e.g., Linna [4]; Folland and Hofler [5]; Bryce, Engberg and Wholey [6]). This literature indicates that results can be sensitive to the use of alternative models, specifications, and assumptions; however, the results with respect to broad groupings of firms (e.g., not-for-profit providers) are less sensitive than results with respect to individual firms. Similar issues regarding sensitivity have undermined the literature comparing the performance of for-profit versus not-for-profit providers [7]. Consequently, future efforts to examine facility-level costs and the variability in costs across type of control must acknowledge the impact of the assumptions imposed by the chosen methodology as well as their strengths and limitations particularly when the results may be used to inform payment policies [8].
Objectives
MedPAC is concerned with the appropriateness of payment levels for post-acute care (e.g., SNFs, HHAs, IRFs, and LTCHs). Current payment structures do not account for profit status. For-profit and not-for-profit providers are paid by Medicare using the same methodology although, as cited above, the margins for these providers differ substantially by profit status. Our primary objective is to provide MedPAC with a comprehensive and critical review of the
literature, including the strengths and weaknesses of the commonly used forms of cost models and of the comparisons of for-profit versus not-for-profit health care providers. Although the focus of MedPAC’s future efforts will be the four post-acute settings, there are few studies that speak directly to these industries. Therefore, our literature review encompasses empirical analyses of hospitals, nursing homes, and dialysis centers and attempts to identify and review literature addressing the four post-acute care settings. We examined journals, annals, published studies from public and private health services research organizations, and conference papers and presentations for this review. The estimation of cost functions has a long history in the health economics literature, but we concentrated our efforts on research conducted within the last ten years.
In the following sections, we respond to the questions derived from the original Statement of Work provided by MedPAC. Specifically, we address the following inquiries:
1) What are the most commonly used forms of regression analysis used to model facility-level per case costs? What are the strengths and limitations of these models?
2) What are the most widely used standardized costs per case measures? What are the strengths and limitations of these measures?
3) What are the most widely used severity adjusters? What are the strengths and limitations of these adjusters?
4) What assumptions about providers as economic actors (profit maximizers, etc.) are customarily part of the analysis of providers’ costs?
5) Which variables explained significant differences between for-profit and not-for-profit providers’ costs?
In addition to addressing these issues, this report also provides discussions of model specification in terms of the included covariates, the relationship of these covariates to costs, and the strengths and limitations of these measures. Finally, we present a summary and discussion of the findings from this review, concentrating on lessons learned for future research on profit status among health care providers.
II. METHODS
The approach to this literature review was built on RAND’s experience in conducting literature reviews and meta-analyses through the RAND Southern California Evidence-Based Practice Center (EPC). We conducted a comprehensive environmental scan and searched the peer-reviewed literature, as well as other sources described below, to identify relevant
publications for this review. The environmental scan covered the traditional health literature databases: Medline, EMBASE and Cinahl. In addition, we searched Social Science Abstracts and Econlit, a database that includes economic journals, books, dissertations, and working papers.
Acknowledging that many studies may not have been published in academic journals, we also searched for “grey” literature from outside the world of peer-reviewed journals. The
following are sources we searched for documents describing relevant studies:
• New York Academy of Medicine (NYAM) Grey Literature Collection – NYAM publishes a bimonthly online publication of the New York Academy of Medicine Library featuring documents related to public health and medicine. This online resource includes conference proceedings, discussion papers, government documents, issue briefs, research reports, statistical reports, and white papers in the areas of health and science policy, public health, and general medicine and disease. The Grey
Literature Report contains materials published from 2000 to the present by government agencies, non-profit non-governmental agencies, universities, and independent research centers.
• Conference Papers Index – Preliminary results from studies are often presented at scientific or business conferences before or instead of publishing in journals. • Worldcat – This catalogue is maintained collectively by over 9,000 member
institutions around the world. It is the leading bibliographic database in the world, and contains books, web sites, recordings, films, and magazines.
Databases were searched using search terms entered alone and in combination with each other. Table 1 provides the list of search terms.
In addition to the databases described above, we had access to a previous literature search conducted by RAND through the EPC on issues related to the efficiency of the health care system. We reviewed all citations identified for this previous EPC study in the current review to supplement our original-search efforts.
Inclusion criteria for the search included:
1) articles published in the last 10 years (1996-2006); 2) articles written in English;
3) articles about the United States health care system; and 4) articles presenting multivariate analysis results.
Papers focusing on provider types other than those specified in Table 1 were excluded from further consideration. Similarly, papers that used data older than 1990 were excluded as older
data may not reflect the more recent policy environment in which the providers of interest work.1 Furthermore, we excluded papers that did not compare similar provider types with for-profit and not-for-profit status; for example, we excluded papers that only compared providers within a single profit status category (e.g., religious vs. secular not-for-profit providers). Lastly, we excluded papers that did not include outcomes related to financial performance, specifically cost.
Table 1. Search Terms for Review of the Literature Cost Search Terms
• Efficiency, Organizational
• Costs & Cost Analysis
• Cost Allocation
• Cost Control
• Hospital Costs
• Cost Function (keyword)
• Financial Performance (keyword)
Model Search Terms
• Models, Econometric
• Models, Statistical
• Stochastic Processes
• Regression Analysis
• Statistics & Numeric Data
• Stochastic frontier (keyword)
• Data envelopment analysis (keyword)
Profit Status Search Terms • Organizations, Nonprofit
• Health Facilities, Proprietary
• For profit (keyword)
• Not-for-profit (keyword)
Provider Type Search Terms • Hospital
• Hospital Administration
• Skilled Nursing Facilities
• Home Care Agency
• Home Health Agency
• Rehabilitation Centers
• Long-Term Care
• Nursing Home
• Hemodialysis Units, Hospital
• Dialysis facilities (keyword)
• Inpatient rehabilitation facilities (keyword)
• Long term care hospitals (keyword)
• SNF (keyword)
• HHA (keyword)
• IRF (keyword)
• LTCH (keyword)
We initially reviewed the titles and abstracts produced from the database searches in order to identify the subset of papers or reports that merited full review by the study team. Each title and abstract was then reviewed by at least two researchers. Where there was a lack of consensus regarding whether a study merited full review, the abstract was reviewed by the third researcher and discussed by the team to reach a decision regarding inclusion. In all cases that a title or abstract did not yield sufficient detail to determine its appropriateness for inclusion in the review, we erred on the side of caution and moved the citation to the next step in the review.
Due to the large number of citations in the EPC internal database (N=630 titles), we reviewed them first in title form. The union of titles selected by the review team was moved on to a review of abstracts.2 Likewise, we first processed results from the CINAHL and Grey
1 For papers that used multiple years of data, at least one year had to be at least as recent as 1990. 2 That is, the title was selected by at least one member of the review team.
literature databases with titles only, as there was a fee associated with obtaining the full citation associated with each title.
All relevant articles and reports obtained through our searches were “reference mined,” i.e., the reference lists were reviewed for additional articles that were relevant to the review but not identified through the database searches. This included articles fitting all selection criteria as well as review studies such as the paper by Shen et al. (2005), which were utilized as
background.
Once all papers were selected, we developed a coding form for abstracting relevant information from each article. Basic information collected from each publication included the following: authors, title, publication date, data source, sampling frame characteristics (e.g., covered years, covered regions, sample size), analysis method (e.g., approach and functional form), setting, covariates, and conclusions related to profit status.
III. RESULTS
Through the various literature searches, 743 articles were identified by title only. Of these, 86 (11.6%) progressed to have their abstracts reviewed. Of the 657 titles which were dropped, the most common reason was that the study was not relevant to our study purposes (n=301). Other articles were dropped due to a non-U.S. focus (n=113), a date of publication before 1996 (n=95), other facility type (n=73), a lack of cost outcomes (n=33), no profit-status comparison (28), no multivariate analyses described in the study (n=12), or study data were collected prior to 1990 (n=2).3
Figure 1. Literature Search Progression
3 Some papers failed on several inclusion criteria. When there were multiple issues in addition to cost, failure to focus on cost was recorded as the cause.
657 Dropped • Not Relevant: 301 • Non-U.S.: 113 • Pub. Date: 95 • Facility Type: 73 • Cost Outcome: 33 • Profit Comparison: 28 • Methods: 12 • Data < 1990: 2 743 Titles Reviewed
(630 EPC, 81 CINHAL, 32 Grey)
33 Selected Papers 18 articles added from reference mining 112 Papers Reviewed 642 Abstracts Reviewed Literature Searches 538 Dropped • Not Relevant: 78 • Non-U.S.: 39 • Pub. Date: 1 • Facility Type: 76 • Cost Outcome: 153 • Profit Comparison: 24 • Methods: 139 • Data < 1990: 16 • Other/mixed: 22 79 Dropped • Not Relevant: 3 • Non-U.S.: 2 • Pub. Date: 1 • Facility Type: 6 • Cost Outcome: 29 • Profit Comparison: 13 • Methods: 14 • Data < 1990: 11
Including the 86 articles selected from the title search as well as abstracts obtained directly from database searches, 642 abstracts were reviewed. Of these, 538 (83.8% were excluded for reasons described above. After adding 18 articles found via reference-mining, 112 full articles were reviewed. Of all reviewed articles, 33 articles fit all inclusion criteria and were selected for analysis.
Several papers reported results for more than one multivariate regression; from these 33 papers, we abstracted information for a total of 38 models. We included multiple models in our review from a single paper only when the models differed in a substantial way; i.e., the approach or the functional form must differ. Smaller changes in specification, such as changes in the number of covariates, were not deemed substantive changes. In such cases, we selected the authors’ preferred specification: the profit status findings were generally not sensitive to these minor changes.4
Table 2. Data Coverage Analyzed by Facility Type
Data Coverage Hospital Nursing Home Dialysis
Center Home Health Agency National (or continental domestic) 15 papers with 18 models 2 papers with 2 models 1 paper with 1 model --California 1 paper with 1
model -- --
Connecticut -- -- -- 1 paper with 1 model Florida 3 papers with
4 models -- -- --
Kentucky -- 1 paper with 1
model -- --
Missouri -- 1 paper with 1
model -- --
New York 1 paper with 1 model
1 paper with 1
models -- --
Texas -- 2 papers with 3
models -- --
Virginia 1 paper with 1
models -- -- --
Washington 2 papers with
2 model -- -- --
Set of States -- 1 paper with 1
model --
Totals 23 papers with
27 models 8 papers with 9 models 1 paper with 1 model 1 paper with 1 model
Table 2 presents summary information about the papers and models by data source (national vs. state) and provider setting. The majority (23 papers presenting 27 models) focused
4 In addition, two papers regressed elements of costs separately (Mukamel et al., 2005; Shukla et al., 1997). In these cases, the finding was not sensitive to the element of cost. We include only a single model in the review of results.
on hospitals as the unit of analysis. Although our primary interests were to identify the literature studying costs in post-acute care settings, the prominence of the hospital setting in the literature relative to post-acute care facilities prompted us to include them in hopes of extrapolating lessons to these settings. Nursing homes were analyzed in eight articles presenting 9 models. Other providers included in the review were home health agencies (one paper) and dialysis centers (one paper).
Twenty-one models used national data. Most hospital papers utilized national data, while most nursing home papers focused on state level data. The dialysis center model is national, while the HHA model was limited to Connecticut data. The majority the 38 models used data that were collected prior to 1997.
Each facility-type analysis focuses on a few common data sources. Hospitals rely most often on the American Hospital Association Annual Survey, the Area Resource File, and HCFA cost reports. Nursing homes often utilize the Minimum Data Set and the Online Survey
Certification and Reporting System (OSCAR), followed by the Area Resource File and Medicaid cost data. No trend can be reported for dialysis centers or home health agencies due to their small representation.
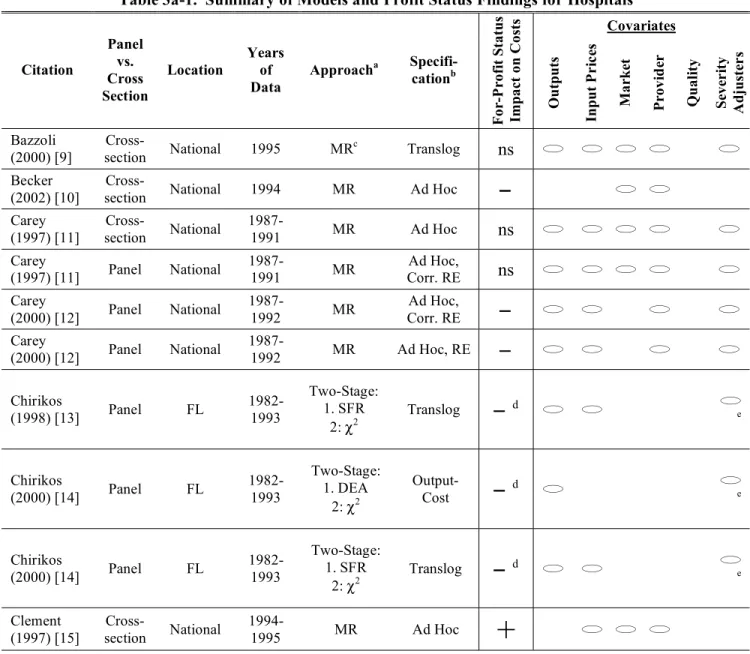
Appendix A presents full details of our abstraction, but for convenience we also present summary information about these models in Tables 3a through 3c (for simplicity, we present Table 3 in three segments by facility type: hospital, nursing home and other). The unit of analysis for the review is the model rather than the paper to account for some authors’ use of multiple modeling strategies within the same paper. We include in these tables a brief citation, the type of data used (cross-section or panel), the scope of sample (e.g., state versus national), the years of the data, the approach, and functional form used, for-profit status’ relationship with costs, and an overview of covariate types used in each model. 5,6 We present the results below organized by the five questions described in the Statement of Work by MedPAC. We defer any discussion regarding the models’ findings with respect to profit status until after the review of the approach, functional form and specification.
5 For this document, we will refer to approach as the use of multivariate regression, data envelopment analysis, or stochastic frontier regression. The term functional form will speak to the choice of a particular form for the model such as the translog, Cobb-Douglas or ad hoc. And the term specification refers to the inclusion of particular covariates in the regression.
6 The characteristics of data sources employed in these analyses are described in Appendix A and not in the summary tables.
Table 3a-1. Summary of Models and Profit Status Findings for Hospitals Covariates Citation Panel vs. Cross Section Location Years of Data Approacha Specifi-cationb F o r-P rofi t S tatu s Impa ct o n C o st s Outputs Input P r ic es M a rk et P rovi d er Q u ali ty Se v er ity A d ju st er s Bazzoli (2000) [9] Cross-section National 1995 MR c Translog ns Becker (2002) [10]
Cross-section National 1994 MR Ad Hoc
Carey (1997) [11] Cross-section National 1987-1991 MR Ad Hoc ns Carey (1997) [11] Panel National 1987-1991 MR Ad Hoc, Corr. RE ns Carey (2000) [12] Panel National 1987-1992 MR Ad Hoc, Corr. RE
Carey (2000) [12] Panel National 1987-1992 MR Ad Hoc, RE Chirikos (1998) [13] Panel FL 1982-1993 Two-Stage: 1. SFR 2: 2 Translog d e Chirikos (2000) [14] Panel FL 1982-1993 Two-Stage: 1. DEA 2: 2 Output-Cost d e Chirikos (2000) [14] Panel FL 1982-1993 Two-Stage: 1. SFR 2: 2 Translog d e Clement (1997) [15] Cross-section National 1994-1995 MR Ad Hoc+
Model included at least one variable construct in this class of covariates.
a
MR: Multivariate Regression; SFR: Stochastic Frontier Regression; DEA: Data Envelopment Analysis; 2: Chi-Square Test; RDL1: Robust Distance L1 Regression; AMOS: Analysis of Moments Structures; MLR: Multivariate Logistic Regression.
b
RE: Random Effects; FE: Fixed Effects; CES: Constant Elasticity of Substitution; GLF: Generalized Leontief Function.
c
Heckman correction for endogenous affiliation type.
d
The results from this study presented efficiency by profit status but without statistical testing.
e
Hospital admissions or discharges were adjusted by the facility-level average Medicare DRG case mix index; case mix was not included as a separate regressor.
f
First stage probit for endogenous chain membership.
g
This multivariate regression was estimated with endogenous output. Other models were tested with and without endogenous HMO penetration and prices but the direction of the coefficient on profit status was not affected by these alternate
specifications.
h
The author modeled five types of cost in this paper: total costs per admission, total costs less taxes per admission, labor costs per admission, non-labor costs per admission, and capital costs per admission. Each model was specified the same and the direction of the effect of profit status was also similar across all models.
i
One or more variables in this class of covariates was included only in the second stage of this analysis.
j
Table 3a-2. Summary of Models and Profit Status Findings for Hospitals Covariates Citation Panel vs. Cross Section Location Years of Data Approacha Specifi-cationb F o r-P rofi t S tatu s Impa ct o n C o st s Outputs Input P r ic es M a rk et P rovi d er Q u ali ty Se v er ity A d ju st er s Connor (1998) [16] Cross-section National 1986, 1994 MR CES
Gautam (1996) [17] Cross-section National 1990-1992 MR Ad Hoc+
Li (2001a) [18] Panel WA 1988-1993 MR GLF, Hybrid Diewert RE Li (2001b) [19] Panel WA 1988-1993 MR GLF, Hybrid Diewert RE McKay (2002) [20] Cross-section National 1986, 1991 Two-Stage: 1. SFR 2: MR Translog+
i McKay (2005) [21] Cross-section FL 1999-2001 Two Stage: 1. SFR 2. 2 Translog Menke (1997) [22] Cross-section National 1990 MR f Translog ns Potter (2001) [23] Cross-section National 1980, 1985, 1990, 1994 MR Ad Hoc+
Potter (2001) [23] Panel National 1980, 1985, 1990, 1994 MR Ad Hoc+
Model included at least one variable construct in this class of covariates.
a
MR: Multivariate Regression; SFR: Stochastic Frontier Regression; DEA: Data Envelopment Analysis; 2: Chi-Square Test; RDL1: Robust Distance L1 Regression; AMOS: Analysis of Moments Structures; MLR: Multivariate Logistic Regression.
b
RE: Random Effects; FE: Fixed Effects; CES: Constant Elasticity of Substitution; GLF: Generalized Leontief Function.
c
Heckman correction for endogenous affiliation type.
d
The results from this study presented efficiency by profit status but without statistical testing.
e
Hospital admissions or discharges were adjusted by the facility-level average Medicare DRG case mix index; case mix was not included as a separate regressor.
f
First stage probit for endogenous chain membership.
g
This multivariate regression was estimated with endogenous output. Other models were tested with and without endogenous HMO penetration and prices but the direction of the coefficient on profit status was not affected by these alternate
specifications.
h
The author modeled five types of cost in this paper: total costs per admission, total costs less taxes per admission, labor costs per admission, non-labor costs per admission, and capital costs per admission. Each model was specified the same and the direction of the effect of profit status was also similar across all models.
i
j
Table 3a-3. Summary of Models and Profit Status Findings for Hospitals Covariates Citation Panel vs. Cross Section Location Years of Data Approacha Specifi-cationb F o r-P rofi t S tatu s Impa ct o n C o st s Outputs Input P r ic es M a rk et P rovi d er Q u ali ty Se v er ity A d ju st er s Rosko (1999) [24] Cross-section National 1994 Two Stage: 1. SFR 2. Tobit Translog
i Rosko (2001a) [25] Panel National 1990-1996 SFR g Translog, RE+
e Rosko (2001b) [26]Cross-section National 1997 SFR Translog
e Rosko (2004) [27] Panel National 1990-1999 SFR Translog, RE
+
Rosko (2005) [28]Cross-section National 1998 SFR Translog ns
Shukla (1997) [29] Cross-section VA 1993 MR h Ad Hoc
+
j Vitaliano (1996) [30] Cross-section NY 1991 Two Stage: 1. SFR 2. MR Cobb-Douglas ns i Zwanziger (2000) [31] Panel CA 1980-1997 MR Translog, FEModel included at least one variable construct in this class of covariates.
a
MR: Multivariate Regression; SFR: Stochastic Frontier Regression; DEA: Data Envelopment Analysis; 2: Chi-Square Test; RDL1: Robust Distance L1 Regression; AMOS: Analysis of Moments Structures; MLR: Multivariate Logistic Regression.
b
RE: Random Effects; FE: Fixed Effects; CES: Constant Elasticity of Substitution; GLF: Generalized Leontief Function.
c
Heckman correction for endogenous affiliation type.
d
The results from this study presented efficiency by profit status but without statistical testing.
e
Hospital admissions or discharges were adjusted by the facility-level average Medicare DRG case mix index; case mix was not included as a separate regressor.
f
First stage probit for endogenous chain membership.
g
This multivariate regression was estimated with endogenous output. Other models were tested with and without endogenous HMO penetration and prices but the direction of the coefficient on profit status was not affected by these alternate
specifications.
h
The author modeled five types of cost in this paper: total costs per admission, total costs less taxes per admission, labor costs per admission, non-labor costs per admission, and capital costs per admission. Each model was specified the same and the direction of the effect of profit status was also similar across all models.
i
One or more variables in this class of covariates was included only in the second stage of this analysis.
j
Table 3b. Summary of Models and Profit Status Findings for Nursing Homes Covariates Author Panel vs. Cross Section Location Years of Data Approacha Specification F o r-P rofi t S tatu s Impa ct o n C o st s Outputs Input P r ic es M a rk et P rovi d er Q u ali ty Se v er ity A d ju st er s Anderson (1996) [32] Cross-section National 1995 Two Stage: 1. SFR 2. 2 Ad Hoc
Chen (2002) [33] Cross-section National 1994 MR b Translog Davis (1998) [34] Cross-section KY 1989, 1991 MR Ad Hoc Hicks (2004) [35] Cross-Section MO 1999 MR Ad Hoc d Knox (2000) [36] Cross-section TX 1994 MR Cobb-Douglas Knox (2003) [37] Cross-section TX 1998 MR Cobb-Douglas Knox (2003) [37] Cross-section TX 1998 RDL1 Cobb-Douglas Mukamel (2005) [38] Panel NY 1991, 1996, 1999 MRc Ad Hoc e Weech-Maldonado (2003) [39] Cross-section SixStates 1996 AMOS Ad Hoc
Model included at least one variable construct in this class of covariates.
a
MR: Multivariate Regression; SFR: Stochastic Frontier Regression; DEA: Data Envelopment Analysis; 2: Chi-Square Test; RDL1: Robust Distance L1 Regression; AMOS: Analysis of Moments Structures; MLR: Multivariate Logistic Regression.
b
The authors modeled endogenous outputs and quality and tested another model without controlling for the endogeneity of quality. There was no difference in the interpretation of profit status in this sensitivity model.
c
The authors modeled three types of cost: clinical costs, hotel costs, and administrative costs. The direction of the for-profit coefficient was the same in all three models.
d
Resident days were adjusted by the facility-level RUG-III case mix index. Case mix was not included as a separate regressor.
e
Inpatient days were adjusted by the facility-level average RUG-II case mix index for the analysis of clinical costs (not included in the models of hotel or administrative costs). Case mix was not included as a separate regressor in this model.
Table 3c. Summary of Models and Profit Status Findings for Other Providers Covariates Citation Panel vs. Cross Section Location Years of Data Approacha Specification F o r-P rofi t S tatu s Impa ct o n C o st s Outputs Input P r ic es M a rk et P rovi d er Q u ali ty Se v er ity A d ju st er s DIALYSIS CENTERS Ozgen (2002) [40] Cross-section National 1997 Two Stage: 1. DEA 2. MLR Output- Costd
c cHOME HEALTH AGENCIES
Gonzales (1997) [41] Panel CT 1987-1992 MR b Ad Hoc
Model included at least one variable construct in this class of covariates. a
MR: Multivariate Regression; SFR: Stochastic Frontier Regression; DEA: Data Envelopment Analysis; 2: Chi-Square Test; RDL1: Robust Distance L1 Regression; AMOS: Analysis of Moments Structures; MLR: Multivariate Logistic Regression.
b
Costs were modeled with and without a quadratic measure of scope of services. The direction of the for-profit coefficient was the same for both models.
c One or more variables in this class of covariates was included only in the second stage of this analysis. d The model includes input costs as well as input levels in the specification of the DEA.
1) What are the most commonly used forms of regression analysis used to model facility-level per case costs? What are the strengths and limitations of these models?
In this section, we review the primary approaches and functional forms used in the papers to examine for-profit ownership and discuss their strengths and weaknesses. There is a
substantial literature comparing the results of various approaches and specifications (e.g., Linna 1998 [4]; Bryce, Engberg and Wholey 2000 [6]). For example, Bryce and colleagues [6] find that the various approaches provide similar results for industry-wide trends, but different results for individual providers. The literature does not provide definitive evidence that one particular approach should be preferred. For example, some authors argue that parametric approaches may work better for industries with well-defined technologies and non-parametric for those that are less precisely defined (such as health services) [6]. However, Kooreman [42] suggests that the various approaches should be viewed as complements.
The reviewed papers provide conflicting evidence on whether and how for-profit ownership affects hospital costs.7 To some extent, the conflicting findings may result from differences in methodology: the approach, the functional form, the specification, and the data used to analyze the relationship of for-profit ownership to costs. Summary Tables 3a-3c display
the models, functional forms and details on the specification for each of the reviewed models. Among the twenty-seven hospital models, sixteen used multivariate regression.8 Ten models relied on stochastic frontier regressions. And the final hospital model relied on the data
envelopment analysis approach. The use of particular approaches was associated with particular functional forms: stochastic frontier models were more likely to use functional forms derived from economic theory while multivariate regression used a mix of ad hoc and theory-based functional forms. There was substantial variation in the specification (i.e., included covariates) in the hospital models.
Multivariate regression was also the primary approach for analysis of the nursing home industry. Six of the nine models used multivariate regression while robust distance (RDL1), analysis of moments structures (AMOS), and stochastic cost frontier (SFR) approaches were each used by only one model. But there was no particular relationship between approach and functional form for nursing homes. There was also less variation in specification among nursing home models.
Approach: The papers in our sample used a variety of approaches to analyze facility-level costs. The utility of various approaches and functional forms has long been debated and the introduction of new efficiency models in the 1990s stimulated further debate [8]. The primary approaches used to examine costs include multivariate regression (MR), stochastic frontier regression (SFR), and data envelopment analysis (DEA). In the summary tables, we collapse a number of different multivariate regression techniques such that this is our broadest category. It includes estimation techniques such as seemingly unrelated regression, weighted least squares, generalized least squares and other approaches. Additional detail on each model’s precise estimation technique is available in Appendix A.
Data Envelopment Analysis. While both DEA and SFR identify a least cost mix of inputs for a given output, they have different strengths and weaknesses [8]. DEA is a non-parametric frontier approach that measures only technical inefficiency [42, 43]. Technical inefficiency focuses on whether the same output could be produced while reducing all inputs proportionally [44].9 The DEA approach identifies a best-practice frontier by comparing the levels of outputs produced to the input costs.10 DEA uses actual observations on each of the providers’ input costs and outputs to trace out the frontier (see Equation 1) [13, 42]. 11 In this model, the providers produce multiple outputs (Y) indexed by i and multiple costs (C) indexed by j. The ratio for provider n* is compared to the ratio for all other providers. The i and j are
non-negative variable weights. The n* term represents the weighted output/cost ratio for
provider n* [13].
(1) Max n* = (iiYin* /(jjCjn*)
Subject to: (iiYin /(jjCjn) < 1
8 We differentiate stochastic frontier regressions from the typical multivariate regression because they identify a frontier.
9 Technical inefficiency indicates that the provider is operating above the unit isoquant (Vitaliano and Toren, 1994). 10
We focus on this specification for this report, but the DEA can also analyze outputs vs. input levels.
11 We review this particular form of the DEA. Alternatively, the DEA model can be specified with outputs and inputs.
(i,j > O)
The estimated inefficiency is based on how far below the efficient frontier the provider operates. The error term, calculated as deviations from the “frontier”, is deterministic and allocated entirely to inefficiency. There is no allowance for measurement error, omitted variable bias, or randomness in estimating the frontier or the individual provider’s inefficiency. This assumption has called into question the reliability of DEA efficiency scores. The concern is that DEA is sensitive to outliers and allows random shocks to determine efficiency [44, 45]. As shown in Equation 1, the DEA approach allows only for costs and outputs, though the model may specify multiple outputs and costs. Other factors, such as for-profit ownership, can only contribute if there is a second stage where the resulting inefficiencies are regressed on provider and market characteristics [13]. Although DEA was a common technique in the early 1990s, we have only two DEA models in our sample because of our review period (1996-2006) and
because of the focus on ownership.
Stochastic Frontier Regression. On the other hand, SFR is a parametric frontier approach that measures both allocative and technical inefficiency [42]. 12,13 Allocative
inefficiency refers to an inappropriate mix of inputs [44]. SFR estimates costs as a function of outputs and input prices as in Equation 2, though in practice, many specifications include other provider and market characteristics. The error term is decomposed into two parts: random shocks () and inefficiency (). The random shock () is two-sided; this stochastic (i.e., random) shock is not allocated to inefficiency because it is out of the provider’s control. But the
inefficiency () is one-sided because it measures shortfalls in reaching expected output [6]. This approach requires specific assumptions about the distribution of the error term. Skinner [46] notes that SFR may falsely identify inefficiencies if key assumptions regarding the error terms are violated.14 But, contrary to concerns, varying assumptions on the error term has been shown to have little impact on the results [27]. Like any parametric approach, the validity of the results is dependent on the proper specification of the model. There is greater risk of misspecification in service industries such as health care than industries with well-defined technologies such as the production of standardized goods [6]. As with other approaches, omitted variables may
inappropriately influence the estimated inefficiencies [8, 45].
(2) C = C(Y, P) e+
Unlike the DEA, the SFR approach can include for-profit ownership in the cost function [25-28].15 In practice, the majority of models chose not to include this measure in the cost function. Instead, they used the SFR to produce inefficiency measures from a specification that
12
Allocative inefficiency indicates that the provider is at the wrong place on the isoquant given the least-cost isocost line (Vitaliano, 1994).
13 SFR models appear to be fairly robust across estimation techniques (e.g., maximum likelihood, corrected OLS, generalized least squares and the fixed effects estimator) (Cormwell, Schmidt, and Sickles, 1990 cited in Bryce, Engberg and Wholey, 2000 [6]).
14
Skinner (1994) focuses on the assumption that the error term () has zero skewness. 15
An exception is a standard fixed effects approach, which will fail to identify time-invariant provider
characteristics. But the estimated fixed effects could then be regressed on time-invariant characteristics including for-profit status.
did not include profit status. The resulting inefficiency measures were then examined by for-profit status in a second-stage multivariate regression or using a chi-squared test [13, 14, 20, 21, 24, 30, 32]. There are differences in the potential implications of this choice. Regressing for-profit status on the error component allows the characteristics in the equation to take precedence. If profit status is correlated with those characteristics, however, then the coefficient estimates will be biased and the inferences regarding the relationship between profit status and efficiency will also be biased.
Technically, both the DEA and SFR approaches can be used to identify individual firms’ inefficiency scores relative to some efficient frontier. One paper in our review did a side-by-side comparison of DEA and SFR, which generated similar findings with respect to the relative efficiency by ownership [14].16 There has been some concern that results for individual firms are highly sensitive whereas results for larger partitions (e.g., for-profit providers) are more stable [6]. Both approaches have been adapted to allow for longitudinal data.
Multivariate Regression. Multivariate regression techniques differ from the frontier approaches because they examine whether there are differences between two ownership groups onaverage. There is concern that this approach is inconsistent with cost minimization [44]. Results present a comparison between the firm and some average rather than the industry best practice. In multivariate regression, for example ordinary least squares (OLS), the error term has a mean of zero. As a result, random deviations can be below the average or above the average [13]. Unlike the SFR approach, multivariate regression does not distinguish deviations due to idiosyncratic shocks from inefficiencies in the cross-sectional models. But, more recently, the use of panel data methods, such as fixed effects and random effects, have been used to
address these concerns. Like SFR, multivariate regressions are parametric and thus subject to bias from misspecification. Skinner [46] argues that panel data allow for a more robust
determination of inefficiency than frontier estimation. But the use of SFR and panel data are not mutually exclusive.
The focus of these models is whether the output levels are being produced in the most efficient (i.e., least cost) manner [43]. But this assumes that output is well-specified. This is not easy to do with health services, where providers offer a multitude of complex services that may differ in observable and unobservable quality. Likewise, there may also be sorting across hospitals in case mix severity that are not captured by facility-level case mix and yet may
influence the cost of providing care. If these differences are correlated with profit status and not fully accounted for in the model, the results may be suspect. Of course, it is also the case that misspecification of multivariate regression models can bias results. But there may be greater concern with frontier methods because the bias influences both the individual and the frontier [8, 13]. In two papers, Rosko [26, 27] tested the choice of approach and found that the SFR was more appropriate than the multivariate regression.17
Table 4 summarizes the key attributes of each approach in terms of the requirements for functional form, the identification of a best practice frontier, and the treatment of and
distributional assumptions on the error term. To summarize, the primary difference among these
16
Bryce, Engberg and Wholey (2000) [6] and other papers also make comparisons across approaches, but these were not included in the review because there was not a focus on ownership.
17
In these cases, the test examined whether the variance of the inefficiency-effects () represented a non-zero share of the total variance of the error (+).
approaches is that DEA and SFR identify “efficient” best practice frontiers, while multivariate regression techniques identify an average efficiency. But SFR and MR are parametric: they impose a functional form on costs that may incur bias if specified incorrectly. However, flexible functional forms (such as the translog) can limit the potential harm from misspecification.18 By contrast, the DEA is non-parametric. With respect to the error term, DEA treats the error as deterministic so that any deviations are completely allocated to inefficiency; there is no
allowance for random shocks. But DEA does not impose strict distributional assumptions on the error. By contrast both SFR and MR allow for idiosyncratic or random shocks, but SFR imposes a distribution on the error term that may or may not be appropriate.
Table 4: Attributes of Technical Efficiency Models
DEA SFR MR
Imposes Functional Form N Y Y
Defines best-practice frontier Y Y N Treats error term as stochastic N Y Y Imposes distribution on error N Y N
Source: Adapted from Bryce, Engberg and Wholey (2000) [6].
Functional Form: The most common functional forms found in the literature review are the translog, Cobb-Douglas and ad hoc forms. These are broad categories, which we use to summarize the forms used in the included papers. However, some authors used variations on these models by including additional variables and restricting certain coefficients (in order to reduce the number of parameters estimated). In other cases, the models were adapted to longitudinal (panel) data by including fixed or random effects. In this section, we briefly describe how the general forms are related, their strengths and weaknesses, and how their specifications of costs might influence the findings.
A provider’s efficiency can be considered in two ways: the provider maximizes his output (Y) given a particular budget constraint, or the provider minimizes costs for a given output level. A simple production function may be specified as a function of its inputs, which can consist of elements such as capital (K) and labor (L) as in Equation 4.
(4) Y = f(K,L)
The primary problem with using the production function to determine relative efficiency or productivity is that the inputs are not exogenously determined – providers can choose the mix of inputs they use. A common solution to this endogeneity issue is to estimate a cost function (C) instead of the production function. For a well-behaved neoclassical production function, there exists a unique cost function such that cost is a function of the input prices (PK, PL) and of
output levels as in Equation 5.19,20
18 We discuss the translog in the next section on functional forms.
(5) C = f(PK,PL,Y)
Estimation of the cost function is preferable to the production function in industries where it is reasonable to assume that the variables in the cost function are exogenously
determined. This assumption makes two requirements. First, the provider is a price-taker – that is, any single provider is unable to influence input prices. Second, the level of output is
exogenous because the provider must supply services to everyone at a price that is
predetermined, difficult to change, and often not determined by the provider.21 In reality, the exogeneity of many regressors is not a foregone conclusion. For example, the provider can indirectly set output by varying the quality of output. That is, to the extent that patients make decisions about their consumption of a particular service based on the quality, then a provider’s decision to lower quality will lower its demand and consequently output.
Given that the authors are focusing on costs rather than production, the specification of a particular functional form also requires consideration because it may impose restrictions on the findings. For example, the Cobb-Douglas functional form, which includes only a linear function of outputs and prices, is restrictive in that it implies that the elasticity of total cost with respect to output is constant regardless of provider size. As a result, if there are economies of scale, there will be economies of scale for all output levels and the average cost schedule will be declining for all outputs. On the other hand, the translog is a more flexible functional form. But it imposes more significant data requirements to estimate the greater number of parameters, data on input prices and shares, as well as more sophisticated estimation techniques for the simultaneous estimation. We describe the three main functional forms below.
Transcendental Logarithmic (Translog). A flexible functional form for costs is the transcendental logarithmic (translog) function. This is a second order Taylor approximation that allows interactions between multiple outputs and inputs [47].22 Equation 6 demonstrates a translog cost function for a multiproduct firm.23 This flexible form has been preferred in a
20 That is, the function must be monotonically increasing in inputs, continuous, concave, and have the property that only the null output is producible from zero inputs.
21 This is parallel to the common carrier condition in the railroad industry where many cost models were developed. 22
A concern with a multiproduct translog is that some providers may not produce some of the outputs. In such cases, a Box-Cox transformation can be used. Alternatively, a dummy for zero output can be used (Engberg, Wholey, Feldman, and Christianson 2004 [47]).
23 This translog functional form requires constraints to guarantee a proper cost function. To insure linear
homogeneity in input prices (that is, doubling output doubles costs and all interaction effects with prices are zero): ini = 1 for all i
jnij = 0 for all i,
ini = 0 for all j.
The coefficients must also be symmetric to insure that the function is well-behaved in its second derivatives: ij=ji for all i and j, and
number of studies because it eases concerns regarding misspecification in parametric approaches [6]. This is important for SFR and multivariate regression. Subject to the restrictions imposed by the model, coefficients on output measures can be used to assess returns to scale and scope.24 The inclusion of second-order terms in the translog allows the cost elasticities for output and for input prices to vary as output and prices change, thus easing the restriction imposed by the Cobb-Douglas form. Economies of scale can vary based on the operating point.25 A potential issue with the translog is the number of parameters that must be estimated. Newhouse [8] notes that this is particularly problematic for the health industry where providers produce multiple outputs. Knox and colleagues [36], Chirikos [13], and Vitaliano and Toren [30] cite problems with estimating the translog form such as poor fit and the inability to generate precise parameter estimates.
(6) c = 0 + imi yi +ini pi + imjmij yiyj + injnij pipj+imjnij yipj+
where:
c = log total cost
y = log of output i (e.g., days, discharges)
p = log price of input j (e.g., wages, prices of capital)
Cobb-Douglas. The Cobb-Douglas cost-function is a special case of the translog cost function where the coefficients on the interaction terms, ij,ij, and ij, are set equal to zero. The
resulting cost function is simply a linear function of output and input prices with no interaction terms. For a provider that produces multiple outputs and uses multiple inputs, the Cobb-Douglas form is specified as in Equation 7. The key benefit of the Cobb-Douglas is that it significantly reduces the number of coefficients and consequently the necessary sample size.
(7) c = 0 + imi yi+ini pi
The preceding discussion focuses on the most basic forms of translog and Cobb-Douglas cost functions. Equations 6 and 7 are the simplest forms of these functional forms and follow directly from the production function. However, in the reviewed papers, the specifications are often adapted or simplified functions. In practice, the models also include regressors, other than
If available, the input share equations should be estimated simultaneously to improve the precision of the estimates. The input share equation is:
c/pi = (c/pi) (pi/c) = (pixi/c) = si si = i + jnij yj + jnij yj
24
Economies of scale measure how costs change relative to changes in output; economies of scope measure production synergies across multiple outputs.
input prices and outputs, which are hypothesized to influence costs. These typically include characteristics of the output (e.g., percent Medicare) as well as behavioral factors describing the provider and market. Profit status of the providers is one example. Other manipulations are also apparent. Some authors simplify the translog form in order to reduce the number of parameters for estimations by eliminating some of the higher order terms. In some cases this is partly motivated by inadequate sample size. In cases with longitudinal data, authors have also included random or fixed effects to control for unobservables.
Three papers explicitly tested the choice of functional form to determine if the
restrictions imposed by Cobb-Douglas were appropriate. Rosko [26-28] found that translog was more appropriate than the Cobb-Douglas.
Ad Hoc. A number of papers did not rely on the economic theory of cost minimization. These “ad hoc” models did not evolve from the theory of the duality of production and costs. Rather, the ad hoc specifications simply test hypothesized behavioral relationships. This is a much more informal approach to estimating costs, but the models often do rely on some theory. For example, some papers cite the market structure-conduct-performance (SCP) paradigm [48, 49] to support the inclusion of market competition measures (e.g., Ozgen and Ozcan [40]; Rosko [24]).
In addition to the assumptions underlying their cost specification, many papers using a variety of approaches and functional forms implicitly or explicitly call on property rights theory to support the inclusion of profit status as a determinant of costs (e.g., Rosko [24]).
Fixed and Random Effects. So far, the discussion of the approach and functional form has ignored the issue of time. But longitudinal data on the same provider across years creates opportunities to use more sophisticated techniques for identifying the relationship of interest. Skinner [46] and Dor [45] argue that panel data techniques can be used to develop more robust estimate of inefficiencies. The methods described above have all been adapted to allow for panel data. Two options are common: fixed effects and random effects. With multiple observations on each provider, it is possible to estimate a fixed effects specification. The fixed effects are
essentially provider-specific intercepts. The provider-specific intercepts allow the authors to remove the time-invariant unobservable component of the error term thereby distinguishing time-invariant inefficiencies from idiosyncratic shocks. Fixed effects estimation has the advantage of not requiring that the time-invariant unobservables are uncorrelated with the covariates. But this approach also assumes that all of the time-invariant unobservable is inefficiency.26
An alternative to fixed effects is random effects.27 Random effects may be more suited for panel data with larger samples, but shorter time periods [11]. However, it relies on the stringent assumption that the firm unobservables (e.g., managerial ability) are not correlated with other regressors (e.g., output, quality). This is a more restrictive assumption than that required for fixed effects. In fact, Carey [12] performs a Hausman test that rejects the assumption of no correlation for her standard random effects model. But two additional models use correlated
26 Later papers use “enhanced fixed effects”. For example, Bryce et al. (2000) add fixed effects and a firm-specific time trend.
27 Random effects is also called 'variance components' and is similar to a hierarchical linear model in that it requires the same more restrictive assumption than fixed effects.
random effects (instead of standard random effects) to address correlation between observables and the individual effect [11, 12].
The use of panel data also touches upon the issue of specification. Not all characteristics that influence costs can be observed or measured. For example, there is no variable to capture managerial ability. Yet clearly, this influences costs. Panel datasets offer an opportunity to address some unobservable influences; in effect the time-invariant unobservables are differenced out. There is only one fixed effects model described in this review [31]. A number of papers we included in this review also reported the results of fixed effects models but because they did not include profit status in those models, we do not discuss them here. As ownership is generally a time-invariant characteristic, it was excluded from the standard fixed effects specification because it could not be identified. The model we report by Zwanziger and colleagues [31] is an exception because this model interacted ownership with dummy variables for year. It would also be possible to regress ownership type on the inefficiencies calculated in panel frontier models in a second-stage analysis, but we did not find any models that did so.
2) What are the most widely used standardized costs per case measures? What are the strengths and limitations of these measures?
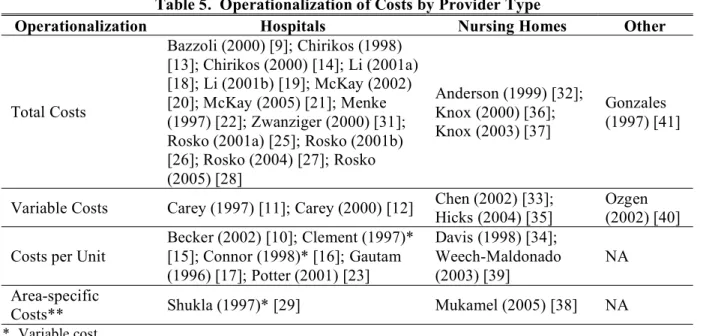
Most models use total cost as a dependent variable. Not all authors define this term, but Chirikos [13, 14] specifies “total cost” as a composition of wage and salary payments, other expenses in patient care, capital costs, and interest. Knox [36, 37] also denotes in this category the inclusion of contract personnel, utilities, maintenance, taxes and insurance. Variable (operating) costs are also common, defined by Hicks [35] as related to patient care, ancillary services and administration. The key difference between total and variable costs is generally fixed costs. A subset of models used average cost measures – these measures normalize (i.e., divide) facility costs by varying units (e.g., number of admissions, discharges or patient days). Two authors break costs down by expense type, estimating separate models for several cost components. Shukla [29] estimates models for labor, non-labor, capital, and other costs. Mukamel [38] breaks costs out by clinical activities (patient-related costs), hotel activities, and administrative activities. Cost operationalization does not seem to vary by facility type, as illustrated in Table 5.
The use of average cost measures, such as per case costs, can be useful in addressing problems of multicollinearity and heteroskedasticity. But they impose restrictions on the
relationship between costs and output that are particularly troublesome in multiproduct industries [50]. For example, if a provider produces both patient days and patient discharges, is the proper measure cost per day or cost per discharge? This can have implications for the results if
hospitals differ systematically in their length of stay.
Using total or variable costs as the dependent variable and including both output
measures as regressors allows for more flexibility.28 Cost measures, such as facility-level total or variable costs, are often used in cost studies to avoid imposing a specific and potentially
inappropriate cost-output relationship. Not surprisingly, these measures are most common in our review. Earlier, we outlined why a cost function can potentially be useful to examine efficiency because of the duality with the production function. A necessary assumption to validate the cost
analysis is that the provider minimizes long-run costs. This assumption depends on whether providers are able to optimize with respect to capital. Capital investment may be a long-run process that does not allow for changes within the usual observation windows or the industry may be undergoing changes which limits the ability to optimize [51, 52]. If the providers are not in long-run equilibrium, the duality of production and long-run costs does not hold. A solution is to specify a model where the provider minimizes short-run costs (generally, variable costs or operating costs) conditional on a level of capital. The basic difference in the model is that the regression should include the level of capital rather than the cost of capital.
Table 5. Operationalization of Costs by Provider Type
Operationalization Hospitals Nursing Homes Other
Total Costs Bazzoli (2000) [9]; Chirikos (1998) [13]; Chirikos (2000) [14]; Li (2001a) [18]; Li (2001b) [19]; McKay (2002) [20]; McKay (2005) [21]; Menke (1997) [22]; Zwanziger (2000) [31]; Rosko (2001a) [25]; Rosko (2001b) [26]; Rosko (2004) [27]; Rosko (2005) [28] Anderson (1999) [32]; Knox (2000) [36]; Knox (2003) [37] Gonzales (1997) [41]
Variable Costs Carey (1997) [11]; Carey (2000) [12] Chen (2002) [33]; Hicks (2004) [35]
Ozgen (2002) [40] Costs per Unit
Becker (2002) [10]; Clement (1997)* [15]; Connor (1998)* [16]; Gautam (1996) [17]; Potter (2001) [23] Davis (1998) [34]; Weech-Maldonado (2003) [39] NA Area-specific
Costs** Shukla (1997)* [29] Mukamel (2005) [38] NA
* Variable cost
** Models’ cost measures (long or short-run) vary by model.
3) What are the most widely used severity adjusters? What are the strengths and limitations of these adjusters?
In this section, we begin by describing the types of case mix/severity adjusters included in the models we reviewed and address the strengths and limitations of the different approaches to measuring case mix. We also include a discussion of the model specifications more generally, describing commonly used model covariates within the following classes: outputs, inputs,
provider characteristics, market characteristics, and quality. We then describe their general association with costs and the strengths and limitations of different specification approaches.
Table 6 summarizes the types of case mix indices included in the models we reviewed, organized by provider setting. Although we generally treat the regression model as the unit of analysis in this review, this table summarizes case mix information at the level of the paper. If more than one model was included in the paper and both controlled for case mix, the case mix measure was operationalized the same in all models. Therefore, we do not distinguish
specification at the model level here. Of the 23 papers focusing on the hospital industry, 19 included some form of case mix adjustment. The most common case mix adjustor was the facility-level Medicare DRG case mix index; nine papers used this measure. One paper included a case mix adjustor but did not describe how it was operationalized. Five papers did not include