THE EFFECT OF COMPUTER-ASSISTED INTERVENTION PROGRAMS ON MATHEMATICS ACHIEVEMENT OF HIGH SCHOOL STUDENTS IN A VIRTUAL
SCHOOL
by
Brandi Rachelle Robinson Liberty University
A Dissertation Presented in Partial Fulfillment Of the Requirements for the Degree
Doctor of Education
Liberty University 2020
THE EFFECT OF COMPUTER-ASSISTED INTERVENTION PROGRAMS ON MATHEMATICS ACHIEVEMENT OF HIGH SCHOOL STUDENTS IN A VIRTUAL
SCHOOL
by Brandi Rachelle Robinson
A Dissertation Presented in Partial Fulfillment Of the Requirements for the Degree
Doctor of Education
Liberty University, Lynchburg, VA 2020
APPROVED BY:
Dr. Philip Alsup, Committee Chair Dr. Kathy Keafer, Committee Member
ABSTRACT
The United States ranks in the middle of the nations participating in the Programme for
International Student Assessment, and secondary education has not seen growth in mathematics achievement since the 1970s. Computer-assisted math education offers a new opportunity to increase mathematical achievement with students. Pearson Education’s MyMathLab has shown promise at the higher education level with enhancing student proficiency in concepts. The purpose of this study was to determine if the use of Math XL, the secondary counterpart to MyMathLab, could increase mathematics achievement, measured by the performance on the end-of-course test for Algebra I and Geometry for high school students in a computer-assisted math intervention program. The quasi-experimental posttest-only study enhanced the current knowledge of MyMathLab/Math XL as a tool for higher education and demonstrated the effects of using it at the secondary level. The sample was taken from high school Algebra I and
Geometry students at an online high school in a southern state. A comparison group was created from students meeting the same criteria for the computer-assisted math intervention program who chose not to participate. An analysis of variance was used to test for statistically significant differences in the end-of-course test scores in those students enrolled in a computer-assisted math intervention program and those students not enrolled in a computer-assisted math intervention program. The analysis found no significant difference in the mean between the group enrolled in computer-assisted intervention and those not enrolled.
Keywords: computer-assisted technology, response to intervention, active learning theory, mathematics achievement, MyMathLab.
Dedication
I dedicate this work to my husband, who has been steadfast throughout this journey. He has endured life with a perpetual student, never really knowing what it is like not to have a wife in school. He has bought portable chargers, drove so I could do schoolwork, and put his goals second to my schooling. He has experienced life as a swim dad, where mom is on the computer until her son’s heat. He has always been my biggest supporter, never doubting that I would make it to the final part of this journey.
I dedicate this work to my children. To Jacob, who taught me to dream big and work hard. His own acting career and his positivity in the face of rejection taught me to be fearless in the pursuit of my dreams. To Sara-Rachelle, our tiny dancer, who inspires me daily with her challenges of being on the autism spectrum. She handles her challenges with grace and works tirelessly toward her goal of being a prima ballerina. She has taught me the true meaning of perseverance. To Mae Mae, who never fails to be her own person and never conforms to the expectations of society. She has taught me to be secure in my own identity and to value individuality.
I dedicate this to my parents and grandmother, who read stories of girls that became a President to me as a child. They have supported my journey and stretched me as they provided for me to attend Louisiana School for Math, Science, and the Arts, where I first learned to love academics.
I could not have done this without the support of my family and friends. Each of them fills in the pieces to our puzzle of beautiful chaos.
Acknowledgments
Thank you to my chair, who endured years of me making little progress as I fought to balance a dissertation with a challenging family life. Thank you for your support, advice, and willingness to answer many questions and be supportive of my journey. Thank you to my committee members for your input, encouragement, and stretching me to become the best version of myself. Thank you to Dr. Brown, who, at my first on-campus interaction, spent time with me drinking coffee in the morning before class and praying over me. Your words
“emotionally attached to graduation” became a hashtag for my journey and a credo for when I felt discouraged. Thank you to LeAnna Wilson who has cheered me on through this journey, challenged my self-perception, shown me how to continue to raise the bar, and has always made it a point to ask how it is going. Thank you for keeping in touch and being a part of this when I hear those magical final words “Dr. Robinson.” Thank you to Pearson Online and Blended Learning for valuing education and financially paving the way for me to complete this journey.
Table of Contents ABSTRACT ... 3 Dedication ... 4 Acknowledgments ... 5 List of Tables ... 9 List of Figures ... 10 List of Abbreviations ... 11
CHAPTER ONE: INTRODUCTION ... 12
Overview ... 12 Background ... 12 Historical Context ... 13 Social Context ... 15 Theoretical Context ... 16 Problem Statement ... 18 Purpose Statement ... 19
Significance of the Study ... 20
Research Questions ... 21
Definitions ... 22
CHAPTER TWO: LITERATURE REVIEW ... 23
Overview ... 23
Theoretical Framework ... 23
Related Literature ... 27
Accountability ... 30
Special Education in Online Schools ... 33
Domestic Math Achievement ... 35
International Comparison of Math Achievement ... 39
Gender Gaps ... 42
Response to Intervention ... 43
Computer-Assisted Learning ... 44
Summary ... 48
CHAPTER THREE: METHODS ... 51
Overview ... 51
Design ... 51
Research Questions ... 52
Hypotheses ... 52
Participants and Setting ... 52
Instrumentation ... 54
Procedures ... 55
Data Analysis ... 57
CHAPTER FOUR: FINDINGS ... 59
Overview ... 59
Research Questions ... 59
Descriptive Statistics ... 59
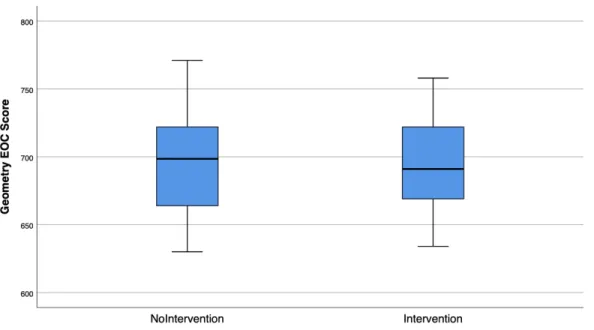
Geometry ... 61
Results for Geometry EOC Score ... 63
Data Screening ... 63
Assumption Testing ... 64
Null Hypothesis One ... 65
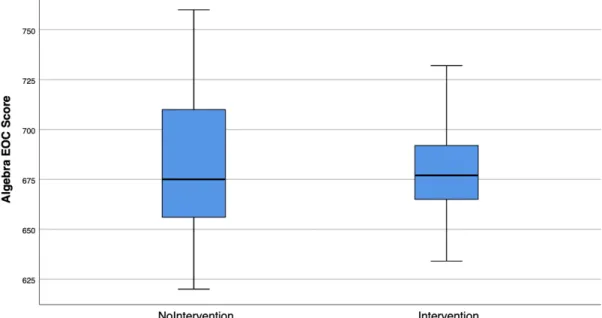
Results for Algebra EOC Score ... 65
Data Screening ... 65
Assumption Testing ... 66
Null Hypothesis Two ... 67
CHAPTER FIVE: CONCLUSIONS ... 68
Overview ... 68
Discussion ... 68
Findings for Research Question One ... 70
Findings for Research Question Two ... 70
Discussion Based on Theory ... 70
Discussion Based on Previous Research ... 72
Analysis of the Research Question Findings ... 75
Implications ... 76
Limitations ... 79
Recommendations for Future Research ... 81
REFERENCES ... 83
APPENDIX A: Principle Consent ... 92
List of Tables
Table 1. Composition of Geometry by EOC Scores ... 57
Table 2. Descriptive Statistics for Geometry EOC Scores ... 58
Table 3. Composition of Algebra by EOC Scores ... 58
Table 4. Descriptive Statistics for Algebra EOC Scores ... 59
List of Figures
Figure 1. Boxplot of geometry EOC scores ... 60 Figure 2. Boxplot of algebra EOC scores ... 62
List of Abbreviations
The following are a list of abbreviations for wording used within this dissertation: • analysis of variance (ANOVA),
• Center for Research of Educational Outcomes (CREDO), • end-of-course (EOC),
• institutional review board (IRB),
• International Association for the Evaluation of Educational Achievement (IEA), • Louisiana Educational Assessment Program (LEAP),
• National Center for Education Statistics (NCES),
• Organization for Economic Cooperation and Development (OECD), • Programme for International Student Assessment (PISA),
• process-oriented guided inquiry learning (POGIL), and • response to intervention (RTI).
CHAPTER ONE: INTRODUCTION Overview
The background information on mathematics achievement and computer-assisted learning is presented in Chapter One, which highlights the historical, social, and theoretical context for this causal-comparative study. Chapter One includes the problem statement, significance of the study, research questions, and definitions pertinent to the topic.
Background
The United States consistently scores lower than other countries in mathematics achievement and readiness for mathematics in higher education (Lee, 2012; NCES, 2015a; OECD, 2013). The Programme for International Student Assessment (PISA) is a worldwide assessment that seeks to measure the educational systems in various countries by testing students who are roughly 15 years of age. The results are analyzed by country, and a ranking is released as a part of the results. According to the OECD (2013), the United States performed below the average score on the PISA in 2006 and fell even further below the average in 2012.
Approximately 6,000 students took the PISA in 2012 representing 161 schools (NCES, 2008; OECD, 2013). The United States has experienced a crisis in international education rankings and competitiveness according to these benchmarks. American students may lack the readiness in mathematics to pursue a post-high-school degree from a higher education institution and, in some cases, even graduate (Lee, 2012). As a result, universities have increased the number of remedial mathematics classes offered (Vilardi & Rice, 2014). In fact, Gresham and Little (2012) determined that about 20-25% of students in the American secondary education system need additional services to be successful in the mathematics classroom. These students often fall under special education or response to intervention (RTI). Computer-assisted technology
programs offer a way to increase mathematics achievement in general classrooms and computer-assisted math intervention programs. Using computer programs, students identify deficiencies in performance from interaction with the program (Demir & Basol, 2014). This rich feedback can be used to satisfy the requirements of RTI legislation and drive individualized instruction for students in an RTI program (Demir & Basol, 2014). Studies have shown an increase in mathematics achievement with the use of computer-based learning programs, enabling an increase in individualized instruction without the addition of a large number of teachers (De Witte, Haelermans, & Rogge, 2014; Wilder & Berry, 2016; Ye & Herron, 2012).
Historical Context
According to the NCES (2015a), in 2012, the average score for mathematics achievement in 17-year-olds did not vary measurably from scores in 1971. Additionally, scores in 2012 showed no measurable change from those in 2008. This may indicate a lack of achievement growth for the United States. Wagner (2008) cited repercussions of the achievement gap in science, technology, engineering, and mathematics (STEM) fields and described the lack of preparedness for higher-paying jobs based on the low achievement in STEM fields not preparing students for postsecondary education. Despite knowledge of this gap and the repercussions, achievement did not increase from 2008 to 2012, according to the NCES (2015a). In addition, as Lee (2012) showed, American students as a whole are not adequately prepared for higher
education. Based on the NCES results, this could imply that students remained unprepared for the pursuit of higher education, as in 2008, scores did not change. Additionally, it is estimated that 80% of students are successful in the general education classroom; however, that leaves another 20% who should be addressed through RTI or special education services. Despite the
low performance in the studies provided by Lee (2012) and NCES (2015a), 20% will not complete the math curriculum in a standard classroom without assistance (Kuo, 2014).
Before 1975, students with disabilities were a largely unaddressed segment of the educational population. Special education gained ground in 1975 with Public Law 94-142, which stated that all children with disabilities would have a right to an appropriate education (Antrim & Robins, 2013). This was taken a step further in 2004 when RTI was written into the Individuals with Disabilities Education Act (IDEA). The RTI portion of the law requires a system that uses performance data to drive instruction and a problem-solving approach that enhances student learning (Turse & Albrecht, 2015). The use of a computer learning program accomplishes this goal by bringing the focus to the students’ individualized needs and
identifying deficits. A computer-assisted learning program can also create a tailored plan to address students’ deficits, which meet the requirements of RTI legislation or can assist a struggling mainstream student (Demir & Basol, 2014). Initially, RTI was in response to test scores; however, today, many educators also see this as a way to help students achieve grade-level expectations or bridge deficits in a content area. While RTI was written into the law, it did not include a legal mandate for districts to implement the process. Thus, the process is widely varied between programs. The common components include identifying students who have deficits in math and placing them in the appropriate intensity level and frequent monitoring of students’ progress (Antrim & Robins, 2013). Regulation of RTI is lacking due to multiple delivery methods for an intervention. Schools have many choices of programs and the manner in which they implement an intervention program for each discipline (Daly, Martens, Barnett, Witt, & Olson, 2007). Lawmakers were committed to the idea so intently that they allowed districts with disproportionate representation of special education students to use up to 15% of their
federal special education funding for RTI (Antrim & Robins, 2013). In RTI, the computer applications are utilized to practice repetition to master concepts, as well as to construct new knowledge when a slight variation in the problem occurs (Abbas, Lai-Mei, & Ismail, 2013). RTI serves not only special education students but also struggling students.
In the RTI program, students who cannot reach the benchmarks for the course are identified before they fail. Some students involved in intervention programs are simply low-performing for that content area and are not necessarily learning disabled. A learning disability does not predict placement in RTI. (Daly et al., 2007). The goal of RTI is to bring students to the grade-level expectations of a course (Antrim & Robins, 2013). By doing this, more students see an increase in math achievement to bridge the international gap and to prepare for higher learning (Lee, 2012; OECD, 2013).
Social Context
The estimated success rate of students in a math curriculum is 80% (Kuo, 2014). However, that leaves another 20% who may benefit from RTI or special education services (Kuo, 2014). This is applicable to the virtual environment as well as the traditional classroom. While RTI was being implemented in 2004 (Antrim & Robins, 2013), trends on the PISA and findings from the NCES indicated that gaps were not being adequately addressed (NCES, 2008; NCES, 2015a; OECD, 2013). These gaps have led to a lack of readiness for higher education (Lee, 2012). As Wagner (2008) explained, the lack of preparedness for mathematics at a postsecondary level continues to perpetuate the lack of STEM-field graduates. This leaves the United States with shortages in key fields such as engineering, medicine, technology, and others. In addition, Wagner (2008) indicated that for individuals to be successful in society, they need some sort of postsecondary education. Wagner estimated that 85% of jobs require postsecondary
education and this is expected to continue to grow. If the school system does not adequately prepare students for postsecondary education, this can result in citizens taking lower-paying jobs and a lower tax base for the nation.
It is possible that a computer-assisted learning program, in a virtual school setting, would offer a way to individualize instruction for disadvantaged schools and students who require additional help to be successful in the traditional math classroom without adding more grading responsibility and lesson planning to teachers (Vilardi & Rice, 2014). It would also aide in providing individual instruction to students without needing to increase the number of faculty present at a disadvantaged school. The body of knowledge regarding computer-assisted learning programs should be expanded to close, at least some of, the global achievement gap in
mathematics. By closing the gap, graduates of secondary schools are better prepared to pursue postsecondary education and, therefore, would be able to support themselves better by having higher-paying jobs.
Theoretical Context
Peirce (1982) fathered the idea of active learning theory, a student-centered instructional strategy that uses process oriented guided learning (POGIL). His theory is similar to that of Vygotsky, and some even believe that Charles Peirce influenced Vygotsky’s theories. Peirce’s work predates that of Vygotsky and is more closely related to the interaction between a guiding force as an inquiry-based learning strategy (Chesters, 2012). This differs from other hands-on theories, as Peirce examined teaching using an inquiry model that does not necessarily involve hands-on activities and experiences. Although most of his papers were published after his death, Peirce is still credited with fathering active learning theory. Peirce advocated guided inquiry learning as opposed to direct instruction, as well as continuity of experience by participants,
comprising a foundation to be built on in the classroom. Peirce believed that teachers should not give direct instruction to students but should guide them with thought-provoking prompts that allow the students to make conclusions of their own (Liszka, 2013). Peirce explained that if someone only learned from books, then the concepts would react incompatibly when a student needed to apply them to the real world (Buchler, 2016).
Recently, active learning theory has come to the forefront of educational discussions with regard to the use of computer-assisted technology in mathematics classrooms (Gulwani, 2014; Lerman, 2012). Active learning theory centers around active learning, not passive processes such as lecturing (Liszka, 2013). Active learning theory drove this study, as the use of a computer-assisted learning program allowed the students to interact with the software to learn the material as they worked through assignments (Gulwani, 2014). Students were in a virtual setting and as such have an option at a computer-assisted math intervention program to supplement the standard curriculum. In the program, students complete guided inquiry designated by the instructor or the program itself to master areas of deficit in mathematics (Demir & Basol, 2014; Wilder & Berry, 2016; Ye & Herron, 2012). Generating dynamic problems for practice consumes valuable time for the teacher. It takes time away from other instructional tasks; however, computer-assisted learning programs can generate large databanks of problems with specific characteristics for solving. This allows the instructor to bring more focus back to student-centered learning and utilizing the program for additional inquiry-based learning, which allows students to ask for help or see examples of problems as they complete assignments. By asking for help, through the software, students learn more than with textbook problems, as they can continue to practice based on their own inquiries.
Computer-assisted learning programs can provide immediate feedback to a solution, whereas a teacher needs time to grade (Vilardi & Rice, 2014). This process has the potential to give students nearly unlimited practice with the concept and to receive instantaneous feedback on solutions. Computer-assisted learning programs also fit the description of POGIL (Moog & Spencer, 2008). Through the repetition available in the computer-assisted learning programs, students can put a greater focus on understanding the more complex concepts as procedures become rote (Doerr & Zangor, 2000). Furthermore, a computer-assisted math intervention program forms a continuity of experience as required by Peirce (1982) for active learning to take place.
Problem Statement
Secondary math achievement in the United States continues to remain below
international expectations and the preparation level for postsecondary education (Lee, 2012; NCES, 2015a; OECD, 2013). While research concerning math intervention proliferates (Demir & Basol, 2014; Ye & Herron, 2012; Vilardi & Rice, 2014), research has largely neglected the secondary level implementation of computer-assisted learning programs. A handful of studies exist at the elementary and higher education levels on the use of computer-assisted technology to increase mathematics achievement (Hu et al., 2012; Wilder & Berry, 2016; Ye & Herron, 2012). Studies at the university level have shown a positive relationship between the use of MyMathLab (the higher education version of Math XL), or similar programs, and math achievement (Demir & Basol, 2014; Ye & Herron, 2012). A small number of studies have shown a negative impact. In this study, the students who utilized computer-based learning methods scored lower in a college math course than those who attended a traditionally instructed course (Vilardi & Rice, 2014). A small amount of scholarly research exists on the effectiveness of computer-based math
programs used to increase mathematical achievement for grades 9-12. Several small sample studies have been completed using various computer-based learning programs to work to increase mathematical achievement. Students worked after school or in alternate classroom settings with computer-based learning programs as supplements to instruction (De Witte et al., 2014; Wilder & Berry, 2016). NCES (2015a) reported the largest gap in math achievement at the secondary level; however, available studies lack information on the application of computer-assisted learning programs at the high school level. The problem is that while secondary mathematics achievement in the United States is low, and current literature calls for better interventions to increase math achievement, little is known about the effectiveness of interaction-based programs designed to increase math understanding.
Purpose Statement
The purpose of this causal-comparative study was to determine if the use of a computer-assisted learning-based intervention program increases mathematics achievement at the
secondary level. Mathematics achievement was the dependent variable and was defined as the score on the EOC exam. The variable was measured by the achievement score (i.e., needs improvement, fair, good, or excellent) on the Algebra I or Geometry EOC test (Louisiana Department of Education [LDOE], 2015). This achievement score was determined and measured by the grade in the course and performance on the EOC test for Algebra I and
Geometry students. Mathematics achievement was examined based on the performance on the state EOC test for the particular subject. The study utilized the independent variable of
computer-assisted learning-based intervention, which was defined as the use of a computer-based math learning program. This variable was measured by whether students opted into an
programs allow for quality interaction for students within the software that guide students with tools that explain key concepts or show step-by-step solutions (Demir & Basol, 2014).
Significance of the Study
This study is important to secondary education, as it examined the difference in math achievement between online instruction only and supplementing online instruction with computer-assisted learning programs. According to NCES (2015a), educational methods
employed in mathematics from 1971 to 2012 failed to increase math achievement in 17-year-old students. Computer-assisted learning programs have the potential to improve math achievement in a secondary education setting, as seen by studies conducted at the postsecondary level (Hu et al., 2012; Wilder & Berry, 2016; Ye & Herron, 2012). Additionally, studies have shown improvement at the elementary level through the use of computer-assisted learning programs to increase the retention of procedural problems and operations (Burns, Kanive, & DeGrande, 2012; Hu et al., 2012). Wilder and Berry (2016) demonstrated successful integration of a computer-assisted learning program in secondary math for Algebra I. Their study demonstrated higher retention for those students who used the emporium course with integrated computer-assessed learning resources to engage in active learning. This study built on the preceding by examining targeted assignments and outcomes for Algebra I and Geometry in terms of
standardized test scores. By improving these scores, students have better access to higher education preparatory courses to lead to more productive jobs and better quality of life through higher-income jobs.
More research is needed to determine the relationship between the use of computer-assisted learning programs and student achievement at the secondary level. RTI programs also call for rich feedback and continual assessment of student skill levels. Valid, reliable, and
accurate implementation of RTI plans is necessary for student success (Martinez & Young, 2011). A computer-assisted learning program provides detailed reports to the instructor that can guide further instruction (Demir & Basol, 2014). The focus of this study was to understand better the connection between a computer-assisted learning program and a RTI program to increase mathematic achievement for struggling students. As well as to examine whether Math XL, a common computer-assisted learning program, could increase mathematics achievement. As a result of research at the secondary level, key stakeholders in RTI, special education, and even the general classroom have more information on the integration of technology in the math classroom and its relationship to math achievement.
Results from this study could influence intervention practices locally, as well as on a larger scale. Social and behavioral skills in the classroom could also be affected by this study. In several studies, researchers have found a relationship between academic skills and social behaviors. Students who scored higher on tests and have higher averages in coursework have better social, emotional, and decision-making skills (Algozzine, Putnam, & Horner, 2012). An effective intervention program could positively affect student behavior due to increased
academic achievement.
Research Questions The following research questions guided this study:
RQ1: Is there a statistically significant difference in mathematics achievement as measured by the Louisiana EOC test between students in Algebra 1 who receive computer-assisted math intervention and students who do not receive computer-computer-assisted math intervention?
RQ2: Is there a statistically significant difference in mathematics achievement as measured by the Louisiana EOC test between students in Geometry who receive computer-assisted math intervention and students who do not receive computer-computer-assisted math intervention?
Definitions
The following definitions are of terms used in this dissertation:
• computer-assisted math education—the integration of computers for positive results in
the math education process where students identify their deficiencies and performance level through mutual interaction; students also receive feedback on the work completed (Demir & Basol, 2014);
• EOC test—A Louisiana-based standardized test that assesses proficiency in key concepts
in a course to determine if a student is ready to move on; passing this is also a requirement for graduation (LDOE, 2015);
• Programme for International Student Assessment—an assessment used internationally by
the Organization for Economic Cooperation and Development to determine if students at the end of their compulsory education have the skills and knowledge necessary for full participation in modern society (OECD, 2013); and
• response to intervention—an educational program authorized in IDEA to provide current
intervention in reading or math for students who are behind their peers or benchmarks for their particular grade level (Antrim & Robins, 2013).
CHAPTER TWO: LITERATURE REVIEW Overview
Active learning formed the theoretical foundation for this quasi-experimental posttest-only study. Active learning theory lies at the foundation of the student-centered learning software, Math XL, used in this study. This study demonstrated the gaps in the current
understanding of the application of active learning theory in a mathematics classroom through technology applications. Furthermore, key literature on concepts relevant to the population of the study, such as online schools, implementation of computer-assisted mathematics education, accountability, and achievement in traditional and virtual schools, was examined through the lens of a researcher.
Theoretical Framework
When recalling student-centered learning theories, most credit John Dewey with having the largest impact on classroom pedagogy in present-day education. However, Charles Peirce’s thinking on pragmatism had a profound impact on Dewey’s theory (Dewey, 1938), although Peirce is not typically credited with contributing to the literature on active learning theory. This could be due to Peirce’s lack of finished writings on education during his lifetime. Active learning forms the foundation of the theory used in this study and advocates for a student-centered learning experience that requires engagement in the subject matter. Engagement and student-centered learning are often included in best practices and teacher training programs. In place of lecture or other teacher-centered methodologies, students and their learning experiences form the central theme of the classroom. Key classroom pedagogies relevant to this study that employ this learning style include process oriented guided inquiry learning (POGIL) and inquiry-based learning. Peirce rejected pushing knowledge on students and, in place of it, favored
generating curiosity in his students. Pierce did not support the idea of simply teaching through a lecturing process to maximize learning, although lecturing dominated the educational pedagogy during his lifetime (Liszka, 2013). Since the early 2000s, active learning theory has entered educational studies based on applications of technology, as seen in this study (Adewale, Ibam, & Alese, 2012; Gulwani, 2014; Lerman, 2012).
Peirce began his journey into active learning during his teaching time at John Hopkins University by developing a correspondence course, The Art of Reasoning. The syllabus for the course included a statement citing that the purpose of education is to teach students how to do something. This simple statement formed the basis for a profound departure from traditional education methods. This statement began the journey into active learning where the student actively engages in the content to be able to apply to the real world what he or she learned in the classroom (Peirce, 1982, V6, p. 11). Jastrow (1916), one of Pierce’s students, remarked that the use of discovery made Peirce an excellent teacher. Peirce did not simply lecture material and assign work for the students to complete later. Instead, he advocated learning by doing, which also comprised the core of his pragmatic maxim. Pierce guided students through a pattern of discovery to arrive at new concepts and ideas. These discoveries made the concepts more
memorable and lent to discussion on application (Liszka, 2013). Hull (2008) noted that a student easily forgets information unless it is learned by doing or while doing. This same idea presents itself clearly in the writings of Peirce as his students describe their learning process in his courses. The use of discovery in the classroom, as Jastrow (1916) described Peirce’s teachings, comprises a key instructional strategy for active learning. In addition to hands-on learning, students should have real engagement between the theory and practice to make meaningful connections between the classroom and the real world.
Drew and Mackie (2011) discussed that learning through play commonly defines active learning theory in the educational world; however, as the authors pointed out, active learning should encourage participation and promote logical and creative thinking while encouraging problem-solving approaches. Therefore, learning through play and social interaction is not the only application of the theory in the classroom. While learning through play certainly applies to lower levels of education, one would not expect to see secondary students engaging in play during class. Active learning situations should also provide a range of skills that make learners think and interact with the problem. This can be accomplished through hands-on learning and technology in the secondary classroom. While several articles exist on the use of mathematics and technology (Demir & Basol, 2014; De Witte et al., 2014; Vilardi & Rice, 2014), only Wilder and Berry (2016) examined the use of technology to enhance the classroom through the lens of active learning.
Other discussions on modern-day interpretations of active learning include Gulwani (2014), who advocated for example-based learning in STEM education to automate repetitive tasks in Algebra I and Geometry. By providing examples that create a pattern, students can learn by discovery as seen in Peirce’s writings. To move this to modern-day applications, the use of programmable software can automate ideas including structured tasks, problem generation, solution generation, and feedback. Programmable software allows for large numbers of variations in problems generated and can automate feedback for mistakes based on answers given. It also produces numerous examples for students to view and learn from. In addition, the use of this software allows students to learn by doing and discovering repeated patterns in problems that can be applied in mathematical procedures. Gulwani explained that example-based learning stems from active learning in that students discover patterns through conceptual
problems and then perform reasoning to abstract the relationship. In essence, students learn by doing and by using technology.
This study used the premise of student-centered learning through inquiry to guide the use of Math XL and apply active learning theory. As discussed by Gulwani (2014), this software can be used to automate tasks that are repetitive in Algebra I and Geometry, such as solving
equations, identifying transformations, completing simple proofs, and more. Liszka (2013) described active learning theory as student-centered engagement with the subject matter. The purpose of the present study was to examine the engagement in the Math XL software with targeted assignments to determine whether there was a statistically significant difference in achievement on the EOC tests in Algebra I and Geometry. This supports the theory suggested by Gulwani (2014) and aligns with Peirce’s writings on active learning theory with a technology application. Math XL was used as computer-assisted mathematics education for students enrolled in the intervention program to provide interaction between the software and the student with guided input from the teacher. Students engaged with guided inquiry and utilized the tools in the software such as Help Me Solve This and View an Example to identify patterns in the concepts and learned while doing problems.
The Help Me Solve This tool walks students through a problem step-by-step while
allowing students to enter their solution for each step. The program then checks their answer and lets them know if an error is found. This allows students to pinpoint where misconceptions occur in the concept. In View an Example, the software works out a problem showing the student one step at a time. In this tool, students do not interact with the software other than to signal when to show them the next step. Therefore, students learn through working the problems with the tools and can automate basic mathematic concepts. Students also apply abstract
concepts to concrete problems as they progress through the problems in the software. Ideas such as performing the opposite operation to isolate a variable are concretely practiced many times to allow the student to engage with the material and, therefore, apply the abstract idea of isolating a variable to solving an equation (De Witte et al., 2014; Kodippili & Senaratne, 2008). Students engage in active learning through doing teacher-selected problems in the software and apply what they have learned to new abstract mathematical contents (Gulwani, 2014). This extends the realm of active learning into the use of computer-assisted learning programs for students to increase mathematics achievement.
Related Literature
In 1997, Florida revolutionized education by starting the first fully online public high school in the United States. Until this point, distance education consisted of correspondence courses or televised courses. The only school choices available before 1997 were
homeschooling or a brick-and-mortar school. When Florida created the first online school, it allowed for an unprecedented third choice for families. Since then, other states have started their own online programs, and enrollment in online courses has steadily increased in K-12 schools. School systems even offer online programs at the district level for homebound students or students who have surpassed the typical age for their grade. Parents opt for their children to attend online programs for many reasons (e.g., individualization of education, daily progress reports, special education needs, emotional needs). The idea of school choice allows parents to make a personal decision for their child on the best method of schooling, as well as the best school. While growth continues in online education, many parents are not fully prepared for what is required in online learning and lack the ability to maintain structure in flexible programs.
While online learning has many proponents, many criticisms and myths also exist (Kim, Kim & Karimi, 2012).
Online or virtual schools continue to attract more students with learning differences than their brick-and-mortar counterparts do (Thompson, Ferdig, & Black, 2012). As mentioned earlier, this could be for more individualized education, more connection with a disabled student’s learning for a parent, or to manage behavioral issues. It is important to note when examining the traditional brick-and-mortar schools, the estimated success rate of students in a standard math curriculum is only 80% (Kuo, 2014). Thompson et al. (2012) indicated that the number of students in an online school with special education needs outnumbers those in the traditional public school environment. This means that online schools have an additional strain on the academic performance side of accountability, as more students require additional help to succeed and reach grade-level expectations due to a larger population of students with
exceptionalities than their brick-and-mortar counterparts. However, accountability exceptions are not made based on the higher population of students who require extra assistance in accessing the mainstream curriculum.
Per a federal mandate, all schools must identify students who need intervention to address those students who are not reaching grade-level expectations, regardless of the school setting. This includes the 20% of students who are not successful in the standard math curriculum at a traditional school and a greater percentage of those in an online school due to the unique
population that has a higher concentration of exceptional students (Antrim & Robins, 2013). The present study included an examination of the use of computer-assisted learning programs as an intervention strategy for Level II RTI to observe the impact on mathematics achievement as measured by the EOC tests in Algebra I and Geometry. The use of the computer-assisted
learning programs fully addressed the RTI guidelines as given in federal legislation to reach the students who were not achieving grade-level expectations in Algebra I or Geometry. Further, the culture of online K-12 schools through the lens of how they respond to students who are not reaching grade-level achievement in math by utilizing computer-assisted learning as a form of active learning in the online classroom was examined in the related literature section. Active learning presents differently in the online classroom, as teachers are not face-to-face with
students during instructional time. The use of Math XL as a computer-assisted learning program allows for quality interaction and student-centered learning from the home as typically seen in an online environment.
History of Online Secondary Schools
Kokko, Pesonen, Kontu, and Pirttimaa (2015) defined online learning as when a student studies exclusively using the Internet without using a school building for learning or meetings. This definition excludes many hybrid or blended learning programs where students attend a center for parts of the week. In this definition of online school, students can choose the time of day they complete the lessons and the location where they do their schoolwork because learning is mostly asynchronous. However, this does not mean that synchronous sessions with a teacher are not included. The synchronous requirements vary from program to program but still allow for ample flexibility for families on school times and locations. Online learning has also begun to be linked to the term virtual learning. Elementary and secondary virtual schools or online schools in the United States are just reaching the 20-year mark of existence following the lead of Florida Virtual School (Kim et al., 2012). According to the U.S. Department of Education (2010), virtual learning has replaced previous types of distance learning, such as correspondence courses, educational television, and teleconferencing. According to Corry (2016), two options
exist for virtual schooling—fully online and blended. In a fully online school, the student completes the entire program online. In the blended environment, the student attends some coursework at a location and completes the rest online. This study examined a school with a fully online program design. Waters, Barbour, and Menchaca (2014) estimated that in 2016 there would be roughly 4.8 million virtual and cyber online students in the United States in K-12 education. With the gains of students in virtual education, there are concerns regarding
accountability issues such as grades and dropout rate. Accountability
According to Teo and Osborne (2014), accountability in education is a social practice through which distinctive relationships are identified, and evaluative procedures are employed to measure the performance of a school or teacher. Mathematics teachers feel more pressure than other disciplines outside of English to deliver high test scores to secure a positive accountability score. In part, this is due to a results-driven culture that stems from federal and state education pushes for a results-driven approach to increase accountability scores at the state level. Due in large part to the push for results-driven education, interventions are increasingly prevalent to identify potential issues early on and to remediate skills. In England, the idea of school performance came into existence to aide in school choice for families as a part of the 1992 conservative government’s agenda (Perryman, Ball, Maguire, & Braun, 2011). Many online schools fall under the category of charter schools, and like schools in other countries, score metrics are in place to guide parents on deciding the best option for their child (School Choice, 2017).
Louisiana has put into place numerous categories that add together to produce a school performance score (SPS). According to the LDOE, for the 2016-2017 academic year, there were
several categories used to calculate the SPS, including the strength of the diploma, advanced coursework, standardized testing, graduation index, and progress points (LDOE, 2017b). The graduation index or strength of diploma is calculated from the number of students graduating with a diploma and holding college credits through either the CLEP program or the AP program. The index was further strengthened by the number of profoundly disabled students who achieved a state diploma through the Leap Alternative Assessment (Laa1) program, where alternate
graduate assessments are given to students. The graduation index is calculated by the number of four-year graduates from a school, with penalties for students who do not pass their senior year or choose to drop out. Standardized testing is calculated from grades 3-12. For elementary education (3-8), the Louisiana Educational Assessment Program (LEAP) test is used, and
students who score proficient or above are counted toward the school score. For high school, the EOC tests for identified subjects are counted, but only if students achieved a score of good or excellent. Students scoring needs improvement or fair did not earn points toward the SPS. At the high school level, ACT scores were also used to earn points toward a SPS score. Students who earned a passing score on an advanced placement test or CLEP test also added points to the SPS in that category, as well as under strength of diploma. These scores are calculated each year and released to the public for all public and charter schools sometime in October on the LDOE website. This is meant to be a tool for families to use appropriate school choice in the various programs in Louisiana, including tax-funded vouchers for private schools, charter schools, and traditional district-level brick-and-mortar schools. For the 2016-2017 school year, one online charter earned an SPS grade of C and two other online charters in Louisiana earned SPS grades of D (LDOE, 2017a). The schools showed significant dips in the graduation index due to large numbers of dropouts or students not graduating on time, as well as low standardized test scores.
As attendance and tests are challenged in the state legislature, it should be noted that these online schools have unique challenges with getting students to show up for testing and in tracking truancy. An employee of one of the online charter schools and an SPS-trained member of their staff pointed out that for each student who does not show, the school receives a zero in the SPS score (M. Caillet, personal communication, September 27, 2017). Caillet also pointed out that online schools lack a public transportation system and, in high-poverty areas, the schools encounter many issues in getting students to test sites (personal communication, September 27, 2017). Accountability remains an issue in the Louisiana school system, as the state tries to determine how to quantify the SPS scores for the online schools.
Online charters are not alone in difficulties with accountability measurements. Teo and Osborne (2014) conducted a study on accountability measures in a STEM charter school. In this study, it was argued that there must be clarity for how performance is measured and achieved. This was due to some decisions at the school level negatively impacting the accountability measures without that being the intended result. Allowing students to withdraw from the school without providing a new school is one example of an indirect impact on accountability measures. Furthermore, professional accountability at STEM schools presented a challenge. Many teachers in the study held advanced degrees in science and math, but lacked experience in educational pedagogy or an understanding of standardized testing outcomes. These are a few examples of challenges that exist in other types of schools in reference to accountability. As seen in this study, one size does not fit all in accountability.
Corry (2016) completed a study on the dropout rate of Hispanic students in Arizona in online-blended, online-only, and public schools. The study found that the dropout rate in blended programs was lower than those in online-only programs. The U.S. Department of
Education (2010) published a report that noted the lack of experimental or quasi-experimental studies conducted in online schools. According to the report, there is little empirical data to support or oppose online-only education. The study also found that students in online-only programs performed moderately better than students taking part in traditional face-to-face courses. However, this is only one small segment of the online school population in the United States. Accountability also raises concerns for how to measure performance in online schools with their diverse student population that consists of a higher population of students who require additional services to be successful in the academic arena. Additionally, challenges exist that are unique to online schools when determining a SPS that does not exist in traditional brick-and-mortar schools (Thompson et al., 2012).
Special Education in Online Schools
Several studies demonstrated that online schools do not perform at the same level as their counterparts; however, when there is no control for the social, emotional, or health issues of students, the online schools perform admirably compared to the traditional learning environment (CREDO, 2015; Glass & Welner, 2011; Hubbard & Mitchell, 2011). This means that when populations of students with learning differences are compared in a virtual setting versus a traditional setting, they perform at the same level or higher in a virtual setting. As a
counterexample to these studies, when Carpenter, Kafer, Reeser, and Shafer (2015) used a matched sample between the schools to control for inconsistencies in the population of students, they found the differences were not all significant between online schools and traditional
schools. The conclusions suggested that online schools offer a diploma that is an equivalent education for those who have health challenges. Due to health challenges, many students cannot attend a traditional school for a full day, which hurts their academic performance. However, an
online program allows them to attend at any point in the day and have greater instructional exposure. The conclusion of this study shows that the strength of the online diploma is about the same as the brick-and-mortar for this specific population. Having a larger population of students with emotional, social, health, or behavioral issues can create additional challenges for online schools to demonstrate adequate academic growth, but this study provides a counterexample.
Coy and Hirschmann (2014) suggested that the lack of parental involvement in day-to-day activities in public schools could cause parents to seek an online program, which would explain the larger population of special education students. Coy and Hirschmann further
suggested that parents of students with exceptionalities would prefer increased involvement in all aspects of their child’s education. In an online environment, parents can closely monitor
curriculum and grades and assist their children in ways that are not possible in traditional schools. In addition, they also cite easier access to therapy sessions or medical appointments, which is yet another reason for seeking an online program versus a standard brick-and-mortar school. Many appointments occur during the day, which becomes a challenge in a traditional school. Even when services are provided by the school system, additional private therapy may be needed. Furthermore, students with exceptionalities who also have health issues miss school for medical check-ups, which also takes away from instructional time in the school. While parents are involved in individual education plan meetings, progress reports, and conferences at a traditional school. They lack the daily interactions with their children and seeing the challenges in real time. Parents see grades after units are complete and often cannot judge whether students are struggling until a large portion of material has been covered in a traditional school setting. Due to the larger population of learning disabilities, intervention programs play a vital role in the online learning environment.
CREDO (2015) found that online schools reduced the impact of student achievement on special education students when compared to nonspecial education students. Special education students have unique challenges in the classroom with access to the general curriculum, as well as equitable instructional time due to various therapies or appointments that they must attend. Thus, the lower student achievement scores showed a skewed effect in the online setting, which resulted from the larger population of special education students and subsequent lower
achievement scores from more profound exceptionalities that have chosen online school. Specifically, the study found that math academic growth in online charter schools was significantly less negative than that of nonspecial education students. Online charter schools showed progress in aiding the special education population to increase academic achievement, specifically in mathematics. Increased instructional time, interventions, and strong support in the home aided students with exceptionalities in their academic achievement in the online
environment. Results varied for average students with nonspecial education backgrounds in the study, depending on the state. This shows variation in the programs between students with exceptionalities and their neuro-typical counterparts and the need for further study to determine the source of the differences.
Domestic Math Achievement
Online schools are not alone in their struggles with academic achievement. More to the point for this study, online schools and traditional schools are struggling with mathematics achievement in the United States, where mathematics education has remained stagnant from 1971 to 2012. During this period, there was little to no growth in math achievement among 17-year-old students (NCES, 2015a), and online schools were not an option during most of this era. Therefore, these results reflect performance of students in traditional schools and illustrates that
the challenge of achievement is faced by all and not just charter or online schools. Students in U.S. schools remain at a disadvantage when it comes to higher education mathematics due to a lack of preparation for math on the secondary level. A large gap exists between the actual level of math achievement of students and the desired level of math achievement to enter into
postsecondary education. Significant concerns are presented regarding students’ preparation for higher levels of mathematics when leaving the secondary education system.
Furthermore, state standards demonstrated a lower level of proficiency that more closely aligned with a community college level than the national standards set to reflect a four-year university route. This shows that gaps in achievement exist, as well as gaps in state-level expectations (Lee, 2012). Larger online schools use national standards, as many have a nationwide parent company. An example of a nationwide standard system includes the use of Common Core standards, which benefit the student population, as seen in a study conducted by Lee (2012). Online state-level schools adjust the nationwide standards due to their parent companies and prepare students for higher education despite the geographic location of the high school or college. A student in Mississippi receives the same level of education as a student in California with this design.
The National Assessment of Educational Progress (NAEP) performed the largest ongoing assessment of what American students know and can perform in core subjects. The assessment is also nationally representative of the population. On a national assessment, the program has between 10,000 and 20,000 participants from schools all over the nation (NECS, 2016a). In 2016, the NAEP released The Nation’s Report Card following the 2015 assessment and found that scores went down from 2013 to 2015. In 2005, 2013, and 2015, 12th-grade students were assessed in mathematics under the current mathematics framework. The scores in 2015 were
significantly different from the scores in 2013. The scores in 2015 showed that middle- and lower-performing students decreased significantly in performance from 2013. In 2015, the average was 152 on a scale of 0-300; in 2013, the average score was 153. To see the full picture for the results of the NAEP math assessment, the results in 2005 should also be examined. The 2015 score did not vary significantly from the initial 2005 average score (NCES, 2016a). This shows that even the most recent efforts to improve math education fall short of the goal of improving domestic mathematics achievement.
In later testing in 2017 and 2019 there was not data on 12th grade students but there were
significant findings for 8th grade mathematics students. In 2017 there was no significant change
in the scaled score for the average mathematics score for 8th grade students with the score being a
283. The change in the average score for 8th graders in mathematics was an increase of one point
on the scaled score, which was found to not be significant. When compared other years the average remained within 4 points from 2007 with some years being just above and some years below. This further shows that efforts to change the mathematics achievement through various curriculum changes, standards revisions and instructional practices have not been successful. What is of significant concern from the 2017 scores is that the gap between lower achieving students and higher achieving students has widened. Students in the lower percentiles (10th to
25th) scored a lower average score by 2 points. On the other hand, higher achieving students
increased their average score by 2 points. The result is a widening gap for 8th grade students that
would be eligible for RTI services. The implications of this show us that current RTI efforts are not enough for lower performing students (NCES, 2018).
Examining the 2019 scores showed that the non-significant point gained by 8th grade
in 2017 was not seen as significant the drop by one point is seen as significant. This could be from looking at the comparison over time. In 2013 the scaled score was a 285 which then dropped to a 282 in 2015. Then in 2017 and 2019 the mathematic performance score fluctuated, dipping down and then up. However, it did stabilize back at a scaled score of 282, which is even with the 2013 scaled score. This shows that there is a significant need to examine the key
changes overall for 8th graders to better prepare them for secondary and post-secondary
instruction. Another significant feature of the results from 2019 are the lack of growth or regression by percentile. Students in the bottom 10th percentile fell by 2 points in their average
scale score. This means that from 2015 to 2019 the bottom 10th percentile fell by a total of 4
points on the average scaled score. The lower 25th percentile, the 50th percentile and the 75th
percentile all saw statistically significant drops of one point on the averaged scaled score while the top 90th percentile stayed the same. This shows no growth over the two-year span from 2017
to 2019 and losses at the lower level (NCES,2020). This shows a stark forecast for secondary and post-secondary education as mathematic achievement even at the highest level is stagnant while the students that most need RTI and support continue to lose ground in mathematics. This supports the case for further investigation of new practices to help all students be successful in mathematics so that students are prepared for high school. When students are not prepared or on level for high school this impacts their ability to get post-secondary education or even trade school.
The PISA test results from 2003 to the most recent 2018 examination further support the need for domestic mathematic education reform. The scores from 2003 to 2018 have declined. In 2003 the average for mathematics was 483. From this value it fluctuates to 474 in 2006, 487 in 2009, 481 in 2012, 470 in 2015 and 478 in 2018. This fluctuation has still not returned to higher
gains seen in 2009 and according to the OECD, demonstrates that there has been no significant improvement in the United States scores when compared to each other. Instead, the OECD states that the achievement remains about the same in mathematics (OECD, 2019). Even this snapshot of the United States performance on an international test demonstrates the stagnate state of mathematics achievement in the United States despite efforts at reform.
International Comparison of Math Achievement
In addition to a domestic gap, the United States continues to lose ground internationally in math (Lee, 2012; NCES, 2015a; OECD, 2013). Every three years, the OECD cooperates with the PISA to assess student learning in reading, mathematics, and science. The test assesses mathematical literacy through formulating situations mathematically; employing mathematical concepts, facts, reasoning, and procedures; and interpreting, applying, and evaluating
mathematical outcomes. In 2012, over 6,000 U.S. students from 161 schools participated in the PISA test. During this time, the United States lost ground from the 2006 PISA test and
continued to perform well below the average of other nations. Only 2% of students in the United States reached the highest level of performance (level six) on the 2012 PISA test. The OECD average was 3%, and top nations ranged up to 31% reaching the highest level. This demonstrates the need for change in the U.S. secondary system of mathematics and shows that concerns
remain, whether the student was enrolled in online or traditional schools, regarding preparedness for the job market and postsecondary education (OECD, 2013). A clear gap in math remains in the educational system with students requiring additional resources to access the standard math curriculum (Gresham & Little, 2012; Kuo, 2014), and even more resources are needed to be internationally competitive and ready for postsecondary education (Lee, 2012; OECD, 2013).
The results from the 2018 PISA test are even more telling. The United States performed below the international average for the mathematics portion of the PISA. It should be noted that in the Unites States there was no criteria for selecting students that would participate and other countries may employ gate keeping mechanisms. One way to view this is through the
achievement of basic levels within the test. Level 2 attainment indicates that students can interpret and recognize without instructions how a situation can be represented mathematically. This includes translating basic word problems with currency or distance as a focus into a mathematical expression. In the United States 73% of students reached level 2, however, the OECD average was 76%. To put this into context countries like Singapore had 93% attain mastery of level 2 while the Dominican Republic had only 9% at this level. The OECD average accounts for these outlier scores and may not be the best mean representation. If this is
investigated further to find meaningful conclusions, the higher levels can be used. At the higher levels the range is smaller with fewer outliers. Level 5 for instance means that students have reached the benchmark where they can model complex situations with math and can evaluate and use critical thinking skills to solve them. Only 8% of students in the United States that took the PISA attained this level. The OECD average was 13% with Asian countries scoring much higher. China had 44% attain mastery of Level 5 while Singapore had 37%, Hong Kong 29% and Korea 21%. All of these numbers are much higher than the United States percent. This shows the continued international gap in mathematics as the United States remains below the average in mathematics and in many areas by level far below the average (OECD, 2019).
In addition to the PISA test, the Trends in International Mathematics and Science Study (TIMSS) examines international achievement in mathematics and completes a comparison study at the international level. The TIMSS is given internationally to 4th- and 8th-grade students
(NCES, 2016b). The assessment was developed by the International Association for the Evaluation of Educational Achievement (IEA), which is comprised of national research-based institutions, as well as governmental research agencies (NCES, 2015a). The TIMSS assessment is given every four years to countries that elect to be a part of the study. In the United States alone, between 182 and 250 schools have participated in the TIMSS assessment from 1995 to 2015. Participants ranged from 7,296 to 12,569 at the 4th- and 8th-grade levels (NCES, 2016b). The number of countries that participate varies from year to year, with 29 participating in the 1995 administration for 4th grade and 46 participating in 8th grade in the same year. In 2015, 49 countries participated at the 4th-grade level, and 38 participated at the 8th-grade level.
In the 2015 administration of the TIMSS assessment, the United States ranked higher than 34 education systems and lower than 10 education systems at the 4th-grade level. At the 8th-grade level, the United States ranked higher than 24 systems and lower than 8 systems. However, it must be noted that the score for 8th-grade students only increased from 492 to 518 over 20 years from 1995 to 2015. This is not a statistically significant increase based on the data presented in the study. The highest score possible is 700. Therefore, 518 remains significantly lower than the optimal score. However, this does show gains being made based on the
assessment, but the gains are small over a long period. While the United States performed better than the 24 systems in the most recent study, the level of growth is a concern when mathematics achievement is a global concern.
TIMSS also offers an advanced assessment for 12th-grade students. Students who take the advanced assessment have taken, or are currently taking, an advanced mathematics course. This was defined, in 2015, as those taking a second-year international baccalaureate course or an advanced placement mathematics course. The nine countries that participated in TIMSS
advanced in 2015, with roughly 241 schools participating in the United States and over 2,900 students. The TIMSS scores for all countries decreased from 1995 to 2015, with the U.S. score going from 497 to 485 (NCES, 2016b).
Gender Gaps
According to the NCES (2013), there were no significant gender gaps in mathematics in the United States for ages 9 and 13 based on the 2012 assessment. This is a startling conclusion for teachers who have been in the field for many years, as the gender gap was very prevalent in previous studies. The target demographic for ninth- and tenth-grade students is around 14 years of age; when comparing this to the given ages from the NCES, the students fall between the 13- and 17-year-old age range. At the age of 17, the gender gap is only 4 points, which is a
statistically significant difference from the 8-point gap in the 1970s. The gender gap is closing in U.S. STEM education. The NCES (2013) used data from the NAEP to track student
performance at the ages of 9, 13, and 17 to investigate long-term trends. Arslan, Canlt, and Sabo (2012) further supported this claim by showing that there was no statistically significant
difference between males and females in sixth through eighth grade in mathematics achievement scores; however, they did find that attitude scores toward mathematics differed greatly between genders. The authors concluded that females should be encouraged to pursue mathematics education, as they have the ability, but as seen in the study, have less confidence regarding their performance.
To further support this the OECD examined performance by gender in the 2018 PISA results. Males only performed 9 points higher than females which was found to not be
statistically significant. An interesting find was that there was a reading gap by 24 points between the two genders. Even though historically the gender gap is more traditionally thought
to exist in math or science. However, attitudes of males and females toward careers in STEM was shown to be different. While 3 in 10 boys with a strong aptitude for mathematics declared they were interested in engineering or science-based profession, only 1 in 10 girls indicated the same. While the achievement gap is not a factor in gender, attitude is a significant factor for females (OECD, 2019).
In addition, women continue to be underrepresented in bachelor’s, master’s, and doctoral programs in STEM fields, according to Beekman and Ober (2015). Beekman and Ober (2015) investigated the results of the NCES in their own study, which was conducted in Indiana, and confirmed that the gender gap is quite small to nonexistent, as females score comparable to males on testing for math achievement; however, they did agree that girls and young women should be encouraged to pursue STEM fields, as there will be an increasing need in the coming years for jobs in those fields. In conclusion, as gender gaps for mathematics achievement have closed over time, the present study did examine gender as a variable in comparing math
achievement between those in intervention and those not in intervention. Response to Intervention
In 2004, RTI was added to the IDEA as a different evaluation procedure for schools. The goal of the legislation included identifying early students who struggle and providing appropriate interventions while also identifying students with learning disabilities (Turse & Albrecht, 2015). Furthermore, RTI implementation across the country intends to ensure that all students receive the tools and instruction necessary to achieve grade-level or higher academic success. In general, the RTI process seeks to (a) identify students and their problem with the content, (b) create an intervention plan, (c) implement the intervention, (d) evaluate the student and his or her progress, and (e) continue to make intervention plans based on student progress (Martinez &