Louisiana State University
LSU Digital Commons
LSU Master's Theses
Graduate School
2012
Educational looping and retention in the middle
school setting
Mary Elizabeth Feighery
Louisiana State University and Agricultural and Mechanical College, [email protected]
Follow this and additional works at:
https://digitalcommons.lsu.edu/gradschool_theses
Part of the
Physical Sciences and Mathematics Commons
This Thesis is brought to you for free and open access by the Graduate School at LSU Digital Commons. It has been accepted for inclusion in LSU Master's Theses by an authorized graduate school editor of LSU Digital Commons. For more information, please [email protected].
Recommended Citation
Feighery, Mary Elizabeth, "Educational looping and retention in the middle school setting" (2012).LSU Master's Theses. 3100.
EDUCATIONAL LOOPING AND RETENTION IN THE MIDDLE SCHOOL SETTING
A Thesis
Submitted to the Graduate Faculty of the Louisiana State University and Agricultural and Mechanical College
in partial fulfillment of the requirements for the degree of
Master of Natural Sciences in
The Interdepartmental Program in Natural Sciences
by
Mary Elizabeth Feighery B.A., University of Notre Dame, 2008
ii
ACKNOWLEDGEMENTS
I would like to express my deepest appreciation to my committee chair, Dr. Michael Cherry, for his support and guidance throughout this process. I would like to thank Dr. Cyrill Slezak and Dr. Dana Browne for their many suggestions for improvement, and for motivating me to make changes that have only improved my final product. The feedback that I received from the three of you helped me grow as a student and as a teacher, and for that, I am extremely grateful. To Dr. Knight Roddy, you made this entire thesis and program possible. I appreciate your help, guidance, and overwhelming kindness.
To my fellow MNS superstars, I cannot imagine the past three years without your constant support, positive attitudes, and laughter. You made this struggle so worth it in the end. To my parents, thank you for encouraging me to pursue my dreams of becoming a “Master” and supporting my decision to spend so much time in Louisiana. To my sister, thank you for your ideas, editing, and constant
encouragement. To my brother, thank you for the laughs and support. To my favorite students in East Feliciana Parish, thank you for making every day we spent together a joy. You made me want to work harder to provide you with the best learning experiences possible. I am so lucky that I got the privilege of seeing you grow and develop into the wonderful people you are today.
iii TABLE OF CONTENTS ACKNOWLEDGEMENTS ... ii LIST OF TABLES ... iv LIST OF FIGURES ... v ABSTRACT ... vi INTRODUCTION ... 1 LITERATURE REVIEW ... 8
MATERIALS AND METHODS ... 14
DATA AND RESULTS ... 22
SUMMARY AND CONCLUSIONS ... 31
REFERENCES ... 33
APPENDIX A: LOOPED STUDENT PERFORMANCE ON iLEAP/LEAP ... 34
APPENDIX B: UNLOOPED STUDENT PERFORMANCE ON iLEAP/LEAP ... 36
APPENDIX C: 2-YEAR LOOPED STUDENT PERFORMANCE ON iLEAP/LEAP ... 38
iv
LIST OF TABLES
Table 1: The summary of student populations in East Feliciana Parish from 2008—2011 ... 16
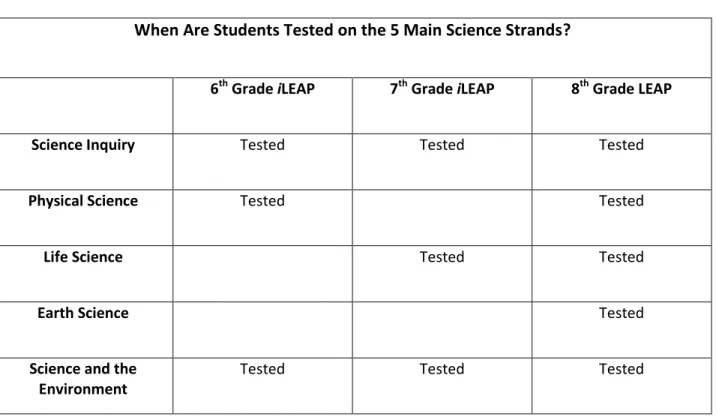
Table 2: When students are tested on the 5 Louisiana Science strands ... 17
Table 3: P-values of Students on iLEAP/LEAP ... 26
Table 4: Mean of Students on iLEAP/LEAP ... 26
Table 5: P-values of different student groups on iLEAP/LEAP, 2009—2011 ... 27
Table 6: Student averages on EAGLE retention assessment, August 2011 ... 28
Table 7: Student averages on EAGLE retention assessment, May 2012 ... 28
Table 8: P-values of different student groups on EAGLE retention assessment ... 29
v
LIST OF FIGURES
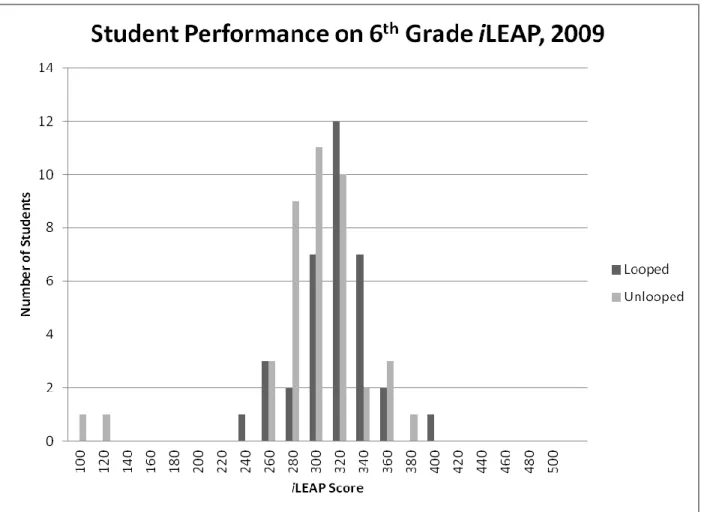
Figure 1: Histogram of student performance on 6th grade iLEAP, 2009. ... 23
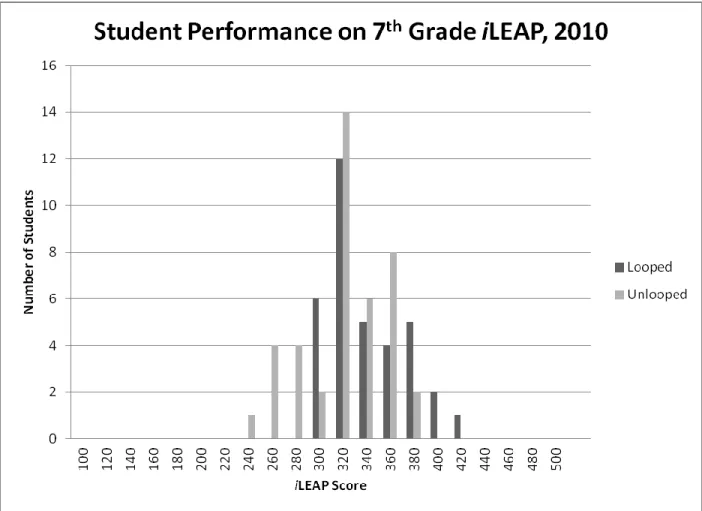
Figure 2: Histogram of student performance on 7th grade iLEAP, 2010 ... 24
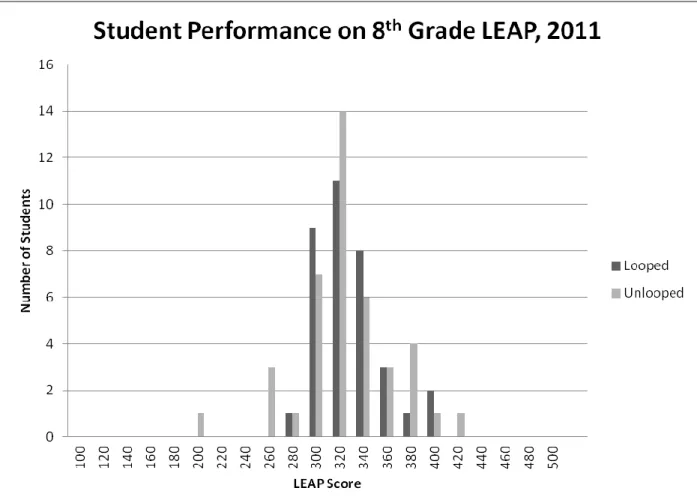
Figure 3: Histogram of student performance on 8th grade LEAP, 2011 ... 25
vi
ABSTRACT
Educational looping is an educational method where teachers remain with the same core group of students over multiple academic years. The current research on this topic shows a strong positive correlation between the effects of looping and the growth of personal relationships between students and teachers, but neglects to examine the connection between looping and student educational growth. This paper explores the relationship between looping and academic gains, as well as between looping and retention of content material over time. This paper explores both the relationship between looping and academic gains and between looping and retention of content material, and attempts to explain the relationship between looping and student performance on state assessments. Additionally, the research also examines whether students who looped with one teacher throughout their middle school years retain more content knowledge than students who had different teachers during middle school. The focus on middle school is important to the academic community because most research on looping has focused on younger students.
In order to compare the quantitative effects of looping, this study compared student
performance on the Louisiana state assessments at the end of each school year in 2009, 2010, and 2011. By analyzing two groups of students in Louisiana, one that looped with the same Science teacher for three years, and one that had three different Science teachers, we can determine that based on the state test scores, the two student populations were significantly similar at the end of the first year, significantly different at the end of the second year, and significantly similar at the end of the third year. In addition to the results from the state tests, the students were also given a retention assessment in August 2011 and May 2012 to see if students who looped retained more information than students who did not loop. Results from these assessments showed that looping did not cause a positive change in student retention of content knowledge. By breaking down the groups into different categories, a few small positive trends were found, but overall, the study was thwarted by a number of complicating
vii
systematic factors. Subsequently, a positive trend is seen in favor of looping after the first two years of the study, yet after the third year, an overwhelming amount of external factors prevented this trend from continuing.
1
INTRODUCTION
The traditional system of teaching and learning in America is not always conducive to the development and fostering of interpersonal relationships between teachers and students. By the time a student reaches the college level, they could potentially have had upwards of 40 different teachers throughout their lifetime; each instructor with their own set of expectations and procedures that students have to become familiar with and conform to in order to be successful in that particular classroom. From the teacher’s perspective, this continual stream of new faces is demanding, as teachers must become familiar with the varying academic and personal strengths and weaknesses of each student in order to create and maintain a successful and comfortable classroom environment. In addition to learning about each student on an individual level, the teacher also needs to learn how the group of students interacts. One of the most challenging aspects of teaching is forming these strong relationships with students to the point where the teacher can easily anticipate problems or issues that might arise with individual students or defuse classroom situations before they escalate. With each new academic year and subsequent new group of students, the teacher needs to reset and again begin to know the students and work on forming successful relationships.
In my first year of teaching, I found relationship building to be a slow yet extremely important process whereby I had to put an extraordinary amount of time and effort before, during, after, and outside of school into getting to know each student as an individual and as a member of the classroom. As a result of the relationships my students and I formed, the small community we created inside my 6th grade Science classroom became a safe space for students as they learned to deal with the tribulations and delights of middle school. When the opportunity arose the next year to teach the same group of students, I jumped at the chance because I had grown so close to many of the students and I knew what to expect regarding their learning styles and individual personalities. Additionally, the prospect of
2
teaching the same group of students meant that I would spend less class time out of our four-day school week in familiarizing students with my personality, teaching style, and expectations. Because I looped with these students, I was able to begin teaching content on the second day of school, a time when most other teachers were still introducing classroom procedures and highlighting rules. After I
completed my second year of teaching the same core group of students, I noticed a significant increase in their academic gains, and accepted the opportunity to teach them for the third year in a row.
In Louisiana, 8th grade Earth Science is an exhaustive curriculum. It consists of an extensive number of Earth Science Grade Level Expectations (GLEs), and in addition the LEAP (Louisiana
Educational Assessment Program) test at the end of the year assesses student knowledge of the entire three- year middle school Science curriculum. Students are required to have a complete comprehension of the Physical, Life, and Earth Science curricula (6th, 7th, and 8th grades), as well as to know how to think critically, as a scientist would. Consequently, the 8th grade teacher’s job is to teach a full year’s worth of new material while constantly reviewing the content-heavy material from the previous two years. Because of this inclusive aspect, I felt that I was well suited to teaching Earth Science to the students I had looped with because I had a clear understanding of what they knew, what they needed to work on, and how much time we needed to spend on each subject. It is incredible to me how other teachers manage to effectively teach 8th grade Earth Science without having this extensive knowledge of their students’ attitudes, behaviors, work ethics, and understanding of the content.
Midway through my second year, as I began to see overall increases in student performance on quizzes and unit assessments, I began to wonder whether anyone had researched the concept of looping to find quantitative information about its effectiveness. I found looping to be extremely rewarding on a qualitative level because of the strong relationships I had formed with students and the insight I gained from knowledge of both their academic and personal lives, which proved useful in
3
dealing with different situations that arose in their lives both inside and outside of the classroom. I was curious to see what others had found to be the possible benefits or consequences of teachers remaining with the same students over multiple years. Also known as multiyear teaching, looping involves “a teacher moving with his or her students after one year to the next grade level, then looping back to work with a new group of students at the lower grade level after the second year” (Delviscio and Muffs, 2007). While it is common in Europe and Asia, looping is not a method that is widely implemented in schools and classrooms across America. When it is practiced in the United States, it occurs most often with preschool students (Little and Dacus, 1999). As Bracey (1999) says, “the idea that students fare better when they have teachers who stay with them more than one year is well established in Europe and Asia.” Daniel Burke adds, “Italian preschools, considered by some the best in the world, utilize a model of three-year assignments of students to teachers… some German schools utilize multi-year teacher-student groupings for as long as six years” (1997). Burke (1997) goes on to describe the concept of a Waldorf education, “which originated in Central Europe over 70 years ago and was brought to the United States in 1928. In Waldorf education settings, one teacher and the same group of students remain together from grade one through grade eight.” Jacobsen (1997), who studied a school in the United States, adds that looping is “usually found in the early grades and often starts as a pilot project or with a couple teachers who decide they want to give it a try.” In my case, having the same group of students for two years was more accidental than deliberate, but after discussions of their academic gains with my principal, I was tasked with teaching them for their third and final year of middle school.
Although looping and multiyear teaching may not be common practices in American schools, researchers have found that looping helps to reduce the amount of educational time wasted at the beginning of the year when students and teachers are settling into school and getting to know one another. Delviscio and Muffs (2007) discuss how looping can help to provide “more continuity in
4
instruction from one year to the next as well as increased instructional time. This is because the teachers spend less time at the beginning of the year reviewing and assessing the ability of their
students.” A major benefit of looping in the second year is the idea that teachers, parents, and students do not have to take the time to get to know one another. Katz (1999) describes a case study where she found that “because children, their families, and teachers are together for three years, they get to know each other well. In schools that do not have this arrangement, teachers and students spend the first few months in the fall checking each other out as teachers assess what students know and children assess how they will relate to the new adult in their school lives.” Katz (1999) highlights that, at the school she studied, “the fall semester starts with everyone ‘in gear’ and ready to learn.” Katz’s point mimics my experience each year when I started over with my looped students. Jacobsen (1997) also summarizes this idea when she says, “in a looping class, the first several weeks of the school year are spent on the curriculum—not learning names, going over classroom rules, reviewing the previous years’ material, and assessing students’ skills.”
A huge benefit of looping as described by many researchers has to do with the teacher’s increased understanding of student behaviors, such as shyness, timidity, and discipline problems. Regarding preschool students who looped with their teachers, researchers describe students
“overcoming emotional problems (defiance, shyness, and sensitivity), alleviation of anxiety about the new year, and more self confidence” (Hegde and Cassidy, 2004). With students starting the school year on such a positive note, I have found that it becomes easier to keep an upbeat vibe in the classroom and to invest students better in their own learning and achievements. Little and Dacus (1999) add about the beginning of the school year: “Gone was the student’s apprehension about getting a new teacher. Gone were the lectures about daily procedures and classroom rules. Gone were the weeks of testing, trying to determine a student’s reading level. The teachers and students started the year with a bang and ended
5
further along than the teachers had anticipated.” After three years together, my students and I knew each other very well and they knew exactly what my expectations for them were. Students who may have been shy or withdrawn at the beginning of 6th grade had no problem asking and answering questions, coming to me for help, or even asking me for advice about personal issues by the end of our time together. As one student from Bracey’s research says, “‘If you loop, you probably won’t be scared at the beginning of school. School feels like home’” (Bracey, 1999).
The vast multitude of research that has been done on looping is based on qualitative analysis, with hardly any numerical data to compare whether or not looping is more effective than traditional teaching in regards to student knowledge gains . Delviscio and Muffs (2007) talk about a 4th grade classroom in a school that utilizes looping and the effect it has on student academics. They claim the teachers “are armed with the 4th-grade assessments, which provides them with an even greater understanding of their students’ developing academic strengths and unresolved weaknesses…now the results can be used as both diagnostic and assessment tools.” I have found it extremely beneficial to have multiple years’ worth of data in order to analyze individual student achievement, assess where they are in the curriculum, and give them individualized feedback on what they need to work on.
As with any new method, there are just as many arguments made against looping as an effective educational practice. Most researchers who take this opposing view talk about how the biggest concern parents have with looping is that there could be a conflict between the student and the teacher, and that if they continue to be in such close quarters for a few years, consistent problems could arise which could be detrimental to the child. Jacobsen (1997) mentions that some parents that she surveyed “said their children suffered in school by having a poor teacher for two years. In fact, the possibility that there will be a personality conflict between a child and a teacher is what concerns parents most.” Burke (1997) also sees this possible negative consequence, stating, “the only potential disadvantage of looping
6
regularly mentioned is an inappropriate match, or personality conflict, between teacher and student—a situation that can occur in a traditional classroom as well.” Most districts that utilize multiyear teaching agree that there should be an alternative for parents who do not want their child to have the same teacher multiple years in a row. In my experience, I have found the opposite to be true. Because parents knew who I was and were used to me teaching and interacting with their children, they often requested to have their child in my homeroom, or came to me with general questions about the school because of the relationship we had built over the years. From my own experience, I can really only agree with one negative consequence, as voiced in Katz’ article. She states that “teachers face increased lesson preparation loads under this arrangement because they teach a new grade each year,” which has been my biggest personal struggle throughout the entire looping sequence (Katz, 1999). Katz goes on to say that most teachers she interviewed “indicated that the extra effort was balanced by the rewards of forging closer relationships with students and parents” (1999). While I agree that there is a huge personal benefit for students, parents, and the teacher who are involved in a multiyear system, I think the extra workload has been downplayed in other investigations, particularly if a teacher is creating an entire curriculum from scratch.
By weighing the information I have gathered from my research with my own personal experiences, I believe that the positive effects of looping far outweigh the negative consequences. I greatly appreciated the time the students and I saved at the beginning of the year, which enabled us to dive right into new material and immediately begin building the students’ content knowledge. I also think the relationships I had with both students and parents have been extremely important in my development as a teacher because I achieved a better understanding of how to interact with different personality types and how to teach all different kinds of learners. I really appreciated the bonds I have formed with parents, which made it easier to deal with difficult behavior situations and to get parent
7
support for different projects I wanted to do with their children. From the teacher’s perspective, I think the most difficult part of looping is the time and effort spent in creating a new curriculum each year that is engaging, comprehensive, and adheres to the GLEs laid out by the Louisiana Department of Education. I am disappointed in the lack of quantitative analysis and the connection to student achievement that is missing in the research on looping, and so that is what I strived to focus on in the course of my
investigation. This study was designed to test whether students who looped with the same teacher for the entirety of their middle school Science career had higher academic gains than students who had three different Science teachers throughout middle school, and whether students who looped retained more Science content knowledge after middle school than students who did not loop.
8
LITERATURE REVIEW
In my first year of teaching, beginning in August 2008, I taught 6th and 7th grade Science at Jackson Middle School. The next year, I taught 7th grade Science at the same school, followed by 8th grade Earth Science starting in August 2010. Consequently, I had the same core group of students in their 6th, 7th, and 8th grade years. Because of the growth I saw in my students as well as in myself as a teacher, I wondered what other researchers have learned about the effects of a teacher “looping” with their students. In my investigation, I learned more about the concept, where it is practiced, and what effects other researchers have discovered. I also learned that not a lot of research has been done on this topic, leading me to believe that there is a lot of room for new research about the possible benefits and consequences of looping as a practice to be utilized by school districts in the United States.
Jacobsen (1997) presents an overarching introduction to a subject that she also names “teacher-student progression” and “multiyear grouping.” While Jacobsen does not present quantitative data like that which I gathered, it contains qualitative observations that express mostly positive reasons outlining why looping is a helpful choice for schools. Jacobsen makes apparent from the beginning that “it’s not clear if the practice also boosts student achievement,” and goes on to quote teachers and principals agreeing on this same point. Some of the positive attributes agreed on by those quoted in her research focus on looping’s ability to build stronger relationships between teachers, parents, and students; the time the practice saves in the back-to-school review ritual; the reduction in discipline problems as a result; and the role looping plays in giving students extra time to learn concepts. Teachers have also found that looping is helpful in preventing students from potentially repeating a grade or being classified as special education because their teacher is able to work with them the next year to continue to bring them up to grade level. Jacobsen also notes that looping is most commonly used in Germany, which shows that more research needs to be done in order to fully understand the practice in American
9
For example, those interviewed claim a more structured and secure environment for students, a greater sense of community within the classroom, social benefits of the students interacting and growing more comfortable with each other, and the fact that students come to view their teachers as allies because they spend a good deal of time together. Negative consequences of looping included in the article are the possibility of a personality conflict between the student and the teacher, as well as the fact that parents might want their children to learn with other teachers and other teaching styles. All in all, Jacobsen presents a balanced view of the positive and negative benefits of looping, according to parents and teachers involved in school districts that partake in this practice.
Hegde and Cassidy (2004) present a study regarding teacher and parent perspectives on looping. However, one major lack in their research is that there is hardly any information regarding the potential future academic benefits of looping, as the article focuses on early childhood education. The teachers and parents interviewed experienced a looping system whereby caregivers stayed with students from the time they were toddlers until they entered kindergarten. This age group, while much younger than my own, still shows a number of positive effects of looping that could also be associated with older students. Some of the main benefits noted include: how students were able to overcome different emotional problems children of that age often face, such as shyness and defiance; the alleviation of anxiety about the new school year; a more secure and trustworthy relationship between teacher and student; and an increased self confidence. All of these positive benefits of looping would alleviate problems children usually face when entering a new classroom, regardless of their age group. Another important point mentioned in this case study involves the consistent use of discipline, which I have found to be a very integral part of my own teaching. Challenges and difficulties are also noted, including the skill level of the teachers and their preferred age group/subject matter, the eventual separation and any anxieties it may cause for the students, and the potential for a strained parent-teacher relationship .
10
This article is helpful in outlining the positive and negative consequences of looping as it relates to younger students, which can easily be applied to older students and their situations in school.
The article from the Educational Resources Information Center (Burke, 1997) offers a synthesis of past research, overall praise from practitioners of looping, information about the practice’s success in Europe, and overall conclusions related to looping as a whole. Burke’s conclusions mention the potential for both academic and social benefits (although these are not given concretely), reports of increased student achievement, and the “extra month” of school during the second year of the loop. I think the “extra month” aspect is one of the most interesting points raised in this article because it explains how teachers do not have to begin the year again with outlining discipline policies and reiterating procedures because students already know what to do and so can enter the school year ready to learn. Burke goes on to mention other positive benefits as stated by other authors in this overview, and points out that possible personality conflicts may arise between teachers, students, and parents. Burke ends with the claim that the “essence of looping is the promotion of strong, extended, meaningful, positive
interpersonal relationships between teachers and students that foster increased student motivation, and, in turn, stimulate improved learning outcomes for students.” Overall, while I agree with a number of the points Burke lays out in his article, there is not an abundance of research to support his claims. He seems to take bits and pieces from other articles to draw conclusions, without actually analyzing any data, qualitative or quantitative, to see if the benefits and consequences he discusses are actually a reality.
Out of all of the studies done on the topic of looping, "The Impact of Looping Classroom Environments on Parental Attitudes" is the only piece of research with concrete numerical data collected by researchers who strategically arranged and executed an experimental project. The researchers begin by outlining what they find to be the three main benefits of looping— stability,
11
persistence, and intimacy— and go on to explain how these three factors are oftentimes missing from traditional school set-ups (Nichols and Nichols,2002). Another key point the researchers mention is that, with looping, teachers develop a firm grasp of students’ prior knowledge because they have been actively involved in that development, and so it is easier for the student to grow from there. There is also less chance of repeating knowledge and skills that have already been mastered by the students, and instead allows teachers to put more time and energy into ensuring student mastery of current and future material. Another key point introduced by research on looping is that teachers come to fully understand students’ possible behavioral transgressions, and are thus able to cope with their behavior patterns in a more efficient way. The article goes on to claim that other researchers were able to report greater academic gains associated with looping (versus non- looping). The researchers make an
important point when they say that there has traditionally been a lack of solid evidence in favor of looping, and that is what they are seeking to present.
In this study by Nichols and Nichols, the research presented mainly involves parent and student surveys, and thus relies heavily on qualitative descriptors for people to choose from to identify how they feel about looping. This practice, while effective as one means of research, still bears no correlation to academic gains or successes corresponding to looping. In their conclusion, the researchers point out that looping creates mostly positive attitudes from the parents and students regarding the school and the teacher. Parents are especially positive regarding the overall environment of the school when their children have been members of a looping cohort. Ultimately, the researchers point out that the most significant benefits of looping all deal with student-teacher relationships. They found that teacher knowledge of students is increased with looping, as well as student confidence in their teacher and communication between the teacher and the parents. They also point out that these tight-knit relationships may be lost or compromised when students are perpetually changing teachers and
12
environments every year, as with traditional schooling systems. Looping helps students realize how invested their teachers are in them, which can lead to increased student confidence which, in turn, can pave the way for more stability in their lives.
Nichols and Nichols (2002) utilized a survey instrument to analyze parent reactions to teachers who looped with their children. They broke this information down by the gender, marital status, and income of the parents. Based on a T-test, which measures the similarity between two sets of data, the researchers found that in general, parents who had children that had looped with a teacher for several years had generally more positive reactions to the school and the teacher. Their p-value, or the
probability of whether or not there is a difference between two samples, was less than .05, showing that statistically, there is a significant difference between the attitudes of parents of children that had looped and the parents of children that had not looped.
The article by Little and Dacus (1999) presents research done at a school where looping was implemented after first discussing the idea with parents, teachers, and students. The school
administration offered parents the opportunity to choose whether or not they wanted their children to loop with their teacher for a second year. Teachers interviewed by Little and Dacus described how students seemed to become more confident and have stronger peer relationships after the second year together. The administration and teachers kept notes throughout the second year (the first year of looping) so that they could improve upon their practices for the next year. After the first year of looping, the school decided to offer one looping class in each grade level and two traditional classrooms so that parents could choose what they wanted for their children. The school also implemented mentors for teachers who were unfamiliar with new grade level curricula, which seems to be one of the biggest problems for the teachers. Overall, the article presents a positive view of looping, although it also points out the challenges looping creates as the school continues to evolve.
13
Katz (1999) describes a number of different strategies, including looping, that can be
implemented by schools and school districts in order to lessen interracial and interethnic conflict within schools. Katz begins with the argument that although student populations have been changing over the past few decades, the administrative and teacher populations often remain mostly white and middle class. For this reason, Katz presents a number of different ideas that can be put in place so that students who do not match this socioeconomic profile can feel comfortable and confident in the learning
environment. One of these ideas is looping, which Katz claims helps to create a sense of familiarity and cooperation among parents, teachers, and students. She targets a school where looping was
implemented, and explains the positive and negative effects this practice had upon the students and their learning. The principal of the school described how helpful looping is for students from immigrant families: “By having the same teacher for three years, these students and families do not have to restart the acclimation process each year. Although teachers face increased lesson preparation loads…, most indicated that the extra effort was balanced by the rewards of forging closer relationships with students and parents.” Here, the faculty as a whole found that the negative consequences and frustrations of looping were not as important as the relationships that were forged when the students, teachers, and families spend so much time working together with a common goal of bettering the student’s futures. While significant qualitative research and impressions exist about looping, I found a severe lack of actual research projects and experiments that analyzed not only teacher, student, and parent perceptions of looping, but also quantitative data regarding test scores and overall academic
achievement associated with having the same teacher over several years. In this study, I hope to expand upon the topic of qualitative research regarding looping, while also diving deeper into the seemingly-overlooked realm of quantitative analysis.
14
MATERIALS AND METHODS
For my first year of teaching in the 2008—2009 academic year at Jackson Middle School in Jackson, Louisiana, I was assigned to teach 6th and 7th grade Science. In Louisiana’s curriculum, 6th grade is Physical Science, 7th grade is Life Science, and 8th grade is Earth Science. I taught the entirety of the 6th grade class at the school, and two thirds of the 7th grade. The other Science teacher taught the rest of the 7th grade students, as well as all 8th grade students. At the end of the school year, my principal informed me that there were going to be three Science teachers for the next year (one for each grade level), and so gave me the opportunity to teach 6th or 7th grade. Because I prefer the subject matter, I decided to stay with the 7th grade Life Science. Accordingly, when the 6th graders moved up to 7th grade, I continued to teach them.
On the first day of school for the 2009—2010 academic year, I felt that I was fully prepared for the new school year. I was extremely familiar with the course content, I had good relationships with the students, and I had revamped my curriculum over the summer to include more labs, better activities, and enhanced PowerPoints for more streamlined content delivery. When the first students lined up outside my classroom at 7:45 a.m., I had their seats already assigned based on the behaviors I had come to know very well, their groups organized based on their interactions with each other, and their first assignment on the board. I did not need to tell them what to do; they remembered my beginning of class procedures from the year before. We spent about 10 minutes reviewing how I run my classroom and the expectations I have for my students, 15 minutes catching up about our summer vacations, and the rest of the 80-minute class delving right into new material. I felt as if I had gained at least a month of time compared to my first year, when I had spent so much of the beginning of the year redirecting minor misbehaviors, getting to know students’ behavioral and academic strengths and weaknesses, and introducing students to the way I ran my classroom and what my expectations were for how we would work together throughout the year. By looping with my students through 6th and 7th grade, not only did I
15
gain precious instructional time, but I also was able to form strong bonds with my students and their families, cater to their individual needs, and grow in confidence as an instructional leader in my classroom.
After spending two years with the same students, experiencing their teenage ups and downs with them, and becoming so comfortable interacting with them that to get them quiet required only a single glance, I knew that I needed to see them through their entire middle school career. I jumped at the chance to teach them 8th grade Earth Science and prepare them for the culmination of their middle school Science learning, the 8th Grade LEAP (Louisiana Educational Assessment Program) test. Together, we had overcome a lot of demanding obstacles, and I knew it was important to face the challenge of 8th grade together. It was around this time that I started to realize how lucky I had been to spend three years with such an amazing group of students. The realization that their performance on the Science section of the LEAP would depend so critically on how well I had taught them over three years made me quite nervous, but also gave me a sense of confidence because I knew how hard I had worked with them to prepare them. I had seen other instances in the past where a teacher had a lot of success with a student and had sent them to the next grade with confidence that they would continue to be flourish, only to see the student’s grades slip or their behavior prevent them from achieving their full potential. I felt that I had worked very hard with my students, done all I could to ensure their success, and was excited to see the results of our three years of hard work. Additionally, at the end of their 8th grade year, I was able to send my students off to high school knowing that I had worked as hard as I could for them, and that I had helped to bring out the best in them both academically and behaviorally.
In order to assess how my students had fared academically compared to a group of students who had not looped with their Science teacher, I needed to find a control group with similar
16
Clinton Middle School. In 2010, due to budget cuts, the schools were combined into a single institution, East Feliciana Middle School. Students who had attended Clinton Middle School during the time that I was looping with students in Jackson Middle School (2008—2010) had a different Science teacher every year. Therefore, I was able to gather standardized test data from all of these students after their 6th and 7th grade iLEAP (integrated Louisiana Educational Assessment Program) and after their 8th grade LEAP.
Table 1 compares the various sociodemographic characteristics of the population of students that attended the three schools throughout the time of this study. All three schools were classified as Title 1 schools, meaning that they were low-performing, high-poverty schools. All students in the study had Teach for America teachers in their Science classes over this time period, meaning that the way in which they were taught as well as curriculum and assessment materials were markedly similar.
Table 1: Summary of the student population in East Feliciana Parish 2008—2010 (Jackson Middle School and Clinton Middle School); summary of the student population in East Feliciana Parish 2010— 2011 (East Feliciana Middle School).
Summary of Student Populations
Jackson Middle School (2008—2010)
Clinton Middle School (2008—2010)
East Feliciana Middle School (2010—2011) Free and Reduced
Lunch
97% 91% 92%
Ethnicity 80% African American; 20% Caucasian
88% African American; 12% Caucasian
89% African American; 11% Caucasian
Gender 53% Female; 47% Male 54% Male; 46% Female 55% Female; 45% Male
Location Rural Louisiana Rural Louisiana Rural Louisiana
The LEAP and iLEAP are the standardized tests that the State of Louisiana currently uses to
measure student academic growth. The tests are administered near the end of each school year, usually in April. According to the Louisiana Department of Education, “Based on Louisiana’s Grade-Level
17
Expectations (GLEs), the LEAP measures 4th- and 8th-grade students’ knowledge and skills in English Language Arts, math, science, and social studies…the iLEAP tests are administered in grades 3, 5, 6, and
7 and align with Louisiana’s content standards, benchmarks, and Grade-Level Expectations in English Language Arts, Mathematics, Science, and Social Studies. The iLEAP was developed in response to No
Child Left Behind, the current federal education act …the iLEAP is referred to as an “integrated” LEAP
because it combines a norm-referenced test, which compares a student’s test results to the
performance of students in a national sample, with a criterion-referenced test, which reports student results in terms of the state’s achievement levels. Students are graded along the achievement levels of
Unsatisfactory to Advanced (Integrated Louisiana Educational Assessment Program (iLEAP)).” On both
tests, students are scored on a scale of 100—500 points on each section (English Language Arts,
Mathematics, Science, and Social Studies). Table 2 summarizes when students are tested on the 5 main Science strands on the iLEAP and LEAP.
Table 2: When students are tested on the 5 Louisiana Science strands
When Are Students Tested on the 5 Main Science Strands?
6th Grade iLEAP 7th Grade iLEAP 8th Grade LEAP
Science Inquiry Tested Tested Tested
Physical Science Tested Tested
Life Science Tested Tested
Earth Science Tested
Science and the Environment
18
Retention
When the students I had looped with reached 9th grade, they encountered many students from other schools that had had different experiences, and I began to wonder how they compared to those students based on their knowledge of middle school Science. I wanted to see how students that looped with me for three years retained the basic concepts of middle school Science compared to students who had had three different teachers during middle school. I wanted to create an assessment that accurately tested their knowledge, but was completely unbiased. The assessment needed to be based on
information all middle school students should have learned in Science class, and it needed to cover information that was deemed important by the Louisiana Department of Education. To create this assessment, I used the Louisiana Department of Education’s EAGLE (Enhanced Assessment of Grade-Level Expectations) System, a program that the State of Louisiana uses as an assessment tool. By using this program, I was able to go through the Grade Level Expectations (GLEs) students are expected to learn in middle school Science and pick out key concepts that students should have a strong
understanding of in order to be successful in their high school Science courses. I focused on four main areas: Physical Science, Life Science, Earth Science, and Science Inquiry. Science Inquiry is a set of standards that deals with the scientific method, experiments, data collection and analysis, and other skills that students need in order to understand the concepts of Science. In Louisiana middle schools, Science Inquiry is comprised of a list of 40 GLEs that are the same from 5th—8th grade, and students should learn and review the concepts in addition to the content knowledge that is required at each grade level. For the assessment, I picked 10 Science Inquiry questions, 10 Physical Science questions, 10 Life Science questions, and 10 Earth Science questions.
In August of 2011, I went to East Feliciana High School and administered the Middle School Retention Assessment to students currently enrolled in 9th grade Physical Science. I was allowed to take
19
the class for an hour of its two-hour block to have the students complete the assessment. It was counted as a participation grade in their Science class, and they received a bag of chips for completing the test and for trying their best (not rushing through, not just marking anything, etc.). I spent a day in the classroom and administered the test to 68 students over 4 periods. 21 students looped with me for three years, 4 looped with me for two years, and 33 did not loop with me at all. I returned in May of 2012 and again went to the Physical Science classroom. I administered the same assessment in one hour of the two-hour block and gave chips to students who worked hard. This time, I gave the test to 58 students. Of these students, 20 looped with me for three years, 8 looped with me for two years, and 30 did not loop with me at all.
Complicating Factors/Systemic Uncertainties
Throughout the entirety of my experiment, there were a number of factors that were out of my control and could have negatively impacted the inherent structure of my study. As discussed above, when I first started teaching in East Feliciana Parish, there were two middle schools in the district. By my third year, budget cuts had forced the merging of the schools into the solitary East Feliciana Middle School. Accordingly, while the students I looped with were under my teaching jurisdiction for their 6th, 7th, and 8th grade years, the students in my control group had three different teachers during their middle school career— their 8th grade Science teacher just happened to be myself. Ideally, I would have preferred for the students to have had three different Science teachers while at their own school. Unfortunately, the budget is out of my control, and the result was that my control and experimental groups combined for the third year.
20
Outside of my Science classroom, the merging of two rival schools in a rural parish in Louisiana created a multitude of problems during the third year that had not occurred throughout the first two. Students that had not been inside a classroom together before came into contact with one another, and many issues arose stemming from cultural and social differences and disagreements. Overall, student behavior took a downward turn, as students from both sides of the district endeavored to find their new place in the merged school. There was also the issue of creating a school culture that encompassed aspects of both previous school communities so that students felt comfortable in the new environment. For the students I had taught for two years already, I was disappointed in the setback in the culture and behavioral expectations we had worked hard to establish, which caused a number of students to face suspensions and expulsions. Loss of class time was a big problem for a number of students, which meant that they were not learning the material as well as they had in previous years and that they were not reviewing material they had learned in the two years prior to ensure that they remembered it. Because students were missing more class time, their unit tests, grades, and overall LEAP scores suffered, dramatically in some cases. Whereas in the second year of looping with my students we had been able to start with new material on day 1, in my third year, I needed to yet again take time to establish classroom norms and procedures, familiarize half of the students with my behavioral and academic expectations, and begin to formulate relationships with these new individuals. Although it was not ideal to use instructional time on logistics with which half of the students were already familiar, it did not take as long to familiarize the new students with the classroom routines as it normally would. The half of the class that had been with me for two years helped the rest of the students to assimilate into their new surroundings.
Another issue results from the transient living situation of some of the students I encountered in rural Louisiana. While we had a very strong culture at Jackson Middle School, one that encouraged
21
positive student development both academically and behaviorally, student home lives exist
independently of the school structure. Oftentimes, without warning, students would move from the area to go live with a parent or relative somewhere else. Several other students came halfway through the year, or a few weeks before state testing. Three students who I had taught for over two and a half years left in February/March of 2011, meaning that they missed the last month or so before the LEAP test, although we had been together for two and a half years already. Because of the occasional movement of students throughout this study, I ended up with three main groups: students who looped for three years, students who looped for two years, and students who did not loop at all. The main groups I focused on were the three-year looping group and the unlooped group, although the 2-year looped group helped provide some additional statistical analysis. The 2-year looped group is comprised of students who I had for two years, either for 6th and 7th grade or for 7th and 8th grade. These are students who either left the school after two years, entered the school after one year, or were retained in a grade level. In the 3-year looped group, there were 35 students, the unlooped group had 41 students, and the 2-year looped group had 17 students.
These factors, while detrimental as a whole to what I focused on in my study, could nevertheless not be avoided. The inherent nature of the study is still intact: the experimental group had one teacher for all three years of middle school Science, and the control group had three different teachers for the same three years of middle school Science.
22
DATA AND RESULTS
An analysis of student iLEAP and LEAP scores over this three-year period provides information
about how the experimental and control groups changed over time. While it is impossible to say for sure if these results were solely based on whether or not students looped with their Science teacher, it is highly likely that changes were at the very least influenced by looping, due to the number of other factors that remained the same between the experimental and control groups. Histograms in Figures 1—3 provide a depiction of how scores were distributed between the two groups in the three standardized tests they took.
In Figure 1, which shows results from the 6th grade iLEAP, two outliers from the control group
are clearly indicated, with scores of 100 and 114. All students start each assessment with a score of 100, indicating that these particular students either did not answer any questions correctly, got a minimal number of questions correct, or did not answer any questions at all. Based on the distribution seen in this histogram, we can see that those two data points lie outside of the normal distribution. Additionally, the mean for the unlooped group after the 6th grade year was 286.0 and the standard deviation was 50.5. For the student who scored 100 on the test, that score is 3.7 standard deviations from the mean; the score of 114 is 3.4 standard deviations from the mean. The chance of getting a result at random 3.4 standard deviations or more from the mean is less than 0.0006; for a 3.7 standard deviation from the mean, the probability of this being a random fluctuation is less than 0.0002 (Cherry, 2012). Had this experiment been performed thousands of times, there is a chance that these two scores could have been random, but because the sample size is so small, there is a justification in attributing these results to some other cause— namely, that the students had decreased motivation to perform to their full potential. It is fair to exclude these two outliers because they are proven to be caused by a systematic effect other than randomization. After excluding these two outliers, a T-test of the difference between
23
the two groups resulted in a p=value of 0.17, indicating that the groups were statistically similar after one year of middle school Science (Table 3).
Figure 1: Histogram of student performance on 6th grade iLEAP, 2009.
In 2009, after one year of middle school Science, iLEAP results indicate that the two populations
of students were similar (Figure 1, Table 3). In 2010, after the experimental group looped with their Science teacher and the control group had two different teachers, the p-value of iLEAP scores of the two
groups shows that the groups were most likely significantly different. The difference between the groups can be seen in Figure 2, as well. In 2011, however, after the experimental group had the same
24
Science teacher for three years and the control group had three different Science teachers, the LEAP results again suggest no significant difference between the two groups (Figure 3, Tables 3 and 4).
Figure 2: Histogram of student performance on 7th grade iLEAP, 2010
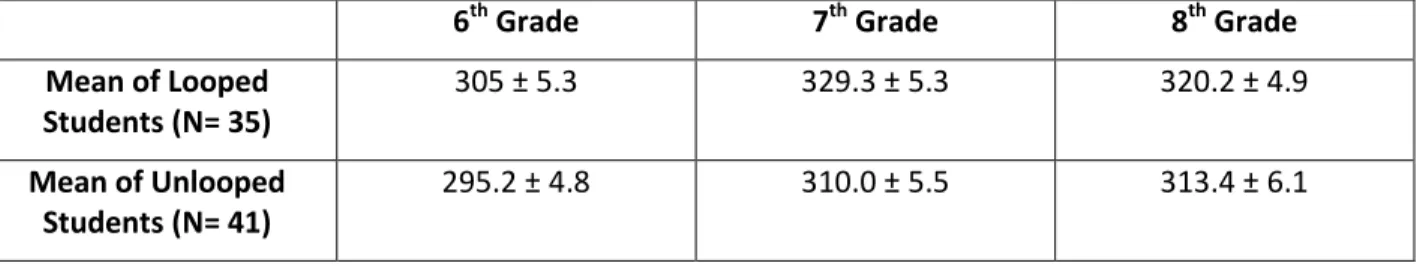
Table 3 and Table 4 indicate that when the two populations started out, the difference between them was negligible— the populations were inherently similar. After their 7th grade year, there was a strong indication of a difference between the two groups. This difference probably stemmed from the fact that the experimental group had the same Science teacher for two years in a row, and their
knowledge of the content was stronger than the control group’s as a result. After the students took the 8th grade LEAP, however, the p-value indicates that the groups were once again statistically similar. This
25
similarity apparently stems from the fact that both groups had the same Science teacher for this third year, and the fact that the experimental group had now looped with the same teacher for three years proved not to cause enough difference between the groups when they were placed in the same class together. Having the same teacher for two years in a row makes a difference in student academic gains. We would assume that having the same teacher for three years in a row would also show an increase in student academic gains; unfortunately, presumably due to the number of factors that occurred in the 8th grade year that were outside of the study’s control, we did not see a difference between these two groups.
26
Table 3: P-values of Students on iLEAP/LEAP: Looped (experimental) group vs. Unlooped (control) group.
Table 4: Mean of Students on iLEAP/LEAP: Looped (experimental) group vs. Unlooped (control) group.
6th Grade 7th Grade 8th Grade
Mean of Looped Students (N= 35) 305 ± 5.3 329.3 ± 5.3 320.2 ± 4.9 Mean of Unlooped Students (N= 41) 295.2 ± 4.8 310.0 ± 5.5 313.4 ± 6.1
A comparison of the normalized gains between the two groups gives a p-value that also shows that the two groups are the same after three years. To find the normalized gains, I compared the overall gains for each group from the 6th grade iLEAP to the 8th grade LEAP. The normalized gains for the
experimental group are 0.08 ± 0.02, while the normalized gains for the control group are 0.13 ± 0.02. A T-test of the normalized gains gives a p-value of 0.11, showing that there is no significant difference between the two groups. Thus, the p-values of state test scores over time and an analysis of the normalized gains indicate that overall in this study, there is no strong evidence for improvement due to looping.
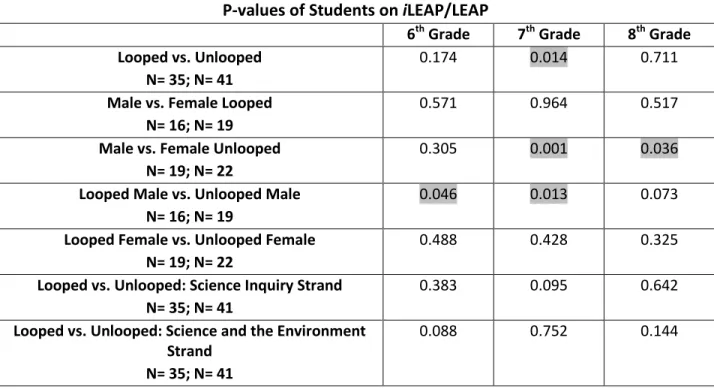
Raw data values are listed in Appendices A—C. When we break the data down into different groups, we get p-values that are mostly consistent with finding no result overall, but also a few discrepancies (Table 5). P-values that are less than 0.05 are highlighted in gray. There is a statistically significant difference between the males and the females in the control group after the 7th and 8th grade years (Male vs. Female Unlooped).
6th Grade 7th Grade 8th Grade
Looped vs. Unlooped N=35; N=41
27
Table 5: P-values of different student groups on iLEAP/LEAP, 2009—2011
The larger difference in 7th grade scores is probably why there is also a significant difference between the looped and unlooped males in 7th grade. The analysis of the two groups of males is consistent with the idea that the populations were significantly different after two years with the same teacher. The populations were again statistically similar after the third year, emphasizing that events occurred to disrupt the natural progression that is indicated after the first two years of looping. When we look at the two strands that are tested in all three grade levels (Science Inquiry and Science and the Environment), again the results indicate that there is no difference between the two groups.
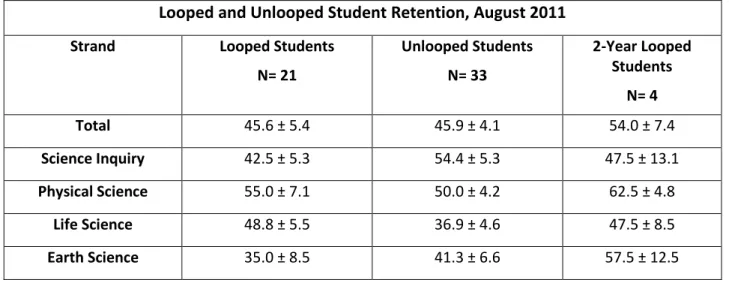
Table 6 and Table 7 show student averages from the EAGLE retention assessment. A comparison of average performance indicates that the experimental and control groups perform similarly (Table 8). In every strand between August 2011 and May 2012, both the looped and unlooped student averages decreased. In 9th grade, students in Louisiana take Physical Science. At the very least, their scores in
P-values of Students on
i
LEAP/LEAP
6th Grade 7th Grade 8th Grade Looped vs. Unlooped
N= 35; N= 41
0.174 0.014 0.711
Male vs. Female Looped N= 16; N= 19
0.571 0.964 0.517
Male vs. Female Unlooped N= 19; N= 22
0.305 0.001 0.036
Looped Male vs. Unlooped Male N= 16; N= 19
0.046 0.013 0.073
Looped Female vs. Unlooped Female N= 19; N= 22
0.488 0.428 0.325
Looped vs. Unlooped: Science Inquiry Strand N= 35; N= 41
0.383 0.095 0.642
Looped vs. Unlooped: Science and the Environment Strand
N= 35; N= 41
28
Physical Science between August and May should have increased after going through that curriculum. Because almost all scores decreased in both groups, especially the Physical Science scores, there is an indication that other factors were at work when students took the retention assessment in May 2012.
Table 6: Student averages on EAGLE retention assessment, August 2011
Looped and Unlooped Student Retention, August 2011
Strand Looped Students
N= 21 Unlooped Students N= 33 2-Year Looped Students N= 4 Total 45.6 ± 5.4 45.9 ± 4.1 54.0 ± 7.4 Science Inquiry 42.5 ± 5.3 54.4 ± 5.3 47.5 ± 13.1 Physical Science 55.0 ± 7.1 50.0 ± 4.2 62.5 ± 4.8 Life Science 48.8 ± 5.5 36.9 ± 4.6 47.5 ± 8.5 Earth Science 35.0 ± 8.5 41.3 ± 6.6 57.5 ± 12.5
Table 7: Student averages on EAGLE retention assessment, May 2012
Looped and Unlooped Student Retention, May 2012
Strand Looped Students
N= 20 Unlooped Students N= 30 2-Year Looped Students N= 8 Total 37.6 ± 6.8 35.3 ± 4.0 42.1 ± 6.6 Science Inquiry 38.8 ± 5.5 37.5 ± 5.4 47.5 ± 7.3 Physical Science 46.3 ± 8.6 39.4 ± 6.4 53.8 ± 7.8 Life Science 41.3 ± 9.7 34.4 ± 4.5 38.8 ± 10.4 Earth Science 23.8 ± 9.4 28.8 ± 5.6 27.5 ± 7.5
29
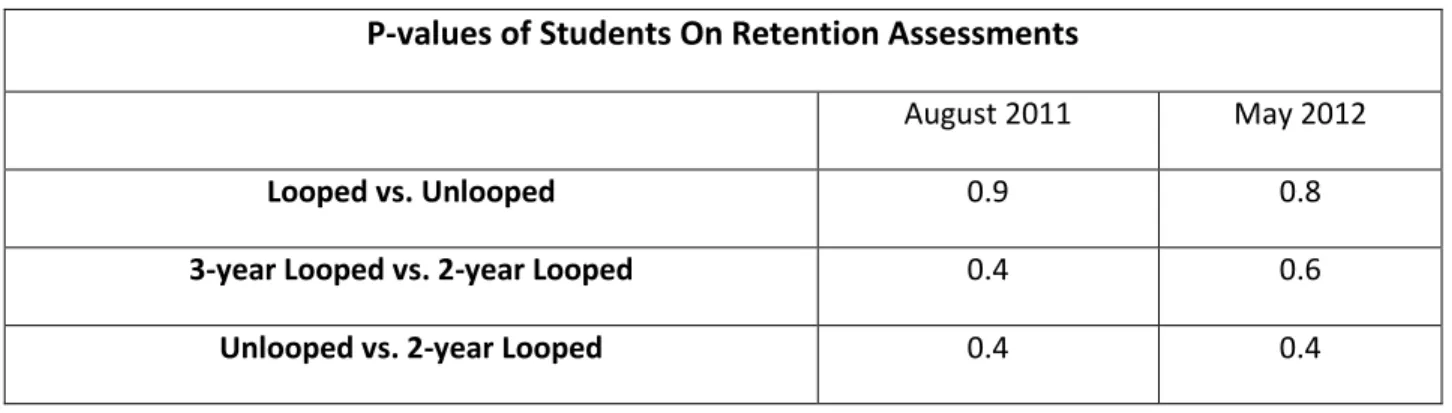
Table 8: P-values of different student groups on EAGLE retention assessment
P-values of Students On Retention Assessments
August 2011 May 2012
Looped vs. Unlooped 0.9 0.8
3-year Looped vs. 2-year Looped 0.4 0.6
Unlooped vs. 2-year Looped 0.4 0.4
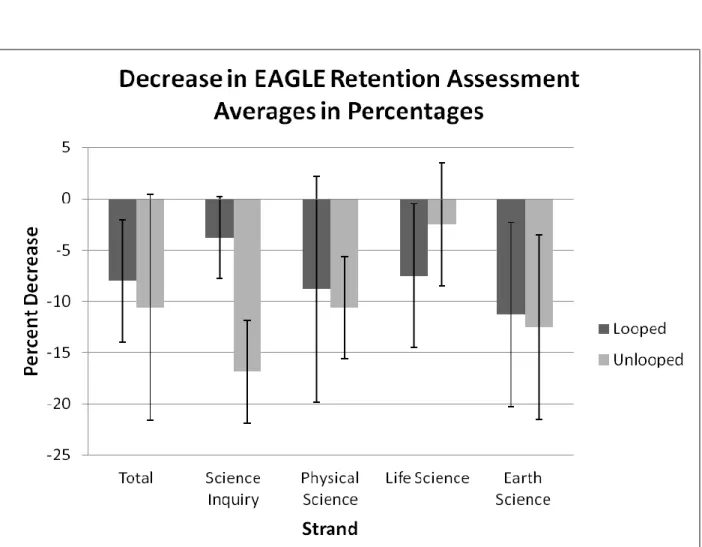
When we examine the amount of decrease in student retention scores from August to May, we can see which group decreased in knowledge the most. Table 9 shows the amount of decrease in both the control and experimental groups for each strand tested. After finding the gains for each individual student, I ran a t-test to determine if the looped and unlooped groups were similar in the amount by which their retention decreased. Overall, the differences between both groups regarding the five
different Science strands and were negligible; the two groups decreased in knowledge by statistically the same amount (Table 9, Figure 4). For the Science Inquiry strand, the looped students retained more content knowledge than the unloooped students; even though both groups decreased, the looped students decreased by a smaller amount. According to the p-value of 0.06, though, those decreases are statistically similar (Figure 4).
30
Table 9: Decrease in EAGLE Retention Assessment Averages, August 2011— May 2012
Decrease in EAGLE Retention Assessment Averages, August 2011—May 2012 (in percents)
Looped Students N= 20 Unlooped Students N= 30 Total -8 ± 6 -11 ± 4 Science Inquiry -4 ± 4 -17 ± 5 Physical Science -9 ± 11 -11 ± 5 Life Science -8 ± 7 -3 ± 6 Earth Science -11 ± 9 -13 ± 9
31
SUMMARY AND CONCLUSIONS
Literature on academic looping often highlights the qualitative benefits of the practice to the student/teacher relationship while pointing out the possible negative effects, yet hardly ever provides concrete quantitative analysis that shows whether or not looping has a strong positive academic effect. This study attempted to find a definite statistical correlation between looping in middle school Science classes and academic performance on state tests, as well as a positive connection between looping and retention of middle school Science content. State test data (iLEAP and LEAP) over a three-year period
from a group that had the same Science teacher for three years and a group that had three different Science teachers over the same three years shows that the populations were initially statistically similar. The data also indicates that there was a definite difference between the groups after the second year, indicating that looping may have caused the experimental groups’ scores to increase more than the control groups’ scores. However, at the end of the final year of middle school, the two populations were once again statistically similar; the most likely explanation for this change is the multitude of
extenuating factors which significantly changed the school environment, and were outside of the study’s control. The EAGLE retention assessment given twice during the students’ first year of high school further emphasized that there was no statistically significant difference between the students who looped with the same teacher for three years and the students who had three different teachers during middle school. Additionally, the retention assessment data shows that there were other factors at work, which caused the student averages on the test to decrease, sometimes significantly, over time.
Although this study sought to provide concrete proof of the academic benefits of looping, the experiment was fraught with difficulties outside of the control of the study that prevented a realistic analysis of whether or not there actually was a statistically significant difference between the two groups. While these problems affect the analysis of looping over a three year period, the differences between the groups after the first two years shows that looping can have a positive impact
32
academically, and so there is no academic reason for schools not to utilize looping as an effective teaching practice. In the future, this experiment should be repeated with two completely discrete groups of students to see if any positive academic correlations of looping can be found. Like other studies performed in the past, I have to conclude that, aside from the differences we saw after the first two years of the test, the most significant outcomes came from the interpersonal relationships that were formed between the teacher and the students who looped for three years together. While this conclusion is not based on quantitative data, as the only numbers analyzed in this study were student test results, the statements, attitudes, and opinions of the parents, teacher, and students involved in the looping process provide qualitative proof that positive interpersonal relationships that result from looping can assist in students’ academic gains.
33
REFERENCES
Bracey, Gerald W. “Going Loopy for Looping.” Phi Delta Kappan. October 1999. 169-170.
Burke, Daniel L. “Looping: Adding Time, Strengthening Relationships.” ERIC Clearinghouse on Elementary and Early Childhood Education Campaign. 1997-12-00.
Cherry, Michael. “Statistics Questions.” E-mail to Mary Feighery. 07 Jun. 2012.
Delviscio, James J., and Michael L Muffs. “Regrouping Students.” School Administrator 64.8 (2007): 26-30. Educational Administration Abstracts. EBSCO. Web.
Hegde, Archana V., and Deborah J. Cassidy. "Teacher and Parent Perspectives on Looping." Early Childhood Education Journal 32.2 (2004): 133-138. Academic Search Complete. EBSCO. Web. 22 Mar. 2011.
"Integrated Louisiana Educational Assessment Program (iLEAP)." iLEAP. Web. 06 June 2012. <http://www.doe.state.la.us/topics/ileap.html>.
Jacobsen, Linda. “’Looping’ Catches on as a Way to Build Strong Ties.” Education Week. Vol. 17, Issue 7. (1997): 1. Academic Search Complete. EBSCO. Web. 20 Mar. 2011.
Katz, Anne. “Keepin’ it Real: Personalizing School Experiences for Diverse Learners to Create Harmony and Minimize Interethnic Conflict.” Journal of Negro Education. Vol. 68, No. 4 (Fall 1999). Copyright 2001, Howard University. 496- 510.
Little, Thomas S., and Nannette B. Dacus. “Looping: Moving Up with the Class.” Educational Leadership
September 1999:42- 45.
"Louisiana Educational Assessment Program (LEAP)." LEAP. Web. 06 June 2012. <http://www.doe.state.la.us/topics/leap.html>.
Nichols, Joe D., and Get W. Nichols. "The Impact of Looping Classroom Environments on Parental Attitudes." Preventing School Failure 47.1 (2002): 18. Academic Search Complete. EBSCO. Web. 22 Mar. 2011.
34
APPENDIX A: LOOPED STUDENT PERFORMANCE ON iLEAP/LEAP
Males
Student 2009 2010 2011 Gain 2009—2011 aah 267 312 281 14 aih 332 320 312 -20 arr 332 361 336 4 hao 349 383 350 1 hit 381 420 393 12 lui 349 383 380 31 mua 315 328 336 21 nha 319 324 312 -7 oee 274 304 276 2 oue 296 297 293 -3 rhe 328 351 336 8 seo 253 297 301 48 trr 244 284 293 49 uiy 301 316 332 31 umy 301 297 345 44 yor 296 288 305 9 AVG 308.6 ± 9.3 329.1 ± 9.9 323.8 ± 8.4 15.3 ± 5.135
Females
Student 2009 2010 2011 Gain 2009—2011 aii 319 312 309 -10 anh 332 346 355 23 anr 319 341 332 13 bdl 285 375 320 35 boa 323 312 316 -7 cri 315 361 316 1 cua 291 324 320 29 dun 244 320 285 41 ecy 332 324 293 -39 eey 296 316 332 36 eil 336 368 383 47 meo 306 324 320 14 mra 315 361 320 5 nue 233 288 285 52 rle 296 320 285 -11 sie 301 320 336 35 tan 306 308 297 -9 yaa 301 301 289 -12 yoe 291 341 332 41 AVG 302.2 ± 6.2 329.6 ± 5.5 317.1 ± 5.9 14.9 ± 5.8Overall Looped Students
2009 2010 2011 Gain 2009—2011
36
APPENDIX B: UNLOOPED STUDENT PERFORMANCE ON iLEAP/LEAP
Males
Student 2009 2010 2011 Gain 2009—2011 baa 261 264 281 20 dce 315 341 355 40 did 375 361 393 18 ihr 261 279 285 24 iol 253 264 258 5 loe 291 284 289 -2 lro 244 264 297 53 mhi 274 301 305 31 mna 291 308 272 -19 moa 285 316 345 60 nle 319 337 332 13 oae 301 320 336 35 ria 267 234 242 -25 rly 285 301 301 16 roo 280 304 253 -27 rua 267 243 301 34 uca 306 308 305 -1 vue 100* 251 199 99 wid 291 328 336 45 AVG 277.2 ± 12.0 295.2 ± 8.1 299.2 ± 10.3 22.1 ± 7.137
Females
Student 2009 2010 2011 Gain 2009—2011 aeh 296 258 289 -7 aei 354 351 361 7 aih 306 351 345 39 day 310 361 324 14 ecy 291 332 309 18 eol 301 308 305 4 err 345 356 367 22 eur 114* 251 309 195 has 267 304 305 38 hhs 291 328 309 18 kaa 310 328 361 51 mre 354 346 361 7 naa 267 301 315 48 ora 291 301 305 14 rra 332 356 336 4 rre 323 351 405 82 saa 319 304 316 -3 sae 301 320 320 19 sea 285 293 297 12 see 244 320 293 49 sha 285 356 305 20 tra 274 324 328 54 AVG 293.6 ± 10.4 322.7 ± 6.6 325.7 ± 6.3 32.0 ± 9.1Overall Unlooped Students
2009 2010 2011 Gain 2009—2011
Average 295.2 ± 4.8 310.0 ± 5.5 313.4 ± 6.1 27.4 ± 5.9
38
APPENDIX C: 2-YEAR LOOPED STUDENT PERFORMANCE ON iLEAP/LEAP
Males
Student Year 1 Year 2 Gain Year 1—Year 2
aah 375 340 -35
aoy 296 304 8
yaa 294 328 34
AVG 321.7 ± 26.7 324.0 ± 10.6 2.3 ± 20.1
Females
Student Year 1 Year 2 Gain Year 1—Year 2
ach 297 268 -29 auh 332 355 23 dun 284 293 9 eah 332 350 18 eri 356 361 5 ihl 316 293 -23 mca 320 285 -35 moa 346 340 -6 naa 356 383 27 rca 291 301 10 uca 337 350 13 uch 337 345 8 vee 361 355 -6 voa 280 316 36 AVG 324.6 ± 7.3 328.2 ± 9.3 3.6 ± 5.6
Overall 2-Year Looped Students
Year 1 Year 2 Gain Year 1—Year 2
39
VITA
Mary Feighery was born in Yonkers, New York in September 1986. She attended elementary and middle school in Yonkers, and graduated from Loyola School in New York, New York in May 2004. The following August she entered the University of Notre Dame and in May 2008 earned her degree in American Studies and Africana Studies. She entered the Graduate School at Louisiana State University Agricultural and Mechanical College in June 2010 and is a candidate for a Master of Natural Sciences. She taught middle school Science in East Feliciana Parish from August 2008—May 2011 before moving to New Orleans to try her hand at a series of charter schools. She is currently embarking on her teaching adventure in Tanzania.