ESSAYS IN HIGHER EDUCATION ECONOMICS
A Dissertation
Presented to the Faculty of the Graduate School
of Cornell University
in Partial Fulfillment of the Requirements for the Degree of
Doctor of Philosophy
by
Amanda Leigh Griffith
August 2009
ESSAYS IN HIGHER EDUCATION ECONOMICS
Amanda Leigh Griffith, Ph.D.
Cornell University, 2009
One of the main issues at the forefront of higher education policy discussions
in the last decade concerns the under-representation of low-income and minority
students at our nation’s more selective colleges and universities. This dissertation
focuses on this issue by examining the factors that impact on the college application
decisions of low-income and minority students, as well as their success in selective
colleges and universities after matriculation and finally by investigating how the use
of merit-based financial aid programs affects the representation of low-income and
minority students and other institutional spending patterns.
The first essay uses the
National Longitudinal Survey of Youth: 1997
to
examine how the distance from one’s home to the nearest selective college or
university affects a student’s decision to apply to a selective college or university.
Students that live near to a selective colleges or university may be more likely to apply
to this type of institution, both because of the lower costs, and also possibly due to
increased knowledge of the opportunities available at this type of college. The results
show that as distance to a selective college decreases, students are more likely to apply
to one, and not necessarily the closest one. Colleges may be able to increase the
representation of low-income students in their application pools by increasing the
information available to students living far away from any selective institutions.
The second essay examines the success of low-income and minority students
after they enroll at elite colleges and universities. I use the restricted access versions
of the
National Longitudinal Survey of Freshmen
and the
National Education
impact educational outcomes such as GPA, persistence and college major choice. I
find that on average, minorities and students from low-income families achieve lower
grade point averages and are less likely than other students to graduate within 6 years.
Poor academic fit can negatively impact grades, but has little effect on persistence.
Income peer group size does not affect grades or persistence, but does play a role in
college major choice. Same race peer group size influences grades and persistence in
addition to affecting college major choice.
The third essay focuses on the increased use by private colleges and
universities of financial aid based on “merit”, as opposed to based solely on financial
need. Using data from the College Board’s
Annual Survey of Colleges
and other
secondary data sources I examine how the increased use of merit aid impacts upon the
socioeconomic and demographic composition of student bodies, and how faculty
salaries, tuition costs, and the use of adjunct faculty members changes after a change
to a merit-aid policy. Results show that the percentage of students from low-income
and minority families decreases following the introduction of merit-aid, and several
institutional expenditure and student cost categories also change.
BIOGRAPHICAL SKETCH
Amanda Leigh Griffith grew up in Vershire, Vermont and graduated from
Thetford Academy in 2000. She attended Colgate University in Hamilton, New York,
graduating in May of 2004. At Colgate she double-majored in Biology and
Economics, receiving Honors in the first and High Honors in the second. Following
graduation, she began her graduate studies in Economics at Cornell University with a
National Science Foundation Graduate Research Fellowship. She received her Master
of Arts in Economics in January of 2008 and will receive her Doctor of Philosophy
Degree in August of 2009. Following completion of her degree, she will become an
assistant professor of Economics at Wake Forest University.
ACKNOWLEDGEMENTS
First and foremost, I would like to thank my committee chair, Ron Ehrenberg.
I would not be where I am today without his support and guidance. I would like to
thank him for his constant support of my personal and professional goals and his
tireless efforts to help me achieve those goals.
I would also like to thank my other two committee members, Steve Coate and
George Jakubson. Both have taught me so much during my time at Cornell and have
helped me to think about research questions in new and better ways. Both have
provided me with great role models in the classroom. Another professor, George
Boyer, has also helped to make my graduate years easier through his support and his
sense of humor and for that I thank him.
Donna S. Rothstein played an important role in this dissertation, as she served
as co-author for the first essay. I learned a lot from this partnership, and her
comments and help were essential to the completion of the first essay.
There are many of my fellow students that have made my time here at Cornell
enjoyable and have helped me to improve my research. I want to thank Ian Schmutte
and Jessica Bean for all of their help in the first-year and in the years since. I couldn’t
have picked two better people as study partners or friends. I would like to thank the
CHERI group for their many helpful comments. In particular, I value my friendships
with Albert Liu, Joyce Main, and Josh Price, who helped to keep my stress levels low
during the job market. I also have benefited greatly from interactions with other
fellow students: Chris Cotton and Joe Price.
One of my greatest supporters, friends, and someone who I would have been
lost without is Darrlyn O’Connell. Thank you for all of your help and support, and for
always being there to listen.
I was extremely lucky to have worked with Kevin Rask as an undergraduate
student at Colgate University. He first introduced me to economic research and I
almost certainly would not be an economist today if I had not had the opportunity to
work with him on a research project as a student. In addition, he has been a valuable
source of support and information throughout graduate school, and particularly during
my job search.
And last, but certainly not least, I would like to thank my friends and family
for their support and love. I am lucky to have many friends from all periods of my
life. I would like to thank Emma Batchelder, Alice Guo, Alexa Tonkovich, Diep
Nguyen, and Tiffanie Reid in particular. My sister, Jessica, is one of my biggest
cheerleaders. Most of all, I want to thank my parents, Tom and Pam Griffith. I
couldn’t have done any of it without their love, support and help. Thank you for
always believing in me and always being there for me. I am who I am today because
of your influence on me.
TABLE OF CONTENTS
Biographical
Sketch
iii
Dedication
iv
Acknowledgement
v
Table
of
Contents
vii
List
of
Figures
viii
List of Tables
ix
Chapter
1:
Introduction 1
Chapter 2: Can’t Get There From Here: The Decision to Apply to a
Selective College
I.
Introduction
5
II. Prior Literature
8
III.
Empirical
Approach
10
IV.
Data
and
Variables 12
V. Descriptive Statistics
14
VI. Results
19
VII.
Conclusion 28
References
(Chapter
2) 31
Chapter 3: Determinants of Grades, Persistence and Major Choice for
Low-Income and Minority Students.
I.
Introduction
33
II.
Background
and
Empirical
Approach
35
III.
Data
and
Descriptive
Statistics
42
IV.
Results:
Determinants
of
GPA
50
V.
Results:
Persistence 60
VI.
Results:
Instrumental
Variables
Approach 66
VII.
Results:
College
Major
Choice
69
VIII.
Conclusion
73
References
(Chapter
3) 79
Chapter 4: Keeping up with the Joneses: Institutional Changes
Following the Adoption of a Merit Aid Policy
I.
Introduction
82
II.
Background 84
III.
Data
and
Descriptive
Statistics
87
IV. Empirical Methods and Results
A. Factors Affecting the Decision to Offer Merit Aid
99
B. The Effects of Merit Aid on Institutional Characteristics
101
V.
Conclusion
114
References
(Chapter
4) 117
Chapter 5: Summary and Future Work
119
LIST OF TABLES
Table 2.1: Descriptive Statistics by Type of College Application
15
Table 2.2: College Application Decisions,
Marginal
Effects
21
Table 2.3: Alternative Selective 4-yr College Proximity Measures
25
Table 3.1: Descriptive Statistics for Student Variables (NLSF)
45
Table 3.2: Descriptive Statistics
for
NELS:88 46
Table 3.3: Descriptive Statistics for Institutions
49
Table 3.4: Determinants of First-Year
GPA
(NLSF)
51
Table 3.5: Determinants of Cumulative
GPA
(NLSF) 52
Table 3.6: Results for Estimations of GPA and Persistence using NELS:88
56
Table 3.7: Multinomial Logit Estimates of Persistence (NLSF)
61
Table 3.8: Multinomial Logit Estimates of Persistence by Race (NLSF)
62
Table
3.9:
Instrumental
Variables
Estimations 68
Table 3.10: Average Marginal Effects for College Major Choice
69
Table 3.11: Average Marginal Effects for College Major Choice by Race
71
Table
3.12:
Summary
of
Results
74
Table 4.1a: Descriptive Statistics
for
Outcome
Variables
91
Table 4.1b: Descriptive Statistics
for
Outcome
Variables
93
Table 4.2: Probability of Offering Merit Aid
100
Table 4.3: Effects of Merit Aid on Student Body Demographics
104
Table 4.4: Effects of Merit Aid on Admissions & Student Body Characteristics
107
Table 4.5: Effects of Merit Aid on Student Costs & Enrollment
110
Table 4.6: Effects of Merit Aid on Faculty Employment & Salaries
112
Table A3.1: Multinomial Logit Coefficients for Major Choice
122
Table A3.2: Multinomial Logit Coefficients for Major Choice by Race
123
LIST OF FIGURES
Figure 4.1 Percent of Private 4-yr colleges and universities offering merit aid
89
Figure 4.2 Average Percent Pell Grant Recipients
97
CHAPTER 1
INTRODUCTION
One of the issues currently at the forefront of higher education policy
discussions centers on how to address the under-representation of low-income and
minority students in our nation’s colleges and universities, particularly at the more
selective of these institutions. Studies have shown that there is an ample supply of
high test score low-income and minority students available, but average four-year
college enrollments of these students do not reflect this. This is a concern not only as
a question of equal access to higher education for deserving students of all
backgrounds, but because research has shown that there is a wage benefit associated
with graduating from a more selective institution and that this benefit is larger for
low-income and minority students.
A number of selective colleges and universities, both public and private, have
introduced programs targeting low-income students through the use of increased
financial aid. Many of these programs also include increased recruitment efforts. For
these policies to be fully successful, policymakers must have a good understanding of
the factors that are important in the application and enrollment decision for
low-income and minority students.
The second chapter of this dissertation focuses on the decision to apply to a
selective college or university, and examines how particular factors may differ in their
importance and impact on application decisions of low-income students. This chapter
uses a nationally representative data set, the
National Longitudinal Survey of Youth,
1997
, to examine how proximity to a selective college during high school can impact
on college application decisions. Low-income students live significantly farther away
from selective colleges and universities, as most of these institutions are concentrated
in the Northeast while low-income students are not. Living near to a selective college
may increase application rates to this type of institution for two reasons. Close
proximity lowers the convenience and cost of attendance as students can commute
more easily, and it might also provide more information to students on the
opportunities available at selective colleges and universities. This chapter examines
how the distance to the closest selective college or university impacts a student’s
decision to apply to a selective institution. The results from this chapter will help
programs aimed at increasing the representation of low-income students in selective
college applicant pools by highlighting how admissions offices can target these
students.
Although many of the current policies are focusing on the first step of the
process, enrolling low-income and minority students in college, it may also be
important to examine what happens to these students after matriculation. Low-income
and minority students may face some hurdles at selective institutions. Students of
both groups have lower test scores on average, placing those attending selective
colleges in the lower tail of the test-score distribution. Additionally, due to the
low-representation of low-income and minority students at these colleges, these students
have fairly small peer groups as defined by income or race, which could impact on
educational outcomes through the formation of their social networks. How well a
student matches academically and socially with the institution they attend may impact
on their educational success. Chapter three examines how institutional fit impacts on
college success using two longitudinal data sets, the
National Longitudinal Survey of
Freshmen
and the
National Education Longitudinal Study of 1988
. Administrators
and policymakers can hopefully use the results of this study to get a sense of how well
students of these two groups are succeeding at selective colleges and universities, and
if there are problems that could be addressed by policy.
In addition to the policies specifically focusing on low-income and minority
students, there are many recent changes in institutional policies that could have
important consequences for the enrollment of these students. Over the last decade
many private four-year colleges and universities have started awarding merit-based
financial aid, as opposed to awarding financial aid based solely on need. This move
has come under fire as many feel that diverting financial aid resources away from
need-based aid to merit-based awards that are more likely to go to higher-income
students will lead to a crowding-out of low-income students at these colleges. In a
time when there is a focus on
increasing
the representation of these students, it is
important to understand how policies such as a merit-aid policy can impact on this
goal.
Chapter four examines how the enrollments of low-income and minority
students change following the introduction of a merit aid program at private four-year
institutions using data from the College Board’s
Annual Survey of Colleges
. One of
the main motivations for switching to merit-based aid is the desire to attract and enroll
more high-test score students. This chapter investigates how successful merit aid
programs have been at increasing the quality of the student body. In addition to
diverting financial aid resources from need-based aid, it is possible that colleges use
other avenues to fund their new merit aid programs. Colleges may raise the tuition
and fees that students face in order to recoup their losses, or they may change their
spending in other areas, such as on faculty salaries and employment. As many private
colleges, and recently the more selective of these institutions, move to financial aid
based not solely on need, but also on merit, it is important to understand what
institutional policies follow this policy change.
The three main chapters of this dissertation examine three aspects of one
current policy issue, the under-representation of low-income and minority students at
selective colleges and universities. Hopefully the results of these three studies will be
helpful to policymakers, administrators and researchers interested in understanding
how to increase the representation of these students at our nation’s selective colleges,
how other policies may impact upon this goal, and also how to ensure that they
succeed academically after matriculation.
CHAPTER 2
CAN’T GET THERE FROM HERE: THE DECISION TO APPLY TO A
SELECTIVE COLLEGE
1I. Introduction
This paper examines the factors that are important during the college
application process, with a specific focus on the roles of family income and proximity
of selective schools on the decision of whether to apply to a selective college. It
employs a very rich national longitudinal data set with sample members applying to
college in the early 2000s.
Attending a selective four-year college can impact relative lifetime earnings
(see, for example, Brewer, Eide, & Ehrenberg, 1999; Long, 2008), and the earnings
premium may be larger for students from low-income backgrounds (Behrman,
Constantine, Kletzer, McPherson, & Schapiro, 1996; Dale & Krueger, 2002). Yet
low-income students are under-represented at elite colleges and universities (Heller,
2004; Hill, Winston & Boyd, 2005). Bowen, Martin, Kurzweil and Tobin (2005), in
their book
Equity and Excellence in American Higher Education
, show that only 11
percent of students from families in the bottom quartile of the income distribution are
enrolled at the 19 elite colleges and universities in their sample. They argue that
increasing the representation of students from low-income families has significant
benefits, both in terms of increased social mobility for the low-income students
1
This paper was co-written with Donna S. Rothstein of the U.S. Bureau of Labor Statistics. It will be published in the Economics of Education Review (link to article:
themselves, and in terms of increased socioeconomic diversity within colleges, which
has benefits for all students enrolled.
Recently, a number of selective institutions have implemented programs aimed
at increasing the representation of students from low-income families. These
programs, developed by both public and private elite institutions such as Harvard,
Yale, Princeton, the University of Virginia, and the University of North Carolina,
among others, are varied in their approaches. However, most have at their core a
promise to cover most or all of the school’s tuition for students with low family
income. Many programs also include attempts to increase awareness of the institution
and the opportunities available there for low-income students. The hope is that the
various measures will lead to a larger applicant pool of low-income students at
selective institutions, resulting in their higher representation in the matriculating
classes. Preliminary results from Harvard suggest that although effects of the program
are modest thus far, it appears to be succeeding (Avery, Hoxby, Jackson, Burek,
Poppe & Raman, 2006).
To ensure that these programs can successfully target low-income student
populations, one needs to examine why so few low-income students apply to more
selective four-year institutions. For according to a 2005 study by Hill, Winston and
Boyd (2005) there is a sizeable pool of high ability, low-income students in the U.S.
(as measured by test scores and reported family income). Although the cost of
attending a selective college or university can be quite high, tuition costs may not be
the only hurdle that low-income students face. Proximity to post-secondary
institutions could be important in students’ college application decisions, and may be a
more significant factor for low-income students. About 46 percent of the more elite
institutions in the U.S. are located in Northeastern states, yet many of the low-income
students that could attend these colleges are located in geographically distant states.
2For example, in the data set we use in this paper, only 12 percent of students with a
grade point average of 3.5 or more who are in families in the bottom quartile of
income live in the Northeast.
College proximity can have two distinct effects on college application
decisions. First, distance can impose costs and make students less likely to apply to
colleges far away from their homes. For example, students may want to attend college
(and therefore will apply to colleges) close to home for convenience, lower travel
costs, and for the option of living at home to avoid paying for room and board. One
might expect that financial reasons for attending a college closer to home may be more
pressing for students from low-income families.
Second, living close to a selective four-year college can expose students to
what these colleges have to offer and encourage students to try to attend a selective
four-year college. Do (2004) refers to this as a spillover effect, which may be
particularly influential for lower-income students. For example, living close to a
college may raise awareness of opportunities available at post-secondary institutions
and help create a college-going expectation for nearby youths. Living near a selective
institution could have an additional spillover effect, increasing the probability that
students would strive to attend a selective college or university. Both effects suggest
that as distance to a selective college increases, the less likely a student is to apply to
one.
In this paper, we use the National Longitudinal Survey of Youth 1997
(NLSY97) to assess the roles of college proximity and family income in the decision
to apply to a selective four-year college. We analyze the college application decision
2
We define elite or selective four year colleges as those ranked by Barron’s Profile of American Colleges (2001) as most or highly competitive.
using a bivariate probit model with selection. The application process is shown in two
stages: (1) the choice to apply to a four-year college (selection), and (2) the choice to
apply to any selective four-year college versus only non-selective four-year colleges.
The selection model yields some interesting findings. First youths from families with
low income are much less likely to apply to four-year colleges than those from
families with high income, even after controlling for test scores, high school grade
point average, and many other family, school, and location characteristics. Second,
family income does not have an effect on the type of four-year colleges to which
students applied. And third, proximity to selective colleges does matter--students are
less likely to apply to a selective four-year college the further they live from one.
II. Prior literature
Several studies have focused on the college application decision, but few have
focused on the decision to apply to a selective college or university.
3Recent studies
have found mixed results on the importance of family income in the decision to apply
to a selective college. Two studies focusing on applications to a specific institution
find contrasting results. Desjardins, Dundar and Hendel (1999) examine the decision
to apply to a large, high-quality public university in the Midwest. Their findings
indicate that students from low- and middle-income families are more likely to apply
to the institution than students from high-income families. Weiler (1994) looks at the
decision to apply to a specific selective private institution in a suburban location. He
finds that as parental income increases, students are significantly more likely to apply
to the focus institution. Toutkoushian (2001) looks specifically at the application
decisions of high school seniors in New Hampshire, and finds that low levels of
3
See Hossler, Braxton and Coppersmith (1989) for a review of many of the earlier articles examining the college application decision.
parental income do not discourage students from applying to the more selective
schools in the sample.
In a very recent paper, Koffman and Tienda (2008) examine how a 1996 law in
Texas (HB588), which guarantees admission to public colleges and universities in
Texas to high school seniors graduating in the top 10 percent of their class, affected
the distribution of socioeconomic status of the applicant pool to two Texas flagship
public universities. They find that the admission policy did little to change the
application rate of students from poor high schools. These results suggest that even
with guaranteed admission there are still hurdles to overcome in order to increase the
application rates of low-income students. To remedy the situation, the authors
advocate increased, targeted recruitment of top students from poor high schools. But
to do this, one must understand what factors are important to low-income students in
their application decisions.
Very little research has looked at how student proximity to a college or
university impacts his or her college application decisions.
4Turley (2009) is an
exception. She uses NELS:88 data to examine how college proximity influences the
probability of applying to a two- or four-year college. Turley measures college
proximity as the number of colleges within commuting distance of a student’s home
(12 miles for urban youths and 24 miles for rural/suburban youths). She finds a very
small increase in the probability of applying to a four-year college associated with a 1
unit increase in the number of four-year colleges in close proximity. These results
suggest that college proximity influences the college application decision, but she does
not look at college selectivity, which is the focus of the current paper.
4
However, note that Card (1995) uses proximity to a four-year college as an instrument for years of schooling. He finds that students living closer to four-year institutions, on average, attained higher total years of schooling.
Two recent studies find that college proximity affects the college enrollment
decision, and may have a larger effect for students from families with low income. Do
(2004), using data from High School and Beyond, examines college matriculation
decisions for low- versus high-income students. Results suggest that low-income
students are more likely to attend a high quality college if they live near a good public
university, with mixed results for the impact of living near other types of elite
institutions. Using a sample of Canadian high school seniors, Frenette (2006) finds
that students who live further away from top universities are less likely to attend one
and that the effect is significantly stronger for students from low-income backgrounds.
III. Empirical approach
In order to investigate factors affecting college application choices, this study
estimates a bivariate probit selection model (see, for example, Maddala, 1983). The
first (selection) stage is the decision of whether to apply to a four-year college vs. a
two-year or no college. The second stage, which is the main focus of our paper, is
then whether to apply to any year selective college vs. only non-selective
four-year colleges. The second stage is censored, in that the outcome is only observed for
those who choose to apply to a four-year college.
Students have different portfolios of four-year college applications, and we
reduce them to a 1 (at least one selective four-year college), 0 (only non-selective
four-year colleges) dependent variable in the second stage. Ideally, we would like to
have a dependent variable that reflects the richness of the application choices.
However, as we will see in the next section, only 237 students apply to any selective
college in our data set, with 61 percent of these applying to only one selective college
and another 22 percent applying to only two selective colleges.
We use two variables to identify the first stage of the bivariate probit selection
model: distance to a two-year college and the State unemployment rate.
5The theory
behind the use of these variables to identify the selection process is as follows: As the
unemployment rate rises, parents and their children may steer away from expensive
four-year colleges in favor of two-year colleges. Two-year college proximity is likely
to affect the two-year versus four-year college decision, but unlikely to have an effect
on a student’s decision to apply to a selective versus a non-selective four-year
institution. In practice, we find that these two variables are statistically insignificant in
the second stage.
Explanatory variables that may influence the college application decision are
broken into five descriptive categories:
(i.) personal--gender, race, ethnicity, and test score;
(ii.) family—income, parent education, family structure, and family size;
(iii.) high school—type of institution, racial composition, and percent of
low-income
students;
(iv.) location—median income, urbanicity, region;
(v.) distance—distance to college type.
The rich data set used in this paper allows one to control for such an exhaustive list of
characteristics. The hope is that the effects of these variables can shed light on the
college application decision, particularly the roles that college proximity and family
income play in the process.
5
State unemployment rate is from Table 572 of the 2001 edition of the Statistical Abstract of the United States.
IV. Data and variables
This paper employs the National Longitudinal Survey of Youth 1997
(NLSY97) to study the college application decisions of youths in the U.S. The
NLSY97 consists of nearly 9,000 youths who were born in the years 1980-84. The
youths were 12-17 when first interviewed in 1997, and have had annual in-person
interviews ever since. In 2003 (round 7), the NLSY97 added a section on college
choice for youths born in the years 1983 and 1984. Youths who attended at least
twelfth grade or received a GED report the colleges applied to in each application
cycle, among other information.
6The survey repeated the section for the same two
birth years in 2004. The NLSY97 geocode CD and confidential data available to
researchers who come to the U.S. Bureau of Labor Statistics provide college UnitIDs,
high school id codes, as well as residential zip code, county, and state for each survey
year. The paper merges in high school characteristics from the Q.E.D. (Quality
Education Data) and uses county of high school residence to link to information from
the 2000 edition of the
County and City Data Book
.
The study obtains parent reports of household income from the round 1
NLSY97 parent questionnaire.
7Family structure, household size, and biological
mother’s education are also from round 1. The NLSY97 defines race and ethnicity as
three mutually exclusive groups: black and Hispanic, black and
non-Hispanic, and Hispanic. The survey oversamples the latter two groups. ASVAB
(Armed Services Vocational Aptitude Battery) test scores are available for about 80
percent of the NLSY97 sample. From the summer of 1997 through the spring of 1998,
NLSY97 youths took the computer-adaptive version of the ASVAB. Four of the
6
The sample is limited to those with a high school diploma or GED in the analysis that follows. 7
Household income is missing for 25 percent of the youths in the NLSY97 sample, with about half due to a missing parent interview. Descriptive statistics are shown for non-missing observations. In the analyses that follow, variables with missing observations are given a value of zero, and a dummy variable for the missing variable is included in the regression.
subtests combine to form a composite measure of math and verbal aptitude. This
aptitude measure is similar to the Department of Defense’s Armed Forces
Qualification Test (AFQT) score available in the NLSY79. NLSY97 survey personnel
internally normed these tests and created the composite math and verbal aptitude
percentile score (0 (lowest) to 99) provided in the NLSY97 data set.
The paper uses college UnitIDs to merge in information on selectivity and
other characteristics of colleges from the 2000 IPEDS and the College Board’s Annual
Survey of Colleges.
8The rankings in
Barron’s Profile of American Colleges
(2001)
are used to define selective colleges (those with a most or highly competitive ranking).
In 2000, 146 U.S. colleges are considered to be selective by the Barron’s rankings.
The average median SAT score is 1272 for the sample of selective institutions.
Finally, the study uses zip codes from a student’s senior year of high school
and the complete list of selective four-year, non-selective four-year, and two-year
colleges to create measures of college proximity.
9U.S. Gazetteer files from the U.S.
Census Bureau provide the latitude and longitude of the centroid of each zip code in
decimal degrees. One can then convert decimal degrees to radians, and then calculate
the distance in miles between the zip code of student i and the zip code of school j.
10Once this is completed for all student and school zip code combinations, we use the
minimum distance to each school type to define college proximity.
8
We exclude for-profit colleges in our analysis. At the time of the survey, for-profit schools were a very small part of the college application set. We delete 27 observations in which the respondent only applied to for-profit year colleges. Note that only 9 students who apply to public and private four-year colleges in our final sample also apply to a for-profit college.
9
We exclude for-profit colleges from these measures. 10
The formula is 4000*arcos{sin(schoolj latitude)*sin(studenti latitude) + cos(schoolj latitutude)*cos(studenti latitude)*(cos(schoolj longitude – studenti longitude)}.
V. Descriptive statistics
Table 2.1 displays descriptive statistics for the NLSY97 sample, separated by
type of school application and selectivity. The categories are: Did not apply,
two-year college, any two-year college, non-selective two-year college, and selective
four-year college. The first three categories are mutually exclusive, and the last two are
mutually exclusive subsets of the third column. Students who apply to multiple types
of school are placed in the highest category (for example, applications to both a non-
selective four-year college and a selective four-year college place the student in the
selective category). On average, students who apply to at least one selective college,
apply to 3.5 four-year colleges; the number is lower, 1.7, for those who apply to
selective four-year colleges. About 95 percent of students who apply to only
non-selective four-year colleges are accepted. The number is much lower for the non-selective
category (73 percent), reflecting the increased difficulty of acceptance at more
selective four-year colleges.
Table 2.1 indicates an under-representation of students from low-income
families in the selective college applicant pool. We divide household income into
approximate quartiles based on Current Population Survey data of households with a
12 to 17-year old youth present.
11Only about 14 percent of students in families with
income under $25,000 apply to a selective four-year college, compared to over 46
percent from families with income of at least $70,000. Note that low-income students
make up the largest share of those who apply to no college or apply to a two-year
college only.
A number of authors (for example, Bowen, et al., 2005) have noted the
under-representation of low-income, high ability students in the pool of students who apply
11
See U.S. Census Bureau (1997). Note that the NLSY97 round 1 parent interview asked parents to report income from calendar year 1996.
Did not apply Two-year college Any four-year college Non-selective four-year college Selective four-year college Number of four-year college applications .000 .000 2.101 (1.541) 1.738 (1.182) 3.511 (1.919) Selective college
Apply to any selective .000 .000 .205 .000 1.000 Accepted if applied ---- ---- .733 ---- .733
Non-selective college
Apply to any .000 .000 .942 1.000 .717 Accepted if applied ---- ---- .961 .954 1.000
Distance variables Distance to selective four-year college 105.033 (186.407) 86.934 (125.703) 88.833 (148.251) 97.747 (158.855) 54.192 (88.663) Distance to non-selective four-year college 10.600 (13.178) 10.861 (13.359) 9.658 (16.361) 10.190 (17.425) 7.591 (11.106) Distance to two-year college 12.463 (19.603) 9.633 (12.732) 11.544 (15.291) 12.381 (16.386) 8.290 (9.286) Personal characteristics Female .454 .502 .548 .556 .519 Black .256 .244 .233 .255 .148 Hispanic .249 .249 .124 .129 .105 Math/verbal percentile score 36.517 (25.234) 41.480 (24.185) 64.960 (25.358) 61.229 (24.995) 78.643 (21.768)
High school grade point
avg. 2.648 (.733) 2.792 (.664) 3.295 (.601) 3.218 (.606) 3.594 (.477) Family characteristics Income < $25,000 .405 .327 .178 .189 .140 Income ≥ $25,000 and < $45,000 .252 .293 .233 .251 .167 Income ≥ $45,000 and < $70,000 .208 .233 .261 .269 .231 Income ≥ $70,000 .135 .147 .327 .291 .462
Biological mother's years of education 11.844 (2.539) 12.285 (2.875) 13.922 (2.797) 13.743 (2.739) 14.615 (2.915)
Table 2.1 Continued.
Family size 4.694 (1.589) 4.584 (1.485) 4.437 (1.337) 4.457 (1.370) 4.359 (1.198)Both biological parents .469 .518 .651 .623 .759
Biological parent + step. .166 .141 .100 .109 .068
Biological mother only .288 .275 .202 .218 .139
Biological father only .032 .029 .022 .024 .017
High school characteristics
Private .017 .012 .028 .018 .065 Catholic .009 .030 .074 .062 .120 Log(school size) 6.945 (.836) 7.012 (.774) 7.004 (.674) 7.000 (.670) 7.022 (.688) Student/teacher ratio 17.026 (5.861) 17.520 (5.963) 16.583 (5.152) 16.518 (4.892) 16.846 (6.088) % Black 20.856 (27.090) 19.627 (26.532) 21.342 (29.164) 22.079 (30.167) 18.011 (23.910) % Hispanic 17.335 (25.016) 16.472 (23.763) 10.573 (19.453) 10.284 (19.231) 11.875 (20.432) % Chapter I 25.632 (19.050) 25.308 (19.608) 21.827 (19.611) 22.824 (19.959) 17.324 (17.301) Location characteristics Urban .758 .773 .767 .746 .850
Log median income in county 10.486 (.227) 10.493 (.222) 10.531 (.258) 10.512 (.259) 10.605 (.236) Midwest .218 .216 .254 .266 .207 West .261 .304 .177 .172 .198 South .359 .348 .370 .371 .367
State unemployment rate 4.065 (.843) 4.111 (.772) 3.890 (.832) 3.896 (.842) 3.866 (.790) N 965 546 1158 921 237
Note: Means, standard deviations in parentheses. Monetary values are in constant 1996 dollars. Distance is in miles. Means exclude any missing observations. Selective four-year college is defined as having a Barron’s Profile of American Colleges (2001) rating of most or highly competitive.
to selective schools. We find this in the NLSY97 as well. Suppose we limit our
sample to those who scored in the 75th percentile or better on the math/verbal portion
of the ASVAB. Of these high-scoring youths who are from families in the bottom two
quartiles of income, 65 percent apply to a four-year college, and of those, 25 percent
apply to a selective four-year college. In contrast, of high-scoring youths who are in
the top quartile of family income, 85 percent apply to a four-year college, and of
those, 40 percent apply to a selective four-year college. Thus we see income
differentials in the first stage decision—whether to apply to a four-year college at
all—as well as in the second stage decision--whether to apply to a selective four-year
college.
Table 2.1 shows that, on average, youths who apply to a selective college have
a significantly shorter distance to a four-year selective college than youths who apply
to non-selective four-year colleges: 54 miles vs. 98 miles. On average, students live
significantly further from selective colleges than non-selective four- and two-year
colleges. This differential reflects the small number of selective colleges and
universities in the U.S. and their geographic distribution. For example, of the 146
colleges rated as selective, 46 percent are in the Northeast and about 57 percent are in
the Northeast and California. To put this in perspective with respect to the NLSY97
sample, youths in the Northeast live less than 19 miles from a selective college, on
average, but those who live in the South or Midwest average about 95 miles, and those
in the West average about 149 miles.
The difference in average distance to a selective college also varies by income
level. For example, in the NLSY97 sample, students from families in the lowest
quartile of income live an average of 95 miles from a selective college, but students
from families in the highest quartile of income live an average of 87 miles from a
selective college. If instead, we look at a measure of whether a student has a selective
college within 50 miles of his or her high school residence, we find that 51 percent of
students from low-income households have a selective college in close proximity
compared to 63 percent of students from high-income households.
VI. Results
Marginal effects from independent probits and a bivariate probit with selection
for the probability of applying to any four year college and the probability of applying
to a selective vs. non-selective four-year college are shown in Table 2.2. The results
from the two sets of equations are similar. A Wald test cannot reject the null
hypothesis that the equations are independent (p = .17). Both variables used as
exclusion restrictions are significant in the first stage. Given the richness of the
NLSY97 data, we are able to account for much of the heterogeneity between youths
through covariates.
Family income has a large effect in the first stage, but no effect in the second
stage. This suggests that, all else equal (including test scores and high school grade
point average), students with lower family incomes are less likely to be in the pool of
applicants who apply to any type of four-year college. However, given they get past
this hurdle, low-income students are not any less likely to apply to a selective college.
Relative to the highest income group, youths in families in the lowest income quartile
are about 16 percentage points less likely to apply to any four-year college, those in
the next lowest income quartile are about 9 percentage points less likely to apply, and
those in the second to highest income quartile are about 7 percentage points less like to
apply. Policies that aim to increase the applicant pool of low-income students at elite
four-year colleges may have to take into account that a number of these students are
not applying to any four-year college.
A number of background characteristics are significantly associated with the
likelihood of applying to a selective college. For example, students with higher
aptitude, as measured by test scores, are significantly more likely to apply to a
selective four-year college, relative to a non-selective four-year college. High school
grade point average has the same type of effect. High school environment can play a
major role in influencing students’ college choice, by preparing students academically
and also possibly by providing information about the availability of opportunities at
more selective institutions. Students who attend private high schools are significantly
more likely to apply to a selective college by about 16 percentage points. Students
from low-income families are much more likely to attend public high schools than
their higher-income peers.
Longer distances to a selective college decrease the probability of applying to
one. The marginal effects from the bivariate probit suggest that a 75 mile increase in
distance to a selective college (about half a standard deviation for the four-year
application group) decreases the likelihood of applying to one by about 2 percentage
points. When we interacted distance with family income quartiles, we found that the
distance effect does not vary with family income. To get a feel for the magnitude of
the distance effect, note that a .3 point increase in high school grade point average
(about half a standard deviation for the four-year application group) increases the
likelihood of applying to a four-year selective college by about 2.3 percentage points.
Distance to the nearest non-selective college does not have a significant effect in either
stage. In addition, the distance to a two-year college has a positive effect in the
first-stage. As the distance to the nearest two-year college increases, the likelihood of
applying to a four-year college increases.
Table 2.2: Four-year college vs. two-year or no college application and selective
four-year college vs. non-selective four-year college application decisions,
Probability of applying to a: Four-year college Selective college Four-year college Selective college (probit) (probit) (bivariate probit) Distance variables
Distance to selective four-year college -.010 a (.010) -.047*** a (.012) -.001 b (.001) -.026*** a (.008)
Distance to non-selective four-year college -.001 (.001) .001 (.001) -.001 (.001) .001 (.001)
Distance to two-year college .002** (.001) ---- .002** (.001) ---- Personal characteristics Female .046** (.022) -.033 (.023) .044** (.022) -.020 (.014) Black .163*** (.039) -.026 (.038) .164*** (.039) -.021 (.022) Hispanic .030 (.039) -.047 (.033) .027 (.039) -.030* (.018)
Math/verbal percentile score .067*** b (.001) .031*** b (.006) .068***b (.005) .016*** b (.004)
High school grade point average .246*** (.017) .150*** (.023) .248*** (.017) .078*** (.012) Family characteristics Income < $25,000 -.156*** (.038) .049 (.050) -.156*** (.038) .038 (.034) Income ≥ $25,000 and < $45,000 -.093*** (.036) -.006 (.034) -.092*** (.036) .002 (.021) Income ≥ $45,000 and < $70,000 -.069** (.035) -.041 (.028) -.067* (.035) -.021 (.016)
Biological mother's years of education .033*** (.005) .003 (.005) .034*** (.005) .001 (.003)
Both biological parents .140*** (.032) .042 (.037) .141*** (.032) .021 (.023)
Biological mother only .077* (.042) .014 (.053) .081** (.041) .005 (.031) Biological father only .048
(.072) -.062 (.063) .055 (.072) -.035 (.031)
Table 2.2 Continued.
High School characteristicsPrivate .150* (.088) .256** (.109) .159* (.087) .163* (.089) Catholic .311*** (.062) .093* (.056) .311*** (.062) .043 (.034) Log(school size) .046** (.019) -.022 (.023) .049** (.019) -.018 (.014) Student/teacher ratio .001 (.002) .002 (.002) .001 (.003) .001 (.002) % Black .001 (.001) .002** (.001) .001 (.001) .010** b (.005) % Hispanic -.001 (.001) .003*** (.001) -.001 (.001) .016*** b (.006) % Chapter I .003*** (.001) -.002** (.001) .003*** (.001) -.0015** b (.007) Location characteristics Urban .003 (.030) .064*** (.024) .006 (.030) .036** (.014)
Log median income in county .062 (.058) .096* (.055) .051 (.058) .063* (.033) Midwest -.061* (.036) -.055* (.029) -.066* (.036) -.028 (.017) West -.146*** (.040) .008 (.041) -.144*** (.040) .005 (.025) South -.064* (.034) .014 (.033) -.064* (.034) .013 (.021)
State unemployment rate -.040** (.016) ---- -.036** (.015) ---- Rho (ρ) --- .998 (.009) Log likelihood -1305.921 -474.027 -1777.749 N 2669 1158 2669
Robust standard errors in parentheses. Conditional marginal effects are shown in the right-most column. *, **, *** indicate significance at 10%, 5%, and 1% levels, respectively.
a
Marginal effect and standard error multiplied by 100. b Marginal effect and standard error multiplied by 10.
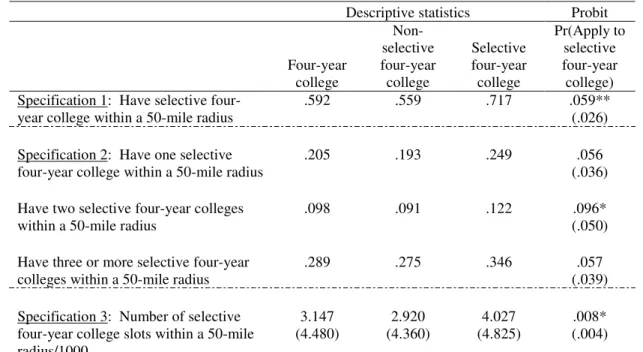
To check the robustness of our key result regarding proximity to a selective
college we create a number of alternative measures. The first set is for a 50-mile
radius of the student’s high school zip code: (1) the presence of a selective college
within a 50-mile radius of the student’s high school zip code, (2) a series of mutually
exclusive dummy variables that describe whether the respondent has 1, 2, or 3 or more
selective four-year colleges within a 50-mile radius, and (3) the number of freshman
slots at selective schools within the 50-mile radius divided by 1000. The second set
includes two mutually exclusive dummy variables for the presence of a selective
college within a 50-mile radius and presence of a selective college between a 51- and
100-mile radius, as well as (1) and (3) above defined for a 100-mile radius rather than
50. In addition to verifying that our results are robust, these alternative measures
allow us to examine whether the effect of college proximity is non-linear. On the one
hand, students may only require one selective college within a certain radius to
increase the likelihood that they will apply to one. On the other hand, an increase in
the number of selective colleges in close proximity, and freshmen slots at these
colleges, may further raise the probability of applying to one.
Table 2.3 shows college proximity marginal effects for selective colleges from
six different probits of the probability of applying to any selective four-year college
vs. only non-selective four-year colleges.
12The probits control for all of the
background variables included in the second stage estimates in Table 2.2. The results
in Table 2.3 are very similar to those in Table 2.2: close proximity to a selective
college raises the likelihood of applying to one. For example, having a selective
college within a 50-mile radius increases the likelihood of applying to one by about 6
percentage points. Although it looks as though moving from having one to two
12
Given our prior finding that we could not reject the null hypothesis that the first and second stage equations are independent, we estimate probits only. However, the results are very similar when we estimate bivariate probits.
Table 2.3: Alternative selective four-year college proximity measures: Selective
four-year college vs. non-selective four-year college application decision,
marginal effects from probits
Descriptive statistics Probit
Four-year college Non-selective four-year college Selective four-year college Pr(Apply to selective four-year college) Specification 1: Have selective
four-year college within a 50-mile radius
.592 .559 .717 .059** (.026)
Specification 2: Have one selective four-year college within a 50-mile radius
.205 .193 .249 .056
(.036)
Have two selective four-year colleges within a 50-mile radius
.098 .091 .122 .096*
(.050)
Have three or more selective four-year colleges within a 50-mile radius
.289 .275 .346 .057
(.039)
Specification 3: Number of selective four-year college slots within a 50-mile radius/1000 3.147 (4.480) 2.920 (4.360) 4.027 (4.825) .008* (.004)
Specification 4: Have selective
four-year college within a 50-mile radius .592 .559 .717 .090*** (.030)
Have selective four-year college within a 100 mile radius, but not a 50-mile radius
.139 .142 .127 .085*
(.047)
Specification 5: Have selective four-year college within a 100-mile radius
.731 .701 .844 .080*** (.025)
Specification 6: Number of selective four-year college slots within a 100-mile radius/1000 6.852 (7.943) 6.435 (7.846) 8.474 (8.126) .009*** (.003) N 1158 921 237 1158
Note: Means, standard deviations in parentheses in first three columns. Marginal effects with robust standard errors in parentheses in last column. Specifications include controls for personal, family, high school, and location characteristics. *, **, *** indicate significance at 10%, 5%, and 1% levels, respectively.


![Table 3.7: Multinomial Logit Estimates of Probability of Transferring or Dropping Out (NLSF) Dropout Transfer Black 0.98 0.292 (0.173)*** (0.126)** [5.91] [1.96] Hispanic 0.275 0.244 (0.26) (0.116)** [1.35] [2.17] Asian 0.295 -0.209 (0](https://thumb-us.123doks.com/thumbv2/123dok_us/10780929.2966244/72.918.153.793.204.970/multinomial-estimates-probability-transferring-dropping-dropout-transfer-hispanic.webp)
