F
uel modifications are receiving renewed interest as protection strategies, particularly in wild-land-urban areas (Agee et al. 2000). This is a result of costly fire seasons like 2000 and 2002, new national direc-tives with increased funding (USDAForest Service and USDI 2000), a recognition of a change in fuel compo-sition, structure, and loading, and fire manager’s desire, yet limited ability, to control large fires. A common miscon-ception among managers and the pub-lic is that fuel treatments stop fires. The
primary purpose of a fuel treatment is to change the behavior of a fire enter-ing a fuel-altered zone, thus lessenenter-ing the impact of that fire to an area of concern. This change in fire behavior is often quantified as a reduction in flame length, intensity, or rate-of-spread, and manifested as a change in severity or growth of the fire. This is best achieved by fragmenting the fuel complex and repeatedly disrupting or locally block-ing fire growth, thus increasblock-ing the likelihood that suppression will be ef-fective or weather conditions will change (Finney 2000).
Recent research suggests that land-scape-scale fuel modifications, such as prescribed fire, are the most effective way to modify the behavior and growth of large fires (Finney 2001). However, the effectiveness of fuel treatments remain a subject of debate due in part to the weather conditions they will or will not perform under, treatment method, com-Richard D. Stratton
This article presents a methodology for assessing the effectiveness of landscape fuel treat-ments on fire growth and behavior in southern Utah. Treatment areas were selected by fire managers from the Bureau of Land Management (BLM) based on the threat of fire to commu-nities and the need for range and wildlife improvement. A fire density grid was derived from the BLM’s fire start layer to identify historically high ignition areas. FireFamily Plus was used to summarize and analyze historical weather and calculate seasonal severity and percentile re-ports. Information from FireFamily was used in FARSITE and FlamMap to model pre- and post-treatment effects on fire growth, spotting, fireline intensity, surface flame length, and the oc-currence of crown fire. This procedure provides managers with a quantitative measure of treat-ment effectiveness as well as spatial output that can be used for analyzing fuel treattreat-ment ef-fectiveness, burn plan development, National Environmental Policy Act (NEPA) documenta-tion, public educadocumenta-tion, etc.
Keywords:fuel treatments; fire modeling; fuel models; fire behavior; FARSITE; FlamMap; FireFamily Plus; historical weather; fire ignition history
ABSTRACT
Assessing the
Effectiveness of
Landscape Fuel
Treatments on Fire Growth
and Behavior
pleteness of the application, treatment design (i.e., placement, pattern, size), and the difficulty in evaluating the effec-tiveness of the proposed treatment. Sim-ulation modeling allows the user to par-tially address these issues under various weather and fuel scenarios and provides a “tested” outcome for field application.
This article presents a methodology for assessing the effectiveness of land-scape fuel treatments on fire growth and behavior by utilizing previous fire locations, historical weather, and fire growth and behavior models.
Analysis Area
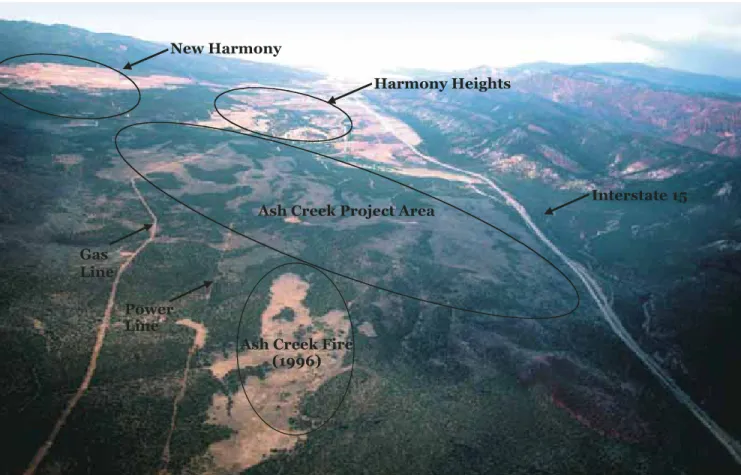
Ash Creek is located approximately 20 miles south of Cedar City, Utah and is adjacent to the communities of New Harmony and Harmony Heights (Fig-ure 1). The project area (~2,000 ac; 5,300 ft) is on Bureau of Land Man-agement (BLM)-administered land and bounded tightly by private owner-ship to the north, Interstate 15 (I-15) to the East, the Dixie National Forest and Pine Valley Mountain Wilderness
Area to the west, and BLM, state, and private inholdings to the south. The area has seen an increase in urban de-velopment due to its rural setting and views of the Kolob Fingers (Zion Na-tional Park), inviting climate, and close proximity to various recreational sites and metropolitan areas.
Located on a relatively flat, east, southeast bench, understory vegetation is primarily crested wheatgrass (Agropy-ron cristatum), bluebunch wheatgrass (Elymus spicatus), junegrass (Koeleria
macrantha) (1-2 ft), sage brush
(Artemisia tridentata) (1-3 ft), oak (Quercus turbinella; Quercus gambelii) in some draws (4-15 ft), and smaller amounts of Utah serviceberry (Ame-lanchier alnifolia), bitterbrush (Purshia tridentata), and true mountain ma-hogany (Cercocarpus montanus)(2-15
ft). Utah juniper (Juniperus
os-teosperma) and scattered pinyon pine (Pinus edulis), in varying density, is the dominate overstory species (10-35 ft).
Summer cold fronts contribute to strong winds that are channeled
through the I-15-Black Ridge corridor and into the project area. The effect of these winds on fire shape are evidenced in the Ash Creek Fire of 1996 (~500 ac) (Figure 1). The area has a history of fires attributed to recreational use, I-15 through traffic, and lightning on Black Ridge (6,400 ft) to the east and the Pine Valley Mountains to the west (10,000 ft).
The objectives of the project are to reduce fire intensity, occurrence of crown fire, and mid-/long-range spot-ting and to increase native plant diver-sity and enhance wildlife forage. This was accomplished through herbicide application and fuel reduction. Treat-ment boundaries were delineated by ownership, previously chained areas (1960s), and wildlife needs and is re-flected in an asymmetrical, amoeboid design. Sage-dominated areas were ap-plied with several applications of a her-bicide (Tebuthiuron or “Spike”). En-croaching juniper was manually cut (lop-and-scatter) and is being followed up with pile and broadcast burning.
33 October/November 2004 • Journal of Forestry Harmony Heights
New Harmony
Interstate 15
Ash Creek Fire (1996) Gas
Line
Power Line
Ash Creek Project Area
Methods
Specific information about the ject area, such as objectives of the pro-posed treatment (e.g., wildfire control, wildlife enhancement), type of treat-ment (e.g., prescribed fire, manual thinning), pre- and posttreatment con-dition of the entire fuel complex, and supporting geographic information system (GIS) data were obtained from the BLM. A 32-year fire ignition layer for the BLM and USDA Forest Service was used to derive a fire density grid, using ArcView/Spatial Analyst (version 3.2; ESRI, Redlands, CA).
The locations of the nearest Remote Automated Weather Stations (RAWS) were identified, and reporting history and site characteristics were analyzed to determine the most adequate station for the project area. Due to the chan-neling effect of the winds through the project area, one station was used to ob-tain windspeed and direction (White Reef; 16-year history) and another was used for the weather (Enterprise; 29 years). Historical weather information was downloaded from the National In-teragency Fire Management Integrated Database (NIFMID) (USDA Forest Service 1993) using the Kansas City Fire Access Software (KCFAST) (USDA Forest Service 1996), fire oc-currence information retrieval site, and imported into FireFamily Plus (Brad-shaw and McCormick 2000).
FireFamily Plus.FireFamily Plus is a fire climatology and occurrence pro-gram that combines and replaces the PCFIRDAT (Main et al. 1990, Cohen
et al. 1994), PCSEASON (Main et al. 1990, Cohen et al. 1994), FIRES (An-drews and Bradshaw 1997), and CLI-MATOLOGY (Bradshaw and Fischer 1984) programs into a single package with a graphical user interface. It al-lows the user to summarize and ana-lyze weather observations and com-pute fire danger indices based on the National Fire Danger Rating System (NFDRS) (Bradshaw et al. 1983, Bur-gan 1988).
Fuel moistures (i.e., 1-, 10-, 100-hour, live herbaceous, live woody) were obtained from a FireFamily Per-centile Weather Report. Calculated fuel moistures were compared with local field sampling to validate and ad-just the values. Windspeed, tempera-ture, and relative humidity were ob-tained from a Seasonal Severity Re-port; wind direction was obtained from a Windspeed vs. Direction Re-port. Windspeeds were modified to ac-count for probable maximum 1-minute gusts (Crosby and Chandler 1966), and directions were developed based on actual hourly RAWS data that adequately represented the appro-priate percentile weather.
All weather and fuel moisture para-meters were identified separately at the 75th (moderate), 85th (high), and 95th (very high) percentiles (Table 1). In other words, values higher than the 75th percentile occur 25% of the time during the reporting period (June 1–Sept. 30), 15% of the time for the 85th percentile, and so forth. All cli-matological and fuel variables were
then used to develop the required weather and wind files/inputs for FAR-SITE and FlamMap.
FARSITE. FARSITE (Fire Area Simulator) is a two-dimensional deter-ministic model for spatially and tempo-rally simulating the spread and behav-ior of fires under conditions of hetero-geneous terrain (i.e., elevation, slope, aspect), fuels, and weather (Finney 1998). To do this, FARSITE incorpo-rates existing fire behavior models of surface fire spread (Rothermel 1972, Albini 1976), crown fire spread (Van Wagner 1977, Rothermel 1991, Van Wagner 1993), spotting (Albini 1979), point-source fire acceleration (Forestry Canada Fire Danger Group 1992), and fuel moisture (Nelson 2000) with GIS data. Simulation output is in tabular, vector, and raster formats.
FlamMap. FlamMap (Finney, in preparation) is a spatial fire behavior mapping and analysis program that re-quires a FARSITE landscape file (*.LCP), as well as fuel moisture and weather data. However, unlike FAR-SITE, FlamMap assumes that every pixel on the raster landscape burns and makes fire behavior calculations (e.g., fireline intensity, flame length) for each location (cell), independent of one an-other. That is, there is no predictor of fire movement across the landscape and weather and wind information can be held constant. By so doing, FlamMap output lends itself well to landscape comparisons (e.g., pre- and posttreatment effectiveness) and for identifying hazardous fuel and topo-graphic combinations, thus aiding in prioritization and assessments.
Vegetation and fuel models.Spatial vegetation data for the project area was extracted from a larger 15 million acre study area (Long et al., in preparation). A supervised classification of LAND-SAT Thematic Mapper data—path 33 and rows 37 and 38—was used with ERDAS IMAGINE software (version 8.5; ERDAS, Atlanta, GA), incorporat-ing polygons created by the IPW image processing program (Frew 1990). A maximum likelihood algorithm in ERDAS was used to classify the im-agery based on a statistical representa-tion of spectral signatures for each veg-etation class created from field sam-Table 1. Weather and fuel moisture information for the 75th, 85th, and 95th
percentile as reported by FireFamily Plus and modified as noted.
75th 85th 95th 1-hour (%) 4 4 3 10-hour (%) 6 5 5 100-hour (%) 9 7 6 Live herbacious (%)a 90 80 60 Live woody (%)a 110 100 90 Temp. min. (°F) 56 59 64 Temp. max. (°F) 87 89 92 RH min. (°F) 16 14 10 RH max. (°F) 47 40 28 20-ft Windspeed (mph)b 17 19 23 Wind direction (°)c 190–235 190–235 190–235
a Adjusted from the Seasonal Severity Summary based on local field sampling.
b Adjusted from the Seasonal Severity Summary to account for wind gusts (Crosby and Chandler 1966). c During the burn period (1100–1900 hours).
35 October/November 2004 • Journal of Forestry pling. Ancillary layers, including land
use and land cover, were used in combi-nation with the classified imagery to as-sign polygons to one of 65 final vegeta-tion classes.
The vegetation classes were cross-walked to 44 fuel models (including barren and water), 35 of which were “customized” models (i.e., the stan-dardized model parameters (Anderson 1982), were altered to reflect a condi-tion not adequately represented by the fire behavior models), and two were custom models (i.e., 14: sparse grass-forb; 35: sparse shrub). Canopy cover, stand height, crown-base height, and crown bulk density were developed based on field data, anecdotal observa-tions, and published work. Moderate and severe custom fuel files (*.FMD) were built to reflect the differences in fire behavior between moderate and high/severe conditions.
Terrain, fuel model, and canopy in-formation was used to construct two modeling landscapes: pretreatment and posttreatment. Sage-dominated areas were assigned either a fire behavior model (2, 6) or a customized model (e.g., 2-, 5+, 6- etc.; where the “-” or “+” represents a 20% change in the loading and depth). To simulate the ef-fect of the Tebuthiuron, treated areas were reassigned a fuel model represent-ing a 10–30% reduction in the shrub component. In some areas, an adjust-ment factor (*.ADJ) was used to
change the rate-of-spread without af-fecting other fire behavior outputs.
Pretreatment stands of pinyon-ju-niper were assigned a standardized fuel model (4, 6) or a customized model (4-, 6-, 6- -), each with varying cano-py characteristics. Lop-and-scattered pinyon-juniper that was later pile and/or broadcast burned was reas-signed a fire behavior fuel model (2, 5, 6, 11, 12), a customized model (4-, 5+, 6-, 6- -), or a custom model (i.e., 14, 35); in general, stand height, canopy cover, crown bulk density, and crown base height was eliminated or reduced substantially.
Calibration. To produce fire growth and behavior output consistent with observations, model checking, modifications, and comparisons are done (i.e., calibration) with known fire perimeters and weather conditions (Finney 2000). Two fires were used to calibrate the model output, the San-ford Fire (Apr. –June 2002; 78,000 ac) and the Langston Fire Use (Aug. 2001; 600 ac). The Sanford Fire (Panguitch, UT) was useful in modeling low to ex-treme climatic conditions, with sub-stantial elevational, topographic, and vegetative variation. Most fuel models were represented in the fire area, and canopy characteristics and their influ-ence on crown fire transitions, spot-ting, and spread were analyzed. The Langston Fire Use (Zion National Park, UT) allowed testing of flanking
and backing surface rates-of-spread in moderate weather conditions, on rela-tively flat terrain, and in fuel models 5, 8, 9, and 10.
Modeling fire growth and spotting: FARSITE.To model fire growth and spotting potential, a single-source igni-tion in FARSITE was started in a his-torically high ignition area, as identi-fied by the fire density grid. I-15 was imported as a barrier to surface spread, but was not impermeable to spotting. All fire simulations were modeled with-out suppression. One-day simulations, with a burn period of 1100–1900 hours, were run representing the 75th, 85th, and 95th percentile weather and fuel conditions. The simulation process was repeated multiple times—with the same ignition point, as well as in other high ignition areas—to sample the variation in predicted fire size, shape, common spread pathways, spotting frequency and distance, etc. Based on these multiple runs, the “most resentative” simulation was selected pre-and posttreatment for each percentile level (six in all).
Calculating fireline intensity, flame length, and crown fire activity: FlamMap.To calculate pre- and post-treatment fireline intensity, surface flame length, and crown fire activity, FARSITE terrain, fuel, and weather in-formation was imported into FlamMap. Weather and fuel moisture conditions representing the 75th, 85th, and 95th Figure 2.Eight-hour FARSITE simulation for the 85th percentile weather and fuel condition, pretreatment (A) and posttreatment (B). Each color repre-sents a 1-hour progression of the fire overlaid with roads (black) and the treated landscape (light yellow) (B only). Black Ridge is in the foreground and the Pine Valley Mountains in the background (NW). Fuel modifications reduced the size of the fire by approximately 1,500 ac (18%).
percentile were used to generate the fire behavior data (18 output grids). Results
Figure 2 shows pre- and posttreat-ment FARSITE simulations for the 85th percentile draped over a three-di-mensional landscape. Each color repre-sents a 1-hour time-step or progression of the fire. Table 2 summarizes fire size and spotting for each of the three per-centiles, pre- and posttreatment.
Figure 3 displays FlamMap area maps of the 85th percentile pre- and posttreat-ment for flame length, fireline intensity, and crown fire activity. Tabular data for these fire behavior outputs are displayed in Table 2 as well as histograms for flame length and intensity, summarized by the treated area (Figure 4).
Fire size and perimeter growth.A modest reduction in fire size is appar-ent for each percappar-entile weather and fuel condition. The 85th percentile showed the greatest percent change from the untreated condition (~18%), which is likely due to the removal of most of the pinyon-juniper (i.e., fuel model “4s”/“6s”), thus reducing the
rate-of-spread, spotting distance, and the number of embers lofted. The 75th percentile simulation shows little change due to similarities between sur-face spread rates in sparse pinyon-ju-niper stands and recently burned/resid-ual slash areas. As the weather condi-tions grew more severe (95th per-centile) and the fire size increased, the effectiveness of the treatments on fire growth diminished.
Although reductions in fire size are evident in all three percentiles, a decline in perimeter growth was only predicted in the 85th percentile. In the case of the 75th percentile, while the treatment re-duced surface fuel, the effective wind speed was increased due to the removal of the pinyon-juniper, thus increasing the perimeter expansion of the fire equal to that of the pretreated landscape. In the 85th percentile pretreatment simu-lation, crown fire runs and spotting in shrub fuels resulted in greater growth of the fire than the posttreatment land-scape surface fire spread. For the 95th percentile simulation, the slight increase in perimeter growth is likely due to the convoluting effect of the progressions
through the treated landscape.
Spot fires. A reduction in new ig-nitions ahead of the main fire front is evident under all three weather condi-tions. This is largely due to the re-moval of the pinyon-juniper. It is wor-thy to remember that spotting in FARSITE is stochastic and the num-bers of emnum-bers lofted and burning when they reach the ground are de-pendent on the spotting model (Al-bini 1979) and largely influenced by the ignition frequency and canopy characteristics. Thus, this information is imprecise and more emphasis should be given to the percent change, rather than the actual number of fires.
Intensity and flame length.
Changes in both intensity and flame length for all three percentile classes were realized in the project area and are recorded in Table 2 and plotted in Figure 4. The histograms more ade-quately display the changes in fire be-havior between percentiles and treat-ment conditions than the single mean value for flame length and fireline in-tensity (Table 2).
Crown fire. Although FlamMap differentiates between passive and ac-tive crown fire, Table 2 summarizes both types of crown fire as one. In the 85th percentile condition, all crown fire was termed “passive”; in the 95th, only a slight amount (190 ac) had transitioned to an active crown fire. Crown fire values are identical be-tween the 85th and 95th percentiles because all available crown fuels were burned at the 85th percentile. Under-prediction of active crown fire in FlamMap and FARSITE as compared to observed conditions is common (Fulé et al. 2001, Scott and Reinhardt 2001, Cruz et al. 2003); additional reasons for combining crown fire val-ues include model limitations in pre-dicting the transition between passive and active crown fire, poor parameter-ization of canopy fuels, and little need to differentiate between crown fire types for practical purposes.
Discussion
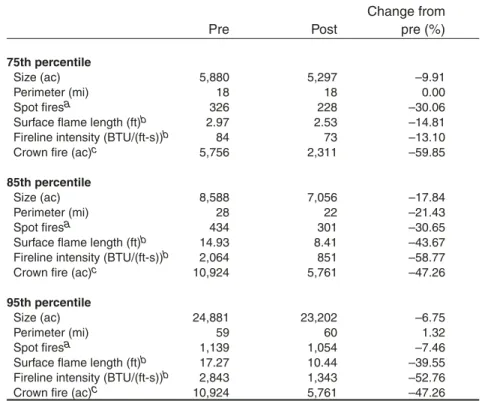
Modeling assumptions and limita-tions. There are several assumptions and limitations to the methodology presented in this article. FARSITE and Table 2. FARSITE and FlamMap fire growth and behavior output for 75th,
85th, and 95th percentile weather and fuel moisture conditions. Change from
Pre Post pre (%)
75th percentile
Size (ac) 5,880 5,297 –9.91
Perimeter (mi) 18 18 0.00
Spot firesa 326 228 –30.06
Surface flame length (ft)b 2.97 2.53 –14.81
Fireline intensity (BTU/(ft-s))b 84 73 –13.10
Crown fire (ac)c 5,756 2,311 –59.85
85th percentile
Size (ac) 8,588 7,056 –17.84
Perimeter (mi) 28 22 –21.43
Spot firesa 434 301 –30.65
Surface flame length (ft)b 14.93 8.41 –43.67
Fireline intensity (BTU/(ft-s))b 2,064 851 –58.77
Crown fire (ac)c 10,924 5,761 –47.26
95th percentile
Size (ac) 24,881 23,202 –6.75
Perimeter (mi) 59 60 1.32
Spot firesa 1,139 1,054 –7.46
Surface flame length (ft)b 17.27 10.44 –39.55
Fireline intensity (BTU/(ft-s))b 2,843 1,343 –52.76
Crown fire (ac)c 10,924 5,761 –47.26
a Number of spot fires initiated in the treatment area during a 6-hour period. b Mean flame length and intensity.
FlamMap, as well as the models used by these modeling systems (e.g., sur-face fire spread, crown fire spread), op-erate under a broad range of assump-tions and have specific limitaassump-tions. Spatial data has resolution and accu-racy limits inherit to mapping of het-erogeneous surface and canopy fuels and terrain. Vegetation cross-walked to
fuel model and fuel model assignments of treated landscapes are occasionally problematic, and model output is largely a reflection of these “conver-sions.” Moreover, RAWS information can be incorrect, unavailable, or influ-enced by local factors not known to the end-user. It is important that users un-derstand model constraints, and more
importantly use models and output within accepted bounds.
FARSITE or FlamMap? FAR-SITE was used to simulate fire spread and spotting potential, al-though several other outputs are available, including fireline inten-sity, flame length, and crown fire activity. Instead, FlamMap was used 37 October/November 2004 • Journal of Forestry Figure 3.FlamMap output for the 85th percentile condition, pretreatment (top) and posttreatment (bottom). The project area boundary is overlaid in black and runs north to south—about 4.5 miles. Interstate 15 is the long linear feature to the east.
to calculate these fire behavior out-puts, for a number of reasons, in-cluding: (1) FlamMap calculations are near instantaneous where as FARSITE simulations can often-times take several hours; (2) FlamMap’s primary design is to dis-tinguish hazardous fuel and
topo-graphic conditions, making pre-and posttreatment comparisons pre-and contrasts across landscapes much easier and more suitable than in FARSITE; (3) although historical fire occurrence was used in this analysis, there is no guarantee fu-ture fires will occur in these areas.
While a pattern is often evident, de-mographics, human activities, and climatic conditions can change, therefore, selecting a specific fire start is often subjective—particu-larly with little or no ignition data—yet tremendously significant to the outcome of the simulation(s), Figure 4.Histograms of FlamMap output for flame length (ft) and fireline intensity (BTU/(ft-s)), pre- and posttreatment for the 75th, 85th, and 95th percentile weather and fuel condition. The normal curve is displayed.
P osttr eatment P osttr eatment Pr etr eatment Pr etr eatment
thus not requiring this input (FlamMap) is advantageous; (4) other parameters, such as determin-ing the distance to the treated area, developing the wind file, specifying the simulation duration, and setting fire behavior parameters, are largely at the discretion of the modeler and difficult to fully substantiate, whereas fewer parameters are re-quired in FlamMap; (5) many fires that often impact an area of con-cern, such as a community like Har-mony Heights, start considerable distances away from the area they threaten, so assessing an area with a single, localized run is limiting.
Modeling discussion.A great deal of information can be obtained by model-ing the effect of fuel treatments on fire growth and behavior and analyzing model outputs. Ideally, modeling will be done before the actual treatment is implemented so model findings can be incorporated to modify the treatment pattern, size, methods, etc. However, postanalysis of fuel treatments, as in this case, can substantiate management decisions, yield useful findings for fu-ture projects, and identify weaknesses in treatment design and application.
At first glance, fuel modifications seem to have had little effect on the fire (Figure 2). In respect to fire growth, this is the case under certain weather conditions. Indeed, some modifications may have even increased the rate of spread by exposing previ-ously sheltered fuels. However, changes in other fire behavior charac-teristics are considerable, thus accom-plishing the objectives of the treat-ment (Table 2).
An area where modeling suggests additional landscape treatments may be beneficial are along the southeast corner of I-15. The large, southeastern most polygon stands alone if a fire ap-proaches from the south. This is in-part due to private ownership directly north. Theoretical modeling indicates the most effective treatment design tends to be those that have fuel modi-fications in succession and distributed strategically across the landscape (Finney 2001). Moreover, the sooner a fire encounters a fragmented fuel com-plex the greater will be the effectiveness
of that treatment on disrupting or lo-cally blocking fire growth. Therefore, a second phase of this project might con-sider additional polygons to the south, like those with considerable overlap to the northwest. By so doing, a fire spreading to the north would en-counter several fuel treatments before reaching public land, potentially mod-ifying fire growth and behavior and aiding firefighting efforts.
Finally, modeling allows for hy-potheses testing. For example, “what is the ‘breaking point’ of the Ash Creek treatment when the weather and fuel conditions are such that treatment ef-fectiveness is minimized in respect to fire growth?” Through multiple simu-lations with varying weather scenarios, this question can be theorized at the 88th to 92nd percentile.
Conclusion
Managers have a growing need to assess the effectiveness of landscape fuel treatments; however, this need has out-paced the development of spatial mod-els to accomplish the task. FARSITE, although not originally intended to do so, has been used to assess treatment ef-fectiveness on fire growth and behavior (Van Wagtendonk 1996, Stephens 1998). The methodology presented in this article uses FARSITE, but also in-corporates FlamMap, FireFamily Plus, and previous ignition history to assess fuel treatment effectiveness. Although the approach has limitations, model outputs yield useful information for planning, assessing, and prioritizing fuel treatments. In the future, enhance-ments to FlamMap will enable users to evaluate landscape alterations on fire spread utilizing minimum travel time methods (Finney 2002) and aid in op-timizing treatment design to mitigate fire behavior and spread.
Acknowledgements
This analysis was supported by the Joint Fire Sciences, Southern Utah Demonstration Project, the Cedar City Field Office of the BLM, and the USDA Forest Service, Rocky Moun-tain Research Station, Missoula Fire Sciences Laboratory. The author ex-presses his thanks to Kevin Ryan, Don Long, Mark Finney, Chuck McHugh,
Miguel Cruz, Steve Small, and Paul Briggs for their support, review, and comments.
Literature Cited
AGEE, J.K., B. BAHRO, M.A. FINNEY, P.N. OMI, D.B. SAPSIS, C.N. SKINNER, J.W. VANWAGTENDONK, AND C.P. WEATHERSPOON. 2000. The use of shaded fuel-breaks in landscape fire management.Forest Ecology and Management 127:55–66.
ALBINI, F.A. 1976. Estimating wildfire behavior and ef-fects. General Technical Report INT-30. Ogden, UT: USDA Forest Service, Intermountain Forest and Range Experiment Station. 92 p.
ALBINI, F.A. 1979. Spot fire distance from burning trees: A
predictive model. General Technical Report INT-56. Ogden, UT: USDA Forest Service, Intermountain Forest and Range Experiment Station. 73 p. ANDERSON, H.E. 1982. Aids to determining fuel models for
estimating fire behavior. General Technical Report INT-122. Ogden, UT: USDA Forest Service, Inter-mountain Forest and Range Experiment Station. 22 p. ANDREWS, P.L., ANDL.S. BRADSHAW. 1997. FIRES: Fire Information Retrieval and Evaluation System—A pro-gram for fire danger rating analysis. General Technical Report INT-GTR-367. Ogden, UT: USDA Forest Service, Intermountain Forest and Range Experiment Station. 64 p.
BRADSHAW, L.S., J.E. DEEMING, R.E. BURGAN, ANDJ.D. COHEN(comps.) 1983. The 1978 National Fire-Dan-ger Rating System: Technical documentation. General Technical Report INT-169. Ogden, UT: USDA For-est Service, Intermountain ForFor-est and Range Experi-ment Station. 144 p.
BRADSHAW, L.S., ANDW.C. FISCHER(comps.). 1984.
Computer programs for summarizing climatic data stored in the National Fire Weather Data Library. Gen-eral Technical Report INT-164. Ogden, UT: USDA Forest Service, Intermountain Forest and Range Ex-periment Station. 39 p.
BRADSHAW, L., ANDE. MCCORMICK. 2000. FireFamily Plus user’s guide, version 2.0. General Technical Re-port. RMRS-GTR-67WWW. Ogden, UT: USDA Forest Service, Rocky Mountain Research Station. BURGAN, R.E. 1988. Revisions to the 1978 National
Fire-Danger Rating System. Research Paper SE-273. Asheville, NC: U.S. Department of Agriculture, For-est Service, Southeastern ForFor-est Experiment Station. 39 p.
COHEN, E., R. NOSTRANT, K. HAWK, AND W.
MITCHELL. 1994. pcFIRDAT/pcSEASON User Guide: FireFamily for personal computers.Sacramento, CA: State of California, California Department of Forestry and Fire Protection. 46 p.
CROSBY, J.S., ANDC.C. CHANDLER. 1966. Get the most from your windspeed observation. Fire Control News
27(4):12-13.
CRUZ, M.G., M.E. ALEXANDER, ANDR.H. WAKIMOTO. 2003. Definition of a fire behavior model evaluation protocol: A case study application to crown fire be-havior models. In Fire, fuel treatments, and ecological restoration: Conference proceedings; 2002 16–18 April; Fort Collins, CO. Proceedings RMRS-P-29,Omi, P.N., and L.A. Joyce (tech. eds.). Ft. Collins, CO: USDA Forest Service, Rocky Mountain Research Station. 475 p.
FINNEY, M.A. 1998. FARSITE: Fire Area Simulator— Model development and evaluation. Research Paper 39 October/November 2004 • Journal of Forestry
RMRS-RP-4. Ogden, UT: USDA Forest Service, Rocky Mountain Research Station. 47 p.
FINNEY, M.A. 2000. A spatial analysis of fire behavior as-sociated with forest blowdown in the Boundary Waters Canoe Area, Minnesota.Duluth, MN: USDA Supe-rior National Forest. Available online at www.superi- ornationalforest.org/july4thstorm1999/bwcara/bw-cawra.html.
FINNEY, M.A. 2001. Design of regular landscape fuel treatment patterns for modifying fire growth and be-havior.Forest Science 47:219–228.
FINNEY, M.A. 2002. Fire growth using minimum travel time methods. Canadian Journal of Forest Research
32:1420–1424.
FINNEY, M.A. In preparation. FlamMap.Missoula, MT: USDA Forest Service, Rocky Mountain Research Sta-tion, Fire Sciences Laboratory.
FORESTRYCANADAFIREDANGERGROUP. 1992. Devel-opment and structure of the Canadian Forest Fire Be-havior Prediction System. Information Report ST-X-3.
FREW, J.E., JR. 1990. The Image Processing Workbench.
Ph.D. dissertation, University of California, Santa Barbara, CA. 305 p.
FULÉ, P.Z., C. MCHUGH, T.A. HEINLEIN, ANDW.W. CONVIGTON. 2001. Potential fire behavior is re-duced following forest restoration treatments. In Ponderosa pine ecosystems restoration and conservation: steps toward stewardship: Conference proceedings; 2000 25–27 April; Flagstaff, AZ. Proceedings RMRS-P-22, Vance, R.K., C.B. Edminster, W.W. Coving-ton, and J.A. BLAKE(comps.). Flagstaff, AZ: USDA Forest Service, Rocky Mountain Research Station. 188 p.
LONG, D.G., K.C. RYAN, and R.D. STRATTON. In prepa-ration.Southern Utah Fuel Management Demonstra-tion Project. Missoula, MT: USDA Forest Service, Rocky Mountain Research Station, Fire Sciences Lab-oratory. Available online at www.firelab.org/fep/re-search/sufm/home.htm.
MAIN, W.A., D.M. PAANANEN, and R.E. BURGAN. 1990.
FIREFAMILY 1988.General Technical Report NC-138. St. Paul, MN: USDA Forest Service, North Cen-tral Forest Experiment Station.
NELSON, R.M., JR. 2000. Prediction of diurnal change in 10-h fuel stick moisture content. Canadian Journal of Forest Research30:1071–1087.
ROTHERMEL, R.C. 1972. A mathematical model for pre-dicting fire spread in wildland fuels. Research Paper INT-115. Ogden, UT: USDA Forest Service, Inter-mountain Forest and Range Experiment Station. 40 p. ROTHERMEL, R.C. 1991. Predicting behavior and size of
crown fires in the Northern Rocky Mountains.Research Paper INT-438. Ogden, UT: USDA Forest Service, Intermountain Forest and Range Experiment Station. 46 p.
SCOTT, J.H., ANDE.D. REINHARDT. 2001. Assessing crown fire potential by linking models of surface and crown fire behavior. Research Paper RMRS-RP-29. Ft. Collins, CO: USDA Forest Service, Rocky Mountain Research Station. 59 p.
STEPHENS, S.L. 1998. Evaluation of the effects of silvi-cultural and fuels treatments on potential fire behav-ior in Sierra Nevada mixed conifer forests.Forest Ecol-ogy and Management 105:21–35.
USDA FORESTSERVICE. 1993. National Interagency Fire
Management Integrated Database (NIFMID) reference manual. Washington, DC: USDA Forest Service.
USDA FORESTSERVICE. 1996. KCFAST: Kansas City
Fire Access Software user’s guide. Washington, DC: USDA Forest Service, Fire and Aviation Manage-ment. Historical Fires available online at famweb.nwcg. gov/kcfast/html/ocmenu.htm; His-torical Weather available online at famweb.nwcg.gov/kcfast/html/wxmenu.htm. USDA FORESTSERVICEand US DEPARTMENT OFINTE
-RIOR. 2000. A report to the President: In response to the wildfires of 2000. Washington, DC.
VANWAGNER, C.E. 1977. Conditions for the start and spread of a crown fire. Canadian Journal of Forest Re-search 71(3):23–34.
VANWAGNER, C.E. 1993. Prediction of crown fire be-havior in two stands of jack pine. Canadian Journal of Forest Research442–449.
VANWAGTENDONK, J.W. 1996. Use of a deterministic
fire growth model to test fuel treatments. P.
1155–1166 in Status of the Sierra Nevada: Sierra Nevada Ecosystem Project Final Report to Congress Vol-ume II. Wildland Resources Center Report No. 37. Uni-versity of California, Davis: Center for Water and Wildland Resources.
Rick D. Stratton (stratton@montana.com) is a fire modeling analyst with Systems for Environmental Management, PO Box 8868, Missoula, MT 59807.