A Data Warehouse/Online Analytic
Processing Framework for Web Usage
Mining and Business Intelligence
Reporting
Xiaohua Hu,1,*Nick Cercone2,† 1
College of Information Science, Drexel University, Philadelphia, PA 19104 2
Faculty of Computer Science, Dalhousie University, Halifax, Nova Scotia, Canada
Web usage mining is the application of data mining techniques to discover usage patterns and behaviors from web data (clickstream, purchase information, customer information, etc.) in order to understand and serve e-commerce customers better and improve the online business. In this article, we present a general data warehouse/online analytic processing (OLAP) framework for web usage mining and business intelligence reporting. When we integrate the web data ware-house construction, data mining, and OLAP into the e-commerce system, this tight integration dramatically reduces the time and effort for web usage mining, business intelligence reporting, and mining deployment. Our data warehouse/OLAP framework consists of four phases: data capture, webhouse construction (clickstream marts), pattern discovery and cube construction, and pattern evaluation and deployment. We discuss data transformation operations for web usage mining and business reporting in clickstream, session, and customer levels; describe the prob-lems and challenging issues in each phase in detail; provide plausible solutions to the issues; and demonstrate the framework with some examples from some real web sites. Our data warehouse/ OLAP framework has been integrated into some commercial e-commerce systems. We believe this data warehouse/OLAP framework would be very useful for developing any real-world web usage mining and business intelligence reporting systems. © 2004 Wiley Periodicals, Inc.
1. INTRODUCTION
Knowledge about customers and understanding customer needs is essential for customer retention in a web store for online e-commerce applications, because competitors are just one click away. To maintain a successful e-commerce solution, it is necessary to collect and analyze customer click behaviors at the web store. A
*Author to whom all correspondence should be addressed: e-mail: [email protected].
†e-mail: [email protected].
INTERNATIONAL JOURNAL OF INTELLIGENT SYSTEMS, VOL. 19, 585– 606 (2004) © 2004 Wiley Periodicals, Inc. Published online in Wiley InterScience
web site generates a large amount of reliable data and is a killer domain for data mining application. Web usage mining can help an e-commerce solution to improve up-selling, cross-selling, personalized ads, click-through rates, etc. by analyzing the clickstream and customer purchase data through data mining tech-niques. Recently, web usage mining has attracted much attention from research and e-business professionals and it offers many of the following benefits to an e-com-merce web site:
● Targeting customers based on usage behavior or profile (personalization)
● Adjusting web content and structure dynamically based on page access patterns of users (adaptive web site)
● Enhancing service quality and delivery to the end user (cross-selling, up-selling)
● Improving web server system performance based on the web traffic analysis
● Identifying the hot area/killer area of the web site
We present a general data warehouse/OLAP framework for web usage mining and business intelligence reporting. In our framework, data mining is tightly integrated into the e-commerce systems. Our data warehouse/OLAP framework consists of four phases: data capture, webhouse construction (clickstream marts), pattern discovery, and pattern evaluation as shown in Figure 1. This framework provides the appropriate data transformations [also called extraction, transformation, and loading (ETL)] from the online transactional processing (OLTP) system to the data warehouse, builds data cubes from the data warehouse, mines the data for business analysis, and, finally, deploys the mining results to improve the online business. We describe the problems and challenging issues in each phase in detail and provide a general approach and guideline to web usage mining and business intelligence reporting for e-commerce.
In Section 2, we discuss the various data capture methods and some of the pitfalls and challenging issues. In Section 3, we describe the data transformation operations for web data at different levels of granularity (clickstream level, session level, and customer level) and show how to organize the dimensions and fact tables for the webhouse, which is the data source for web usage mining and business intelligence reporting. We discuss the cube construction and various data mining methods for web usage mining in Section 4 and pattern evaluation (mining rules evaluation) in Section 5. In Section 6, we conclude with some insightful discussion.
2. DATA CAPTURE
Capturing the necessary data in the data collection stage is an essential step for a successful data mining task. A large part of web data is represented in the web
Figure 1. The data warehouse/OLAP data flow diagram.
log collected by the web server. A web log records the interactions between web server and web user (web browsers). A typical web log (common log format) contains information such as Internet provider (IP) address, identification data (ID) or password for access to a restricted area, a time stamp of the uniform resource locator (URL) request, method of transaction, status of error code, and size in bytes of the transaction. For the extended log format, it includes the extra information such as a referrer and agent. Initially, web logs were designed to help debug the web server. One of the fundamental flaws of analyzing web log data is that log files contain information about the files transferred from the server to the client—not information about people visiting the web site.1,2,3,4 Some of these fields are
useless for data mining and are filtered in the data preprocessing step. Some of them such as the IP address, referrer, and agent can reveal much about the site visitors and the web site. Mining the web store often starts with the web log data. Web log data need to go through a set of transformation before data mining algorithms can be applied. To have a complete picture of the customers, web usage data should include the web server access log, browser logs, user profiles, regis-tration data, user sessions, cookies, user search keywords, and user business events.1,5,6 – 8 Based on our practice and experience in web usage mining, we
believe that web usage mining requires conflation of multiple data sources. The data needed to perform the analysis should consist of five main sources:
(1) The web server logs recording the visitors’ clickstream behaviors (pages template, cookie, transfer log, time stamp, IP address, agent, referrer, etc.)
(2) Product information (product hierarchy, manufacturer, price, color, size, etc.) (3) Content information of the web site (image, gif, video clip, etc.)
(4) The customer purchase data (quantity of the products, payment amount and method, shipping address, etc.)
(5) Customer demographics information (age, gender, income, education level, lifestyle, etc.)
Data collected in a typical web site categorize to different levels of granularity: page view, session, order item, order header, and customer. A page view has the information such as type of the page and duration on the page. A session consists of a sequence of page views; an order contains a few order items. In the data collection phase it is best to collect the finest granular and detailed data possible describing the clicks on the web server and items sold at the web store. Each web server will potentially report different details, but at the lowest level, we should be able to obtain a record for every page hit and every item sold if we want to have a complete portfolio of the click behavior and sale situation of the web store.
There are various methods to capture and collect valuable information for visitors for e-commerce at the server level, proxy level, and client level through the computer-generated imagery Common Gateway Interface (CGI), Java application program interface (API) and JavaScript.1,5,7 Most of them use web log data or
packet sniffers as a data source for clickstream. For the purpose of data mining, web log data are not sufficient for the following main reasons:
(2) Lack of web store transaction data; the web store transaction records all sale-related information of a web store and it is necessary for business analysis and data mining in order to answer some basic and important business questions such as “which referrer site leads to more product sale at my site?” “What is the conversion rate of the web site?” and “Which part of my web sites are more attractive to the purchaser?” (3) Lack of business events of web store; business events of a web store such as “add an
item to the shopping cart,” “research key event,” and “abandoning shopping cart” are very useful to analyze user shopping and browsing behavior of a web store.
In our framework, we believe that collecting data at the web application server layer is the most effective approach, as suggested by some commercial vendors.1,7 The web application server controls all the user activities such as registration and logging in/out and can create a unified database to store web log data, sale transaction data, and business events of the web site. Discussion of these methods is beyond the scope of this study. For interested readers, please refer to Refs. 1 and 7.
There are challenging issues in the data capture phase for web usage mining. The following challenges illustrate three problems: (1) how to sessionize the clickstream data; (2) how to filter crawler sessions; and (3) how to gather customer information. These challenges are the most popular ones encountered in almost all of the web usage mining projects, and these problems have a huge impact on the success or failure of web usage mining projects. In the following sections, we discuss each of them in detail.
2.1. Session Data
A user web session is a sequence of consecutive page views (hits) before the user explicitly logs out or times out. A user who visits a site in the morning and then again in the evening would count as two user visits (sessions). Because of the statelessness of hypertext transfer protocol (HTTP), clickstream data is just a sequence of page hits; a page hit may be an isolated event that is hard to analyze without considering the context. To make the raw clickstream data usable in web usage mining, the clickstream needs to be collected and transformed in such a way that it has a session perspective. Thus, the first task after data collection is to identify the sessions for the clickstream stream (sessionizing the clickstream). In some web usage mining systems, during preprocessing, individual log entries are aggregated into server sessions according to the IP address and agent information. New sessions also are identified using a 30-minute intersession time-out period.9,10
Within each session, the log entries are grouped into a separate request where each request may correspond to an individual user click or a search event. Nonetheless, there are some serious problems when processing in this way. Many internet users utilize an Internet service provider (ISP); their IP address may be assigned dynamically so it is very likely that the same user will have a different address in different sessions.7,11,12–14Another problem is that users behind a firewall can all
have the same IP address; an IP address is not suitable as an identification variable for such sessions.
Realizing the limitations of relying on the IP address, cookies are used as a work-around to solve this problem and to sessionize the clickstream in many web sites. A cookie is a mechanism that allows the web server to store its own information about a user on the user’s hard driver. It is a small file that a web server sends to a web user and stores on his computer so that it can remember something about you at a later time. The location of the cookies depends on the browser. Internet Explorer stores each cookie as a separate file under a Window’s subdi-rectory. Netscape stores all cookies in a single cookies.txt file. Sites to store customization information or to store user demographic data often use this infor-mation. The main purpose of cookies is to identify users and possibly prepare customized web pages for them. If the cookie is turned on, that means the user will send the cookie back to the web server each time his browser opens one of the web pages and the web server can identify the requesting users’ computer unambigu-ously. Thus, the browser puts all the hits with the same cookie as one session until the user explicitly logs out or times out. In some situations, for privacy concerns, some users choose to turn off cookies, and then the web site needs to use login ID and referrer and agent information, if possible, to identify user and server sessions.1,9
2.2. Crawlers Session
A crawler is a software agent that traverses web sites based on web linkages in web pages. Search engines use crawlers to index web pages and crawlers can help users to gather information, such as prices for certain products, and help web designers to diagnose web site problems (such as response time, isolated web pages, etc.). Most crawlers adopt a breadth-first retrieval strategy to increase their coverage of the web site. In our experience with some web site data, at times up to 30% of site clickstream session traffic may be crawlers; these sessions are called crawler sessions. Crawler sessions may mislead data mining analysis to generate inaccurate or incorrect results if they are not filtered. For example, an associate algorithm is used to find the page click orders in a session, as pointed out in Refs. 5, 9, 15, and 16, and an association rule mining algorithm may inadvertently generate frequent item sets involving web pages from different page categories. Such spurious patterns may lead an analyst of an e-commerce site to believe that web surfers are interested in products from various categories when, in fact, crawlers induce such patterns.1,9,17 This problem can be avoided if web crawler
sessions are removed from the data set during data preprocessing. Thus, identifying crawler sessions is very important for web usage mining. There are a few ways to identify a crawler session. In Ref. 9, they build a classification model to identify sessions. The crawler sessions may have some of the following characteristics: images turned off, empty referrers, visit robots.txt file, very short page duration time, pattern is a depth-first or breadth-first search of the site, and/or never purchase.11Some web sites adopt the approach that creates an invisible link on a
page and because only crawlers follow invisible links (regular users cannot click invisible links), the sessions consisting of the invisible links are considered to be a crawler session.
2.3. Customer Demographics (Offline Date)
Retaining customers and increasing sales is the only way for an e-commerce web store to survive in this very competitive online market. To retain customers, you need to understand their needs and preferences. As pointed in Refs. 12, 18, and 19, fostering and promoting repeated sales requires knowledge about customers’ preferences, consumption rate, behavior, and lifestyle. This knowledge generally requires knowing a customer’s income, age, gender, lifestyle, etc. To find the best way to reach its customers and increase sales, it is necessary for a company to enrich the clickstream with this offline information. The user of demographics, psychographics, property information, household characteristics, individual char-acteristics, lifestyle, has been used by database marketing professionals to improve their sales, retain customers, and acquire new customers for bricks-and-mortar stores for decades. This information also should be used in a web store to enhance the vast amount of customer and clickstream behavior already captured at the web site.
In the web store, customer information can be collected through a registration form, which often is limited. Some web sites offer incentives to users to encourage them to register or answer a set of questions. The problem is that users tend not to give the information or they provide inaccurate information on registration forms. Fortunately, there are many commercial marketing database vendors that collect this information based on zip code or physical addresses. This information should be integrated to web data for additional insight into the identity, attributes, lifestyles, and behaviors of the web site visitors and customers.19There are several
sources of demographic information at various levels such as CACI, Acxiom, and Experian. CACI provides neighborhood demographics; Acxiom gives household-level psychographics; and Experian provides the MOSAIC targeting system, which identifies consumers according to the type of neighborhood in which they live.19
These external offline demographics can identify online visitors and customers, where they live, and, subsequently, how they think, behave, and are likely to react to your online offers and incentives. Database marketers have used this information for years to segment their customers and potential prospects. The demographics and socioeconomic profiles are aggregated from several sources including credit card issuers, county recorder offices, census records, and other cross-referenced statistics.19 When analyzing and mining customer demographics data from web
data, customer privacy always should be kept in mind. Profiling customers is bad when web sites fail to do it anonymously.
3. DATA WEBHOUSE CONSTRUCTION
A data warehouse provides the data source for OLAP and data mining. Designing a proper data warehouse schema and populating the data from the OLTP system to the warehouse is very time-consuming and complex. A well-designed data warehouse would feed business with the right information at the right time in order to make the right decisions in the e-commerce system.1,20,21In Section 2, we
discussed data capture methods for the web site, which collect the clickstream, 590
sales, customers, shipments, payments, product information, etc. These data are online transaction data and are stored in the transaction database system (OLTP). The database schemas of the OLTP are based on entity-relationship (E-R) mod-eling, normalized to reduce redundancy in the database and designed to maintain atomicity, consistency, and integrity to maintain speed and efficiency for use in day-to-day business operations such as inserting, updating, and deleting a trans-action. For an OLTP query, it normally only needs to access a small set of records in the databases but it demands very quick responses. For web usage mining purposes, it needs to have a database schema (called a data warehouse) designed to support decision making and data analysis (OLAP). Typical relational databases are designed for OLTP and do not meet the requirements for effective OLAP. As a result, data warehouses are designed differently than traditional relational data-bases. Data warehouses use OLTP data for historical, read-only analysis. The data in a data warehouse system normally are organized in multidimensional modeling with star schema (fact tables plus the surrounding dimension tables). The require-ment of clickstream data in the data warehouse makes the schema design even more complicated. The web challenges the current view of the data warehouse with multiple new requirements.18The data warehouse is required to make the customer
clickstream available for analysis; therefore, a new term webhouse was coined by Ralph Kimball.18,22A webhouse plays an integral role in the web revolution as the
analysis platform for all the behavior data arriving from the clickstream, as well as for the many web sites that rely on the data warehouse to customize and drive the end user’s web experience in real time.18We use a webhouse to refer to the data
warehouse system for the web usage mining. The webhouse is the source data of data mining and business intelligence reporting in the data warehouse/OLAP framework and it contains the fundamental business content of what a web store sells with web services and capabilities. A webhouse should allow you to analyze all hits on a web site and all the products sold in the web store from many viewpoints. Many systems have developed to web log record mining, which finds association patterns and sequential patterns about web accessing; but to understand customers such as repeated visitors versus single visitors, and single purchase customers versus multiple purchase customers, it is necessary to include additional information such as order information from the web store, product information about the product, user browsing sequence from clickstream, and customer infor-mation from user tables. In the following section we discuss the requirement analysis and dimensional modeling technique to design the webhouse.
3.1. Requirement Analysis of the Webhouse
It is necessary to build a comprehensive view of the immerse stream of clicks arriving at web sites, including items sold through the site. We want to build a webhouse to provide insightful information and answer the important business questions for e-commerce. The design of a webhouse starts with the requirement analysis. We spent significant time interviewing our clients, business analysts, engineers/developers, and end-users to gather their requirements and what kinds of
business problems they hope solve from the webhouse. Their questions cover wide ranges and areas:
● Web site activity (hourly, daily, weekly, monthly, quarterly, etc.)
● Product sale (by region, by brand, by domain, by browser type, by time, etc.)
● Customers (by type, by age, by gender, by region, buyer versus visitor, heavy buyer versus light buyer, etc.)
● Vendors (by type, by region, by price range, etc.)
● Referrers (by domain, by sale amount, by visit numbers, etc.)
● Navigational behavior pattern (top entry page, top exit page, killer age, hot page, etc.)
● Click conversion ratio
● Shipments (by regular mail, by express mail, etc.)
● Payments (by cash, by credit card, by e-money, etc.)
Some of the important questions are
● Who are my most profitable customers?
● What is the difference between buyers and nonbuyers at my site?
● Which parts of my site attract the most visits?
● Which part of my site is a session killer?
● Which parts of the sites lead to the most purchases?
● What is the typical click path that leads to a purchase?
● What is the typical path of customers who abandoned the shopping cart?
● What are the percentages of customers visiting the product section?
● What is the new-visitor click profile?
● What are the top/bottom products?
● What are the peak traffic hours?
We analyzed these questions and determined that the dimensions needed to be constructed and the fact measure the business analysts needed are to be determined. After identifying the dimensions and measures, we can move to the next step: webhouse schema design.
3.2. Webhouse Schema Design
In the webhouse, there are one or several fact tables and a set of small tables called dimensional tables. The fact table is where numerical measurements of the business are stored. Each of these measurements is taken at the intersection of all dimensions. The dimension tables are where the textual descriptions of the dimen-sions of the business are stored.18There are several design methodologies to design
a data warehouse such as the architecture-based methodology proposed by Ana-hory and Murray,23 and the four-step methodology used by Ralph Kimball. To
construct the webhouse for the data warehouse/OLAP framework, we adopted Kimball’s methodology to build the webhouse through dimensional modeling techniques.
The four-steps include (1) defining the source of data, (2) choosing the grain of the fact tables, (3) choosing the dimensions appropriate for the grain, and (4) choosing the facts appropriate for that grain. We discuss each step in detail in the following sections.
3.2.1. Define the Source Data
Because we wish to analyze click behavior and the sales situation of a web site for an online web store, we need to have the data for every web hit on the web site and every item sold in the web site. Data collection is at the page request level (clickstream) or purchase in the order item level and all of this information is already available in the transaction database (OLTP). In the data collection phase, we have collected every web page view, purchase data and customer information in the web database system, which is the data source for our webhouse. We need to extract them from the transaction database and transform them into the web-house according to the design of the dimension tables and fact tables, which is described later. In addition, we also need to have product, use, page, time, payment, shipping, and promotion information.
3.2.2. Choose the Grain of the Fact Tables
The fact table is the center of the webhouse. It contains a list of all measures and points to the key value of the lowest level of each dimension. The lowest level of each dimension table, business problems, and domain determines the granularity of the fact table. Before the fact tables can be designed in detail, a decision must be made as to what an individual low-level record in that fact table means. This is the grain of the fact table.18To analyze the clickstream, every page hit should have a row in the clickstream fact table, which is the grain of the clickstream. To analyze the sales business of the web store, every item sold should have a row for order item fact table. Thus, the grain of the item fact tables in the webhouse is every item sold.
3.2.3. Choose the Dimensions Appropriate for the Grain
Dimensions are qualifiers that give meaning to measures. They organize the data based on the what, when, and where components of a business question. Dimensions are stored in dimension tables made up of dimensional elements and attributes. Each dimension is composed of related items or elements. Dimensions are hierarchies of related elements. Each element represents a different level of summarization. For example, products roll up to subcategories, which roll up to categories (which in turn roll up to department, etc.). The lowest level in the hierarchy is determined by the lowest level of detail required for the analysis. Levels higher than the base level store redundant data. This denormalized table reduces the number of joins required for a query and makes it easier for users to start querying at a higher level and to drill down to lower levels of detail as needed. All of the elements relating to the product, e.g., would comprise the product dimension. This allows the user to query for all categories and drill down to the subcategories or product level for more detailed information. In the following sections, we discuss some of the important dimensions in the webhouse. (The discussions of some other dimensions such as business event dimension and promotion dimension are omitted because of space limitations; these dimensions are almost the same in the webhouse compared with the traditional data warehouse.)
Session Dimension. The session dimension is more than just a tag that groups together all the page events that constitute a single user’s session. The session dimension is the place where we label the session and trace its activity,18 to
describe the characteristics of the session. The characteristics of a session should consist of session length, the total page requests of the session, the first pages of the session, last pages of the session, the referrer of the session, cookie ID, user agent, client host, the first request time, the last request time, total browsing time of the session, average viewing time of each page of the session, and session visit count. We may need to characterize sessions as “sessions with purchase,” “sessions without purchase,” “random browsing,” “crawler sessions,” etc. With this infor-mation, we are able to answer business questions such as which page my customer comes to on my site (top first page of the sessions) and where they leave (top last page of the session) and what are the characteristic of the sessions that lead to purchase?
Page Dimension. Site area analysis is very important in order to understand which part of the web site attracts most of the hits, which part leads to a purchase, which part of the site is a “killer,” and which part of the site is less visited and superfluous. The page dimension should contain meaningful context that tells the analyst the user’s web site location. Each web page must contain some simple descriptors identifying the location and type of page such as “log in,” “registra-tion,” “hot product,” “product info,” “company info,” “frequently asked ques-tions,” and “order form”.22A large web site should have a hierarchical description
associated with each page that gives progressively more detail about what consti-tutes the page. This information needs to be stored in the page dimension and be maintained consistently as we update and modify the web site. A page dimension also should contain such information as page template, page category, number of images, and banners on the page, etc.
Time Dimension. The time dimension is very important in every data warehouse because every fact table in the data warehouse is a time series of observations of some sort. In traditional data warehouses, the time dimension is at a daily grain, but for the webhouse the granularity is finer. We have seen some webhouses record at the hourly grain or even minute level. Data column in a relational table normally has the format as year, month, day, hour, minute, and seconds (YYYYMMDD:: HHMMSS). We need to create new attributes representing date of week, day of year, and quarters from date column attributes. Because in a web environment, we are analyzing both the click stream behavior and the sales, it makes perfect sense to have two time hierarchies. One is more or less the traditional time dimension in the data warehouse: date related to day, week, month, quarter, and years (may need to use data transformation function to construct new attributes and properties: weekday, weekend, holiday season, etc.), which is useful to compare sales across day, month, quarter, or year. The other time hierarchy is the time of the day related to a specific spot within a day, hour, or minute in the day, (some derived useful attributes are early morning, late afternoon, evening, working hour, lunch break, etc.). This time hierarchy is useful for site traffic analysis.
User Dimension. To obtain good customer profiles, variables describing the characteristics of the customer should be added. If available, this information is given in a data warehouse where all customer characteristics and historical infor-594
mation about click behavior are stored. To combine this information with the transaction data, the users must identify themselves when visiting the web site so the cookie ID could be matched with their names and the transactional data could be merged with customer-relevant data. The customer dimension should contain information such as name, addresses, gender, age, demographics, and lifestyle. Identifying the user is very important to distinguish different types of visitors to the web site. In the user dimension we need to label users as “single visitors,” “repeat visitors,” “visitor with single purchase,” “visitor with multiple purchases,” or “most profitable customer” based on the amount they spend. Based on the user dimension information, we should be able to answer business questions related to different user types.
Product Dimension. The product dimension describes the complete portfolio of what the web site sells online and the information varies from different online stores. For example, Amazon.com has a larger product dimension than an online bank. Normally, the product dimension should contain information such as product key, stock-keeping unit (SKU) description, product property (weight, size, color, package type, etc.), brand, sub category, department), price, manufacturer, and warranty information.
3.2.4. Choose the Facts Appropriate for That Grain
Choosing the appropriate fact measures for the grain in the fact table depends on the business objective and analysis purposes. For the clickstream fact, we can choose the time (number of seconds) the user spent on each page. For the order fact table, we can choose revenue, profit, cost, quantity, and other measures. The star schema for the webhouse is constructed as shown in Figure 2.
3.3. Data Transformation
Creating a warehouse is not enough because a lot important information is not in the data warehouse yet; e.g., for the session, it is essential to know the number of pages, time spent, or the session leads to purchase or not. For the customer, it is necessary to create attributes such as whether the customers are repeat visitors, heavy spenders, or occasional shoppers, etc. These new attributes need to be created/derived from existing database columns to make data mining and reporting easier or even possible. There are two sets of transformations that need to take place: (1) data must be transferred from the OLTP systems to the OLAP systems and (2) data may need to go through some transformation or conversion to create some new values, which are not explicitly represented in the data warehouse. The first set of transformation is relatively stable and straightforward. There are a lot of ETL tools on the market for this purpose.16 The second set of transformation
provides a significant challenge for web usage mining because a lot of these transformations are related to the application domains and business goals. Typi-cally, in the web warehouse, the data are collected in the clickstream level. For data mining and business intelligence reporting purposes, the data in the data warehouse need to be transformed or aggregated to different levels of granularity (session
level, order-header level, or customer level) depending on the mining and reporting goals. For example, if the analyst is interested in the difference between sessions with purchase and without purchase, then the transformation/aggregation opera-tions need to be performed to convert clickstream data into the session level. If the analyst wants to understand the characteristics of the most-profitable customers, then the data need to transform/aggregate further from session level to customer level. There are three types of transformations in the web usage mining context:
(1) Generalizing/extracting the primitive values to high level values. For example, the “referrer” column for each click session has too many different values but some useful information is embedded in it so it is useful to create new columns from it such as the “host” of the referrer and the “domain” of the referrer and, similarly, new columns such as “domain” and “host” from ISPs and customer e-mails
Figure 2. Star schema of webhouse.
(2) Grouping/summarizing information from multiple columns. For example, in the customer preference survey, there are columns such as “prefer basketball,” “prefer football,” and “prefer baseball,” corresponding to the customer’s first, second, and third preferred sport. For mining or reporting purposes, it is better to increase the granularity by generating new columns to indicate the customer preference phi-losophy.
(3) The third type of new column created is for inferring information not directly available from existing database columns. For example, to have an image of a customer’s product page views, it needs to know whether a click record is a product page view from “brands,” which is not directly available. This information can be inferred from the “template” and “referrer” columns.
Based on our experience, the following are some of the typical data transformation operations we found very popular and useful for web usage mining and reporting:
(1) Click level transformation
Transformation name Transformation description Result type Referrer indicator for
a product page
Creates an indicator variable for referrer for an arbitrary product page. Product detail page views are important information for a web store. Within a web store, you can go to a product page from different places depending on how the web store is designed. (e.g., ViewfromHotArea, ViewfromGifts). To analyze the clickstream data, it is helpful to know which area each product page view comes from and it is defined based on the “type,” “template,” and “referrer” columns
Boolean
Page view time The number of seconds that a person spends viewing a page Double Credit card indicator
(MasterCard, Visa, AMX, etc.)
Indicate whether the transaction was completed using which type of credit card
Boolean
Decode the query string
The operation returns the search results of the search arguments the customers typed while they surfed the web site
String
Path of session This operation pulls the templates of the session into a long string
String Detailed path of the
session
Similar to the foregoing operation, except you will get the detailed dynamic generated page
String Last page of the
session
Return the last page of the session String First page of the
session
Return the first page of the session String Click area The column tells which area a click is on or “none” for
nonclick
Boolean Click tags Check whether a click is a gift-box view or shopping-cart
view String Purchases of products that appear on Whats_hot pages
It is very useful to know who bought products from the “Whats_hot” pages, or what products were bought from the “Whats_hot” pages. However, this is very hard to do without an event log. What can be done is to find purchases of products that appear on “Whats_hot” pages. Note that these products may appear on other pages and customers can buy them there
When did a customer fill the registration (survey) form?
Web site normally has an optional registration form that contains some survey questions. Knowing answers to these questions can help develop a better understanding of customers (before any purchases or after purchases)
Boolean
The foregoing transformations can capture a lot of essential information for reporting and helping the business analysts understand and improve the web site performance and function increase customer satisfaction. For example, the query decode string transformation and can capture the top 10 failed search keywords from the customers as shown in Table I from a real online motor store. “Fat boy” and “chrome” are the most popular items the customers are looking for. Then, the store manager can make a decision to add these items to the web store if a lot of customers showed interests in these items.
(2) Session level transformation
Transformation name Transformation description Result type Customer browser
name
Return a string containing the browser’s name from the user agent if the flag is true; otherwise, group all unknown browser names to “others”
String
Browse release The release number of the browser given the user agent string. The main release number is for Mozilla. It will contain the release number for MS Internet Explorer inside “( )” if the browser is an IE browser. It contains “AOL” and its release number inside “[ ]” if the browser is an AOL browser.
String
Browse OS The Operating System (OS) running the browse String Returned visitor True if the user is a returned visitor Boolean Session length The total clicks of this session Integer Long session Indicate whether the session is a long one or not (⬎6 clicks) Boolean Short session Indicate whether the session is a long one or not (1 or 2 clicks) Boolean Session duration The total time spent on this session Double
Referrer host Host of the referrer String
Referrer domain Domain of the referrer String
URL site Return the URL site such as Yahoo, Excite, etc. String
ISP host Internet service provider host String
What day it is of the first visit
A number to indicate which day it is for the first visit Double What day it is of the
last visit
A number to indicate which day it is for the last visit Double Is the visit a
weekend
Indicate whether the visit happens on a weekend or not Boolean Is the visit a
weekday
Indicate whether the visit happens on a weekday or not Boolean Any purchase on this
session
Indicate whether the session leads to any purchase or not Boolean Purchase amount in
different areas
In addition to the numbers of product detail page views that came from different areas, it also is important to know customers’ purchase amount from each area. Because it is hard to trace where a purchase comes from precisely, it can be estimated by distributing the total purchase amount to each area using the proportion of the number of product detail page views from this area
Double
Purchase quantity in different areas
Similar to customers’ purchase amount from each area, it is necessary to know customers’ purchase quantity from each area
Double
Hour of day of the server
Shows the visitor’s time from the first request date based on the location of the server
Double Time period of the
day
Based on the hour of day, you can add more columns to indicate whether the visit time is in the morning or evening, etc. (such as early morning, late evening, lunch time, etc.)
Boolean
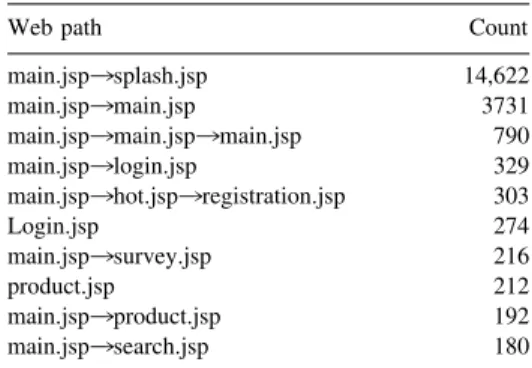
Table II shows the top 10 paths of a web site without any purchase. These paths can help the web site understand the customer click behavior and reveal a lot of reasons why the customers left the web site without making a purchase. For example, the top path is main.jsp3splash.jsp (14,622 sessions). The customers visited the main.jsp and then left the web site after clicking the splash.jsp. A further analysis by the web designer found that the splash.jsp took a while to compile and download and the effect of the animation of the splash.jsp made a huge portion of the contents of the store invisible, and thus caused a lot of frustrations among the customers; so, they left. After the splash.jsp was removed, the conversion rates improved significantly.
Table I. Top 10 failed searches.
Search string No. of searches
Fat boy 1566
Chrome 791
Motorclothes 443
G-type fuel tank 325
G-sportster 280 Maintenance 260 C-sidecar 210 Sissy bar 175 Seat 169 Touring 163
Table II. Top 10 paths lead to nonpurchased sessions.
Web path Count
main.jsp3splash.jsp 14,622
main.jsp3main.jsp 3731
main.jsp3main.jsp3main.jsp 790
main.jsp3login.jsp 329
main.jsp3hot.jsp3registration.jsp 303
Login.jsp 274
main.jsp3survey.jsp 216
product.jsp 212
main.jsp3product.jsp 192
(3) Customer level transformation
Transformation name Transformation description Result type e-mail domain The domain name is the portion of the e-mail address after
the last period such as COM, NET, EDU, etc.
String e-mail host name The host name is the portion of the e-mail address after
the at sign (@) and before the last period (.)
String Time zone Time zone of the customer
Area code Area code of the customer’s phone number String
Country region Country region of the customer String
Repeat buyers Indicator whether the visitor is a repeated buyer or not Boolean Single-visit customer Customer only visited once and no purchase was made Boolean Multiple-visit customer Customer visited multiple times but no purchase was made Boolean Single-visit buyer Customer visited once and made a purchase Boolean Multiple-visit buyer Customer visited multiple times and made at least one
purchase
Boolean Profit ration (average
revenue per visit)
Profit ratio is defined as the total number of sales divided by total number of visits
Double Propensity-to-purchase ratio Indicate the likelihood of the visit or purchasing something Double Things preferred and things
really bought
In the survey form, there are questions such as “preferred brands,” “preferred products,” and “special needs.” It should be valuable information if we know the correlation between what a customer prefers and what he/she buys
String
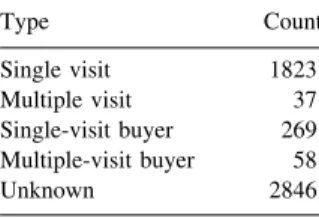
The customer level transformation created a lot of new columns in the data warehouse to make the reporting and data mining easier and more meaningful at the customer level. For example, identifying whether a customer is a single visitor, buyer, repeated buyer, etc., is very important for the web store. Table III can reveal how many customers are loyal customers, occasional shoppers, or just pure visitors.
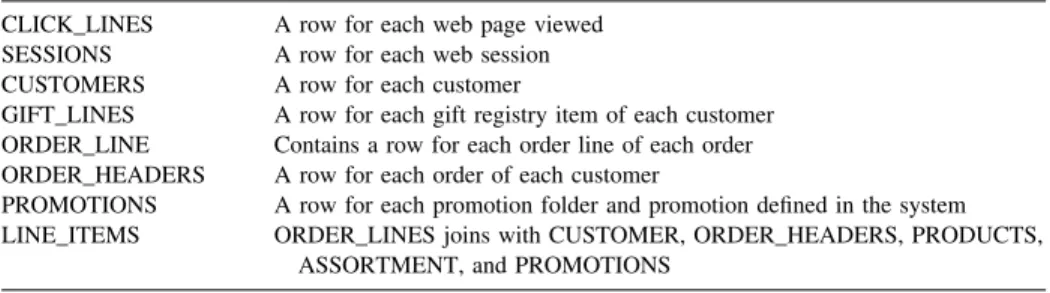
After the data transformations are done, data in the webhouse are organized into different levels. Some of the most useful summary tables and fact tables for web usage mining and reporting are shown in Table IV.
4. PATTERN DISCOVERY: A DATA WAREHOUSE/OLAP
APPROACH
Data warehouse/OLAP is an approach for integrating data mining, data warehousing, and OLAP technologies. OLAP systems precalculate summary in-formation (data cubes) to enable drilling, pivoting, slicing and dicing, and filtering
Table III. Single/multiple visitors/buyers. Type Count Single visit 1823 Multiple visit 37 Single-visit buyer 269 Multiple-visit buyer 58 Unknown 2846 600
to analyze business from multiple angles or views (dimensions). Web mining your site in the webhouse can reveal actionable and meaningful patterns for users and useful click sequences for the web site design.
4.1. Construct Cubes from the Webhouse
A data cube is precalculated summary data organized in a way that the cells of the cube contain measured values and the edges of the cube define the natural dimensions of the data. (The data cube may have more than three dimensions; so, technically, it should be called a hypercube.) The dimensional elements in the cube are organized in a hierarchy and you can roll up and/or drill down the dimension hierarchy to get a different view or understanding about the cube data. A data cube offers the benefits for data analysis such as an immediate response to a business query and the ability to drill down and roll up the multiple dimensional data in the cube to analyze business measures such as profit, revenue, quantity from different angles, perspectives, and various ancillary factors. We can create two cubes from the webhouse as shown in Figure 2, one cube for the clickstream and another cube for the order item based on the fact table clickstream, the ordered item and session, product, user, page, and time dimension table. In the webhouse, we already have data organized based on a multiple-dimensional model. All that is required is to plug into the OLAP software. There are many OLAP tools such as MS OLAP, Cognos, and Essbase to choose from to build large cubes. Cutting and dicing these cubes reveal significant information about your web site and sales situations. For example, we can find out the top pages of the sites, top domains, top browsers, the view time of the top page, top exits page of the site, top referrer of the site, top products by sales and quantity, top referrers by page request, sale, quantity, users, and web site activity based on day, month, or even hours and minutes. We also can find out who our visitors include, how much they spend, the sale cycles, etc.
From the OLAP cubes, many business intelligence reports can be derived. Business reports are the most important tool for business analysts but are unap-preciated by a lot of companies. Business intelligent reports can provide many insightful information about the web store such as sales of products across different refers, best-selling products/bottom products, top domains/bottom domain, top searched keywords, etc.
Table IV. Summary and facts table in the webhouse.
CLICK_LINES A row for each web page viewed SESSIONS A row for each web session CUSTOMERS A row for each customer
GIFT_LINES A row for each gift registry item of each customer ORDER_LINE Contains a row for each order line of each order ORDER_HEADERS A row for each order of each customer
PROMOTIONS A row for each promotion folder and promotion defined in the system LINE_ITEMS ORDER_LINES joins with CUSTOMER, ORDER_HEADERS, PRODUCTS,
4.2. Mining the Webhouse Data
OLAP is a key component of this approach, but OLAP alone is not good enough for e-commerce applications. Some of the challenging issues can not be answered by examining the measured values in the cubes. For example, to answer the question, “Given a set of page views, will the visitor view another page on the site or will the visitor leave,” it is very difficult if not impossible to find a satisfactory answer based on the OLAP cube data from the webhouse. A lot of mining algorithms and methods such as association algorithm, decision tree, neural network, Bayesian algorithm, clustering method, etc. can be applied for web usage mining to derive insightful knowledge rules to understand the business and customers, build prediction models for classification, and generate campaign scores for product promotion. Next, we discuss how these algorithms can help solve some of the challenging problems for the e-commerce.
4.2.1. Association Rules
Initially, association rule algorithms were designed to analyze market basket data to find correlations in items purchased together, e.g., if a customer buys product A, what is the likelihood that he/she will buy product B. In web usage mining, association rule algorithms can be used for two purposes. First, analyzing the online purchase data to determine which products are sold together by online customers (similar to the traditional supermarket basket data analysis). Online shopping databases contain historical data on prior customer choices where each customer has selected a subset of products. This data can be used to generate a dynamic recommendation of new items to a customer who is in the process of making the item choice. Another use of the association rule algorithm is to analyze the page view hits in a session. Web sites also display dynamically changing sets of links to related sites depending on the browsing pattern during a surfing session. Use of the adapted association algorithm can find related pages that often are visited together. The pages may not have hyperlinks between them. As a result of association rule analysis, it is possible to optimize the web site structure and detect drawbacks that had not been obvious in the past. This information may help the web designer to redesign their web site (add direct links between those strong correlated pages); it also may help web servers do per-fetching or precompiling of the web pages (presently, many web sites have dynamic page generation) to reduce the user waiting time. Web sites also display a dynamically changing set of links to related sites depending on the browsing pattern during a surfing session.
However, we feel that the recommendation is inherently a different problem, the main reason for this is that preferences are caused by largely the taste and interest. When a customer surfs the web store, whether purchasing or visiting a web site, not all actions (put items into shopping cart or click through different web pages) are elected because of their association with some previous actions (other items already in the cart or already went through some previous pages).24 We
believe there are two behaviors: renew choice or association choice. Starting from the scratch, some need drives the customer to select the click first page/first item, 602
which is because of some independent need that we call the renewal choice. After the first move, a customer may stop or click another page/select another item by association or by another renewal choice, iteratively. We propose a hybrid ap-proach (statistical association rule apap-proach) to compute the probability of a new move becoming the next choice given the current status and make a recommen-dation list based on a ranking of this probability. What makes this approach different from the usual association rule approaches is that they account not only for the choice making or buying associated with the items present in the shopping cart (associative buying), but also for the fact that a customer exercises an independent choice unrelated to the existing items in the shopping cart (renew buying). We compute the probability of both renewal choice and associative choice given the items in the shopping cart and obtain the probabilities for each item given the partial basket content and obtain the probabilities for each item given one of these two buying modes. The results from this analysis are very useful for promoting cross-selling and up-selling for the online web store. Based on this consideration, we tested on one client’s site and the association rules in Table V reveal that this approach generates more meaningful and actionable associations.
4.2.2. Classification/Prediction
Classification/prediction is a very popular data mining technique used to build a model based on the training data; then, apply the model to assign a new item to a certain class. There are many algorithms such as decision trees, neural networks, Bayesian networks, and probability theory for classification. For example, to understand the customers who spend more than $12 on the web site, you can use decision tree algorithms to build a model, which may reveal such patterns as the customer who spends more than $12 are single women, aged between 25 and 35 years, and make more than $35,000 a year. Another application for classification/ prediction is target-oriented campaign. Mass campaign has a very low response rate, typically 2–3%. In a target-oriented campaign, the company only sends campaign messages to a small portion of customers who are most likely to respond.
Table V. Associations in a beauty-supply web store.
No. of rules Relations Lift Support (%) Confidence (%) Rule
1 2 1.56 1.89 18.58 BloomfDirty_Girl 2 2 1.56 1.89 15.91 Dirty_GirlfBloom 3 2 1.13 1.50 11.52 PhilosophyfBloom 4 2 1.13 1.50 14.75 BloomfPhilosophy 5 2 1.66 1.41 11.87 Dirty_GirlfBlue_Q 6 2 1.66 1.41 19.75 Blue_QfDirty_Girl 7 2 3.12 1.32 18.41 Tony_And_TinafGirl 8 2 1.41 1.32 10.41 PhilosophyfTony_And_Tina 9 2 1.41 1.32 18.41 Tony_And_TinafPhilosophy 10 2 2.96 1.32 18.88 Demeter_FragrancesfSmell_This 11 2 3.12 1.32 22.45 GirlfTony_And_Tina 12 2 2.96 1.32 20.75 Smell_ThisfDemeter_Fragrances
Even though sending e-mails to all online customers is very cheap, it is still important to target e-mail effectively, as suggested by Berry and Linoff, because customers who might read one target e-mail are less likely to read a lot of junk e-mail messages.11,15Another important reason is that if the customers are fed up
with these off-target e-mail messages, they can revoke their permission to be contacted by the web store. To identify who is most likely to respond to your campaign, avoid generating too many off-target e-mails and improve the service equality, we can build a prediction model based on the historical data (which has the responders versus nonresponders in the past campaigns) and then apply the prediction model to the current customers and sort the customer list with a probability score; the top of the sorted list are those customers who are likely to respond the campaign.
4.3.3. Clustering
Clustering techniques are useful when there are no classes to be classified or predicted. Clustering algorithms group a set of objects into different groups based on measures so that the objects in the same group are similar to each other and objects in different groups are different. In web usage mining, clustering algo-rithms can be used in several ways:
(1) Profiling customers based on some features such as purchasing amount, region, and purchased products. For example, we group customers into different groups such as heavy spenders, light spenders, or browsers based on the amount. We can extract similar features from this cluster and find out that heavy spenders are mostly young technical professionals and single men. The results of clustering web data can help online stores to identify proper customer segments with common characteristics and target these segments for campaign e-mail or product promotion and make special offers tailored to their needs and requirements.
(2) Clustering navigational paths of web hits. As shown in Refs. 12 and 25, clustering navigational paths is very important for user segmentation; the result can help the web designer understand or predict visitors’ navigation patterns to make the web site more efficient or more close to the visitors’ preferences. For example, if the clustering results show Page P1, P2, and P3 are in the same cluster, then the web server can prefetch Pages P2 and P3 or precompile Pages P2 and P3 while the user is still viewing Page P1 to reduce the loading time or compile time; that way, it helps reduce the user waiting latency. Another potential use is to find subsets of the users that would benefit from sharing a single web cache rather than using individual ones.
5. PATTERN EVALUATIONS AND DEPLOYMENT
In the data warehouse/OLAP framework, the last step is to evaluate the mining results and then adopt actionable results. After the mining algorithms are applied, many patterns may be identified but not all of them are interesting or actionable. Unlike most of the pattern evaluation approaches, which rely on a structured query language (SQL) statement to query the database and evaluate the results, in our data warehouse/OLAP framework, the data cube is an essential component in the mining procedure and we can dice and roll up the data cube to 604
easily verify mining results. After the mining patterns are verified to be “golden nuggets,” data miners and data analysts can take proper actions based on useful actionable mining results. In traditional data mining applications, it is always challenging or time-consuming to convince the organization to take actions based on the mining results to improve the business. For example, in a brick-and-mortar store, if the data mining results reveal the customers who buy product A tend to buy product B, in order to create the cross-sell opportunity based on this finding, some possible actions are to put products A and B together on the same shelf, physically moving products A and B from different shelves. In a web store, such discovery can be made easily without much cost and hassle. It is very flexible to change the web site design and layout and put relevant product information together to create cross-sell and upper-sell opportunity. Another example is a customer campaign. A lot of companies send marketing campaign information such as catalogs and coupons via snail mail based on data mining prediction models; the whole procedure normally takes a few months and costs millions of dollars, but in a web store, sending campaign e-mails to massive customers is already a key component of the e-commerce system, and target customers based on data mining findings via e-mail to promote products is easy to implement and these data mining findings can quickly bring more revenues to the web store.
6. CONCLUSION
The e-commerce web store provides a killer domain for data mining application. In this study, we have proposed a framework for web usage mining and business intelligence reporting. We address some of the key problems and issues in the web usage mining application. We use the web application server to collect all the relevant data (clickstream, transaction, and customer infor-mation) for analysis and provide a unified database schema for difference data source. The construction of the webhouse is an integral part of our framework, which provides an integrated environment for data collection and data trans-formation. In the framework, we integrate the data warehouse construction, data mining, business intelligence reporting, and pattern deployment into the e-commerce system smoothly. This tight integration significantly reduces the total time and effort to build a data mining system for web usage mining. We provided a general approach and guidelines for online web stores to mine their web data and generate business intelligence reports. We identify some of the challenging problems and pitfalls in each phase and provide possible solutions to them. Our framework focuses on online web stores and some of the ideas have been implemented in some commercial web usage mining systems. We believe this framework can be adapted for application in some other domains such as Business-to-Business.
The framework and ideas presented in this article have been implemented in some commercial web usage mining systems through consulting with some indus-try vendors. There are some other challenging problems in web usage mining such as how to scale the web mining algorithms to handle large amounts of data in the 100G or even terabyte range (some of the large e-commerce sites such as Yahoo
handle 1 billion page views per day). The scalability is crucial for a successful e-commerce system. We hope to report our findings in this research in the near future.
References
1. Hu X, Cercone N. An OLAM approach for Web usage mining. IEEE Fuzzy Syst 2002. 2. Sane Solution. Analyzing Web site traffic. http://www.sane.com/products/NetTracker/
whitepaper.pdf. 2002.
3. Ansari S, Kohavi R, Mason L, Zheng Z. Integrating E-commerce and data mining: Architecture and challenges. In: WebKDD2000 Workshop. Boston, MA, 2000.
4. Berry M, Linoff G. Mastering data mining: The art and science of customer relationship management. New York: John Wiley & Sons, 2000.
5. Accrue Software, Inc. Driving business decision in Web Time. In: Web mining whitepaper [http://accrue.com/forms/webmining.html].
6. Kimball R, Merz R. The data webhouse toolkit: Building the Web-enabled data warehouse. New York: John Wiley & Sons; 2002.
7. Kohavi R. Mining E-commerce data: The good, the bad, and the ugly. In: SIGKDD 2001 Industry track. San Francisco, CA, 2001.
8. Kohavi R, Provost F. Application of data mining to electronic commerce. Data Mining Knowl Discov 2001;5(1):10 –16.
9. Tan P-N, Kumar V. Modeling of Web robot navigational patterns. In: Conf WebKDD, Boston, MA, 2000.
10. Theusinger C, Huber K-P. Analyzing the footsteps of your customers. In: WebKDD Workshop. San Diego, CA, 1999.
11. Catledge L, Pitkow J. Characterizing browsing behaviors on the world wide web. Comput Networks and ISDN Syst 1995;27(6):1065–1073.
12. Domingos P, Hulten G. A general method for scaling up machine learning algorithms and its application to clustering. Prod of the ICML. Williamstown, MA, 2001.
13. Mena J. Beyond the shopping cart. Intell Enterprise 1999;2(1).
14. Srivastava J, Cooley R, Deshpande M, Tan P-N. Web usage mining: discovery and application of usage patterns from Web data. SIGKDD Explor 1(2).
15. Becher J, Kahavi R. Tutorial on E-commerce and clickstream mining. In: 1st SIAM Int Conf on Data Mining. Chicago, IL, 2001.
16. Kdnuggets.com http://www.kdnuggets.com/datasets/kdd-cup-2000.html. 2000.
17. Wolfgang G, Schmidt-Thieme L. Mining web navigation path fragments. In: Conf WebKDD Boston, MA, 2000.
18. Kimball R. The data warehouse toolkit. New York: John Wiley & Sons; 1996. 19. Mena J. Data mining your website. Digital Press; Boston, MA, 1999.
20. Song I, Whang K. Database design for real-world E-commerce systems. IEEE Data Eng Bull 2000;23(1):23–28.
21. Song I, LeVan-Shultz K. Data warehouse design for E-commerce environment. In: WWWCM99. Paris, France.
22. Kimball R. Clicking with your customer. Intell Enterprise 1999;2(1):5–10.
23. Anahory S, Murray D. Data warehousing in the real world. Boston, MA: Addison-Wesley; 1997.
24. Hong SJ, Natarajan R, Belitskaya I. A new approach for item choice recommendation. 25. Kosala R, Blockeel H. Web mining research: A survey. ACM SIGKDD 2002;2(1).