Executive summary.
In a 2010 survey, Vanguard examined the impact
of various leadership styles on investment committee decision-making.
The survey, titled “Investment Committees: The Dynamics of Leadership
Styles,” studied three leadership styles: autocratic, democratic, and
laissez-faire. Respondents were queried on best practices; factors considered
when selecting and evaluating managers; committee attributes, including
the level of expertise; group decision-making behavior; and use of external
consultants.
Surprisingly, the answer to the question, “Does leadership style matter?”
was “not a lot,” according to survey respondents. The vast majority of
investment committees said they had a democratic leadership style,
rather than the outcome we expected—that of a more even distribution
of leadership styles. Most respondents were very satisfied with their
democratic style. However, committee behavior was generally quite
similar, irrespective of leadership style.
Vanguard research June 2011
Does leadership style matter?
Investment committee
decision-making study
Authors Jill Marshall Liqian Ren, Ph.D.
Leadership, the process of inspiring others to work together to achieve a common goal, is an inevitable element of group dynamics. Yet, the relationship between a leader’s participation and his or her effectiveness in accomplishing goals is complex. Leadership style, a term that has been defined in numerous ways, most commonly refers to the characteristic manner in which an individual leads others. Researchers have suggested that a participation theory of leadership (Vroom, 1959), which assumes that a group’s performance depends in part on the extent to which leaders share or retain their decision-making authority, is one way to begin to assess leadership effec-tiveness. Early conceptualizations categorized leadership styles as autocratic, democratic, or laissez-faire (White and Lippitt, 1960). Assessing leadership styles is challenging. We know that leaders influence their groups, but the question remains of why some groups prosper when guided by good leaders (Bass, 1990). Vanguard decided to explore this question by examining whether leadership style can dramatically alter the effectiveness of investment committee decision-making. In 2010, we conducted a survey—
titled “Investment Committees: The Dynamics of Leadership Styles”—to determine the effects of a leader’s participation in decision-making. We received 213 responses, from a range of client types (defined benefit [DB], 40; defined contribution [DC], 71; and endowment and foundations [E&F], 102) and portfolio asset levels (the largest asset level being $250 million). (See the appendix for further details on the survey sample.)
Leadership style: ‘Democratic’ most prevalent
Vanguard’s survey asked respondents to characterize their leadership climate as autocratic, democratic, or laissez-faire; hereafter, their responses are referred to as the “stated” leadership style. We then asked respondents which style they would have preferred, if given the choice. We also asked several “derived” (i.e., with embedded assumptions) leadership style questions to verify the authenticity of the stated leadership style (discussed more in next section). The shaded text box on page 3 provides an overview of the three leadership styles and also shows the breakdown of the 213 responding committees by “stated” and “preferred” types.
Results of this survey reinforce the presumption that there will always be powerful situational
determinants that drive leadership effectiveness. This reality should serve as a reminder to all
investment committee leaders to focus on what they
can
control. We suggest that a good
place to begin is with Vanguard’s view of investment committee best practices (Gordon and
LaBarge, 2010); namely: have a clear understanding of the portfolio’s purpose; create a
charter that outlines members’ responsibilities; adopt a clear investment strategy; and follow
a straightforward process for hiring and terminating managers. Encouraging healthy debate
and avoiding common behavioral biases within group decision-making can also do more to
pave the way for long-term success than focusing on uncontrollable factors such as
short-term performance.
Source: Vanguard. Autocratic
Leader seeks to have the most authority and control in decision-making. Leader seeks to retain responsibility rather than use complete delegation.
Democratic
Leader seeks consultation and welcomes feedback on all major issues and decisions. Leader effectively assigns tasks to commit-tee members and gives them full control and responsibility.
Laissez-faire (hands-off)
Leader provides minimal direction. All authority is given to committee members, and they must determine goals, make decisions, and resolve problems on their own.
Stated autocratic 12 survey respondents (6%) Stated democratic 171 survey respondents (80%) Stated laissez-faire 30 survey respondents (14%)
In Vanguard’s ‘Leadership Styles’ survey, investment committees were given the
following definitions of three leadership styles.
Respondents were asked to characterize their current leadership climate (”stated”)
and were then asked which style they would have preferred:
Autocratic Democratic Laissez-faire
Some potential advantages and disadvantages of each leadership style:
Identifying the style of committee leadership
Potential advantages
• Faster decision-making. • Increased productivity. • Reduced stress, because of
increased control. Potential disadvantages
• Deskilled, demotivated, and less
confident group.
• Micro-management.
• Less-creative decision-making.
• Creative thinking. • Fewer grave mistakes. • Cohesive team.
• Lengthy decision-making.
• Certain individuals may dominate.
• Creative thinking. • Flexibility. • Originality.
• Allows for an emergent leader.
• Frustration.
• Poor quality of outcomes. • Disorganization.
• Limited personal growth.
Autocratic Democratic Laissez-faire
By far the most common “stated” leadership style was democratic (80%), followed by laissez-faire (14%) and autocratic (6%), with responses showing little difference by client type (DB, DC, or E&F). The data for preferred styles showed a more revealing story, however. The majority of committees, no matter which stated leadership style, would have preferred a democratic leadership style (see blue boxes on page 3).
A closer look at the laissez-faire committees preferring democratic leadership revealed that this group did have a worse impression of their committees’ behavior. For instance, as discussed later in this paper, respondents reported using fewer investment committee best practices as identified in the survey; at the same time, they perceived group behavioral bias to be higher. These findings were revealing, since a primary function of a committee leader is to ensure that the decision-making
processes are outlined and that rules are established and enforced. Therefore, leaders—particularly those that are “hands-off”—should be aware that a lack of structure can actually be disruptive. (Note that these results should be interpreted with caution, given the small sample sizes of the autocratic and laissez-faire committees in the survey.)
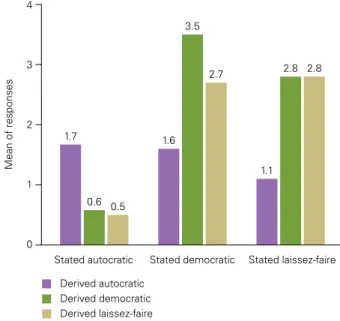
As described earlier, to check the legitimacy of the stated leadership style, we queried respondents about their leader’s behavior. As expected, within each style the answers to the derived questions were closely aligned with the stated style, no matter whether the respondent was the chairperson or a committee member. Figure 1 highlights this, as shown by the fact that the derived mean leadership style bars were generally highest within each stated style. The results were statistically significant for the stated democratic responses. For example, the derived democratic mean was 3.5 for respondents who stated they were democratic, compared with the derived autocratic mean of 1.7 and derived laissez-faire mean of 2.8.
The laissez-faire derived leadership style was less clear. Respondents who indicated that their stated leadership style was laissez-faire gave the same answers for the derived laissez-faire and democratic questions (see Figure 1). This could indicate that the leadership style of the stated laissez-faire
Figure 1. Respondents’ ‘stated’ and ‘derived’ leadership styles were closely aligned The survey asked respondents how often the committee leader displayed a series of behaviors. We assigned 1 point for an “often or always” response; 0 points for “occasionally”; and –1 for “seldom or never.” We totaled the points for each leadership style (for a maximum of 4 points per style) per respondent. The average mean for each derived style is represented by the height of the bars; the higher the bar, the higher the relation-ship between stated and derived styles.
Derived autocratic Derived democratic Derived laissez-faire 0 1 2 3 4 Stated laissez-faire Stated democratic Stated autocratic 1.7 0.6 0.5 1.1 2.8 2.8 1.6 3.5 2.7 Mean of responses
Notes: An example of a derived “autocratic” description posed to respondents was “closely monitors member’s participation.” A derived “democratic” description was “seeks to create an environment where the members take ownership of an issue.” A derived “laissez-faire” description was “allows members to determine what needs to be done and how to do it.”
respondents was actually more democratic than they believed. Finally, the derived autocratic mean of the stated autocratic groups was low (see the figure), suggesting that respondents answered “occasionally” or “seldom or never” to the autocratic derived question. It is also noteworthy for this group that the derived democratic and laissez-faire means were low, suggesting that the leaders may use a mixture of leadership styles.
In groups, there can either be designated or emergent leaders. When there is no designated leader, an opportunity can present itself for a natural leader to emerge. Research has shown that there is more “leadership behavior” when there is a designated leader as opposed to an emergent leader (Borg, 1957). In our survey, 87% of committees polled had a designated leader. As expected, the greater the leader’s level of participation, the more likely it was that there was a designated leader. All of the autocratic leadership styles had a designated leader, compared with 88% of the democratic styles and 73% of the laissez-faire leadership structures. We also found that E&F clients had the most designated leaders (95%), compared with DB (83%) and DC (77%). The higher rate of designated E&F leaders could relate to the fact that 95% were also volunteers.
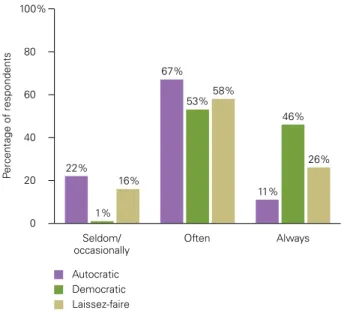
In our survey, the stated designated democratic leaders received statistically significant higher rates of satisfaction from committee members (see Figure 2): 99% of democratic committees reported being “often or always” satisfied, compared with laissez-faire (84%) and autocratic (78%) styles.
The next three sections of this paper—addressing best practices, selection and evaluation of managers, and group decision-making, respectively—point to the fact that leaders of investment committees can achieve similar results no matter the level of participation in committee processes. Surprisingly, whether a leader employed an autocratic, democratic, or laissez-faire style did not significantly alter
the results.
To what degree are members satisfied with the leader’s performance?
Source: Vanguard.
Figure 2. Satisfaction ratings of stated leadership style by committee member respondents
0 20 40 60 80 100% Percent age of respondents Seldom/
occasionally Often Always Autocratic Democratic Laissez-faire 22% 1% 16% 67% 53%58% 11% 46% 26%
Investment committee best practices We recommend that by following a series of Vanguard best practices, investment committees can improve their productivity and effectiveness. We surveyed respondents on how frequently they adhered to certain best practices and found that the results did not vary significantly by leadership style or portfolio asset size. Also, best practices were used most of the time. For instance, more than 90% of the time, on average, committees reviewed the asset allocation at least annually, followed proper documentation procedures, conducted regular meetings, and used processes that were in line with their policy statements. Two areas of opportunity for improvement included encouraging continuing education relevant to investments (respondents reported engaging in this activity just 35% of the time, on average) and regularly assessing fees (reportedly done 77% of the time) (see Figure 3).
The one area in which there was statistical significance across leadership styles pertained to reviewing the asset allocation. Just 76% of committees with a laissez-faire leadership style “always” reviewed the asset allocations, compared with 92% for committees with a democratic style. Selecting and evaluating a fund manager Investment committees tend to hire at least one outside advisor to manage their assets, with a majority hiring multiple managers. In our survey, the average number of managers per investment committee was ten. We asked respondents to rank the following seven factors in order of importance: integrity of the firm, portfolio performance, depth and skill of managers, investment philosophy, portfolio construction consistency/conviction, investment process, and cost (see Figure 4). Generally, there was little difference in respondents’ ranking of criteria when comparing leadership style, client type, or whether the respondent was a chairperson or member.
Figure 3. Percentage of respondents whose committees used best practices
Often Always
97% Encourages additional education or training for members on relevant
investment topics Regularly assesses whether portfolio fees are reasonable relative to performance expectations Reviews the investment policy statement at least annually Assesses portfolio risk at least annually Ensures that the process used to operate the portfolio conforms to committee documents such as the investment policy statement Conducts regular meetings on all aspects of the portfolio, both administrative and investment-related Documents meeting minutes, attendance, member contributions, reasons for manager changes Reviews asset allocation at least annually
92% 91% 90% 88% 82% 77% 35% Source: Vanguard.
The survey’s results reinforced that there is an opportunity to educate investment committees on the importance of reducing costs and the ineffective reliance on past performance when evaluating managers. On average, as Figure 4 shows, just 2% of respondents ranked cost as the most important criterion, and 15% ranked it as second. In particular, DC clients (22%) placed more emphasis on cost (ranking it first or second) than DB (12%) or E&F (14%) clients. Over time, in Vanguard’s view, the inability to control manager fees and expenses can impair a committee’s, or participant’s, ability to meet a portfolio’s goals.
Our survey results differed slightly from those of a previous Vanguard survey that evaluated managers, in which performance was rated first out of five key factors influencing investment manager turnover (e.g., LaBarge, 2010). In the LaBarge study, cost was rated the third most important factor. Surprisingly, in our survey, respondents reported that fees were a relatively less important factor (see Figure 4).
Of note, the level of expertise of the leader (Figure 5) did affect respondents’ ranking of criteria for evaluating/selecting managers. In particular, a lower level of expertise in all of the fields—whether investment, finance, or business—meant that performance was rated more important. On the other hand, higher levels of a particular type of experience did affect which factor was dominantly ranked. For example, higher investment experience correlated with greater emphasis on the depth and skill of the managers, but less focus on a firm’s integrity. Higher general finance experience ranked investment philosophy higher, but cost became less so. More general business experience was aligned with more importance given to the firm’s integrity, but less emphasis on the investment process.
Figure 4. Respondents’ ranking of criteria for selecting/evaluating manager(s) Percentage ranked first and second in importance
33% Cost
Note: Some percentages may not sum to 100 because of rounding. Source: Vanguard.
Investment process Portfolio construction consistency/conviction Investment philosophy Depth and skill of manager(s) Performance Integrity of the firm
First Second 12% 25% 18% 16% 23% 11% 17% 8% 7% 4% 8% 2% 15%
Leaders’ level of expertise
Figure 5. Committee leaders’ reported level of expertise 0 20 40 60 80 100% 5% High Medium None/low 22% 72% 52% 35% 12% 32% 15% 53% Investment
experience experienceFinance experienceBusiness
Note: Some percentages may not sum to 100 because of rounding. Source: Vanguard.
Group decision-making behavior
Groups, by their nature, make decisions that are susceptible to behavioral and psychological biases. These biases can undermine their decisions and have negative consequences for committees (Mottola and Utkus, 2009). Conventional wisdom might suggest that when members are more satisfied with the leadership, their committees may exhibit less bias. This was not the case with our survey results, however. Although we found that democratic leaders enjoyed higher levels of satisfaction, there was not a statistically significant relationship between this leadership style and a lower level of bias in group decision-making.1
Our results indicated that the level of bias was generally low (see Figure 6), as was the case in Vanguard’s previous research (Stockton, 2009). To gauge the level of bias—such as overconfidence or group think—we asked survey participants to respond to several statements (see the figure). The greatest amount of reported bias was that of “shared-information bias” (the tendency to discuss only the information currently available to the team), at 30%. Of particular interest was the difference in the level of bias reported by the chairperson versus committee members. In all cases, members reported approximately 10% more bias occurring “often or always.” Aside from querying about bias, we also asked if the leader inspired extra effort among members. This was the only area in which leaders indicated the performance occurred more frequently than did members; chairpersons reported that the leader “often or always” (53%) inspired extra effort, compared with 39% for members.
The level of assets had a significant impact on the amount of social loafing. For committees with more than $250 million in assets, more social loafing was reported (24% reporting “often or always”), compared with committees with less than $50 million (just 10% reporting social loafing “often or always”).
Figure 6. Group decision-making
Notes: To gauge the degree of bias, we asked survey participants to respond to several statements:
1. There is a tendency to develop unduly optimistic forecasts of the future. (Indicator of overconfidence bias.)
2. Members are more interested in avoiding conflict and maintaining unanimity than realistically appraising the various courses of action. (Group think.) 3. There is a tendency for a group to acquire information that confirms the group’s views and to disregard information that conflicts with the group’s views. (Confirmation bias.)
4. The committee contains members who do not make meaningful contributions. (Social loafing.)
5. There is a tendency to discuss only the information that is available to all of the group’s members before discussion. (Shared-information bias.)
Source: Vanguard. Overconfidence 30% Group think Confirmation bias Social loafing Shared-information bias 16% 10% 10% 6%
Use of external consultants
Consultants can be a key source of information for investment committees focused on portfolio construction, investment management, research, fiduciary and compliance matters, and data analysis. In this study, nearly 80%2 of the investment committees surveyed employed an external consultant, and 41% of those indicated that the consultant had a high degree of involvement (see Figure 7). We did find that consultant use was dependent upon the leadership style and asset size, but that it did not vary by client type. Surprisingly, consultant use did not dramatically affect the degree to which best practices were followed.
Committees with democratic and laissez-faire leadership styles were more inclined to hire a consultant (80% and 77%, respectively), versus 50% of committees with autocratic leadership styles.
Figure 7. Respondents’ use of external consultants and their involvement level
Source: Vanguard.
Level of involvement Use of external consultants
41% 25% 8% 4% High Medium Low None 78% 22% Yes No
Caution should be used in drawing conclusions, however, given both the small number of aggregate autocratic respondents (12) and all respondents’ subjective interpretation of low, medium, and high levels of involvement (see Figure 7). Not surprisingly, committees with less than $50 million in assets were less likely to employ a consultant (69%).
Conclusions
Conventional wisdom suggests that leadership style could dramatically alter the effectiveness of investment committee decision-making. Our research found otherwise, reinforcing the presumption that the leader, the committee members, and the group situation are all important considerations. Conse-quently, we suggest that most successful leaders are able to adjust their behavior as circumstances dictate to effect positive outcomes.
We did find that a democratic leadership style was the most popular and successful of the three types, if measured by satisfaction of the committee members. However, there was little indication that committees with democratic leaders achieved increased productivity or superior behavior among their members. We do caution committees with laissez-faire leaders to remain aware of the risk that a lack of structure can actually be disruptive. We found that failure of a leader to fulfill his or her roles and responsibilities was likely to undermine the committee’s confidence and ability to make decisions. Finally, we recommend that investment committees remain focused on addressing concerns within their control, such as implementing best practices for investment committees, promoting a cohesive and unified team, determining specific roles and responsi-bilities for members, adhering to the agreed-upon decision-making process, and regularly assessing fees.
2 See also Vanguard research by Stockton (2009), who reported that many institutions hire consultants to assist with investment decisions: 81% of respondents for nonprofits, 75% of respondents for defined benefit, and 51% for defined contribution reported using an external consultant.
References
Bass, Bernard M., 1990. From Transactional to Transformational Leadership: Learning to Share the Vision. Organizational Dynamics 19(3): 19–32. Borg, Walter R., 1957. The Behavior of Emergent and Designated Leaders in Situational Tests. Sociometry (American Sociological Association) 20(2, June): 95–104.
Forsyth, Donelson R., 1999. Group Dynamics. Belmont, Calif.: Wadsworth Publishing Co.
Gordon, Catherine D., and Karin Peterson LaBarge, 2010. Investment Committees: Vanguard’s View of Best Practices. Valley Forge, Pa.:
The Vanguard Group.
LaBarge, Karin Peterson, 2010. What Matters Most? An Analysis of Hire/Fire Decisions. Valley Forge, Pa.: The Vanguard Group.
Lewin, K., R. Lippitt, and R.K. White. 1939. Patterns of Aggressive Behavior in Experimentally Created Social Climates. Journal of Social Psychology 10: 271–301.
Moore, Lori L., and Rick D. Rudd, 2006. Leadership Styles of Current Extension Leaders. Journal of Agricultural Education 47(1): 6–7. Mottola, Gary, and Stephen P. Utkus, 2009.
Group Decision-Making: Implications for Investment Committees. Valley Forge, Pa.: The Vanguard Group. Stockton, Kimberly A., 2009. Investment
Committee Decision-Maker Study. Valley Forge, Pa.: The Vanguard Group. Vroom, Victor H., 1959. Some Personality Determinants of the Effects of Participation. Journal of Abnormal and Social Psychology 59(3, Nov.): 322–27.
White, R.K., and R. Lippitt, 1960. Autocracy and Democracy: An Experimental Inquiry. New York: Harper & Row.
Percentage of respondents, by client type and size of portfolio assets
$50M–
Client type <$50M $250M >$250M Total
DB 10% 38% 52% 100%
DC 27 38 35 100
E&F 54 29 17 100
Total 37 34 29 100
Note: M = million.
Number of committee members reported by respondents
0–5 46%
6–10 49
11–15 5
Tenure of respondents on the investment committee
0–1 year 3% 2–3 years 22 4–5 years 18 5+ years 57 Age of respondents 40 years or less 7% 41–50 years 27 51–60 years 39 61+ years 27
Respondents’ role on the committee
Chairperson 24%
Member 76
Responses to the question
“Is the committee leader volunteering?”
Yes 79%
No 21
Method of choosing committee leader
Selected by senior management 44%
Elected by other committee members 30
Other 26
Portfolio composition
Active 60%
Index 31
Alternatives (private equity,
hedge funds, commodities) 9
Vanguard research >
Vanguard Center for Retirement Research Vanguard Investment Counseling & Research Vanguard Investment Strategy Group
E-mail> research@vanguard.com
P.O. Box 2600
Valley Forge, PA 19482-2600