7 Page 7-23 © MAT Journals 2016. All Rights Reserved
Analysis of Process Parameters in Wire EDM with NITINOL
Shape Memory Alloy using Multi Objective Grey Relational
Grade
Mr.P.A.Phadtare
PG Student
Dept. of Mechanical Engineering,
D.K.T.E.’S Textile and Engineering institute, Ichalkaranji, Shivaji University, Kolhapur, India
Prof .G.S.Joshi Professor
Mechanical Engineering, Dept,
D.K.T.E.’S Textile and Engineering institute, Ichalkaranji, Kolhapur,India.
Prof. (Dr) V.R.Naik
Professor
Mechanical Engineering, Dept,
D.K.T.E.’S Textile and Engineering institute, Ichalkaranji, Kolhapur,India
Email id:[email protected]
Abstract
The position of traditional machining process are taken by non-traditional machining processes because of increasing demands of high surface finish and machining of complex shape geometries,. Wire EDM is one of the non-traditional machining processes. Surface roughness and material removal rate are of most importance in the field of machining processes. This paper gives brief description of the Grey relational theory and Taguchi optimization technique, in order to optimize the cutting parameters in Wire EDM for NITINOL shape memory alloy. The objective of optimization is to attain the minimum surface roughness and the best surface quality along with that higher material removal rate. In this present study NITINOL shape memory alloy is used as a work piece, brass wire of 0.25mm
8 Page 7-23 © MAT Journals 2016. All Rights Reserved
diameter used as a tool, orthogonal array has been used. The input parameters selected for optimization Peak current, pulse on time, pulse off time, wire feed, and wire tension,also other parameter are kept constant. For each experiment material removal rate and surface roughness was determined. With the help of multi objective optimization technique grey relational theory, the optimal value is obtained for material removal rate and surface roughness and by using Taguchi optimization technique. Additionally, the analysis of variance (ANOVA) is used for identifying the most affecting parameter factor.
Keywords: WEDM, Material Removal Rate, Surface Roughness,Micro Hardness. Grey Relational Theory, Taguchi, Analysis of Variance (ANOVA)
INTRODUCTION
In the last decade, smart structural or intelligent materials have great interest due
to their potential scientific and
technological importance. A material which has built-in or intrinsic sensor, actuator, and control mechanism whereby it is capable of sensing an external stimuli, such as electric or magnetic fields, pH, stress, moisture, temperature, responding to it in a predictable or controllable manner, in an appropriate time and reverting to its original state as soon as the stimuli are removed is known as “smart material”. There are Varieties of smart materials already exist in nature and being researched extensively. These included
materials are SMAs, piezoelectric
materials, magnetostrictive materials,
electrostrictive materials and pH-sensitive polymers. Each individual type of smart material has exhibits the one or more
properties such as temperature, shape, stiffness, viscosity, and volume that can be significantly altered. Due to their unique ability to respond to stimuli, they are being used in various applications in the field of sensors and actuators. Among them, SMAs have been widely used as smart and functional materials because of their unique properties of high damping capacity, high energy to weight proportion, shape memory impact (SME), great
compound resistance, pseudoelasticity
(superelasticity) and biocompatibility.
Nickel-Titanium (NiTi) is the most widely used and commercially available SMA for both passive and active applications due to its superior mechanical and shape-memory properties [1].
The unique shape memory behavior was firstly observed in Au-Cd alloy by Chang and Read in1951, while pseudoelasticity
9 Page 7-23 © MAT Journals 2016. All Rights Reserved
had been seen in this alloy by Olan-der in 1932. In the early 1960s, Buehler and co-workers discovered the shape memory effect in an equiatomic alloy of nickel and titanium (NiTi) named as Nitinol, which is considered a breakthrough for engineering applications of shape memory materials. The expression "NITINOL" was authored from its sythesis and its place of
disclosure: (Nickel-Titanium-Naval
Ordnance Laboratory). Till date the Nitinol has been the amalgam indicating unrivaled shape memory attributes among all SMAs. NiTi can display in two
distinctive temperature-subordinate
precious stone structures (stages) called
martensite (lower temperature) and
austenite (higher temperature or guardian stage). Subsequently, Nitinol is presently generally utilized as a part of biomedical gadgets, for example, curve wires and guide wires,endovascular stents, dental files, vena cava filters etc. [2].
Fig1: Phase Transformation
The stage change in the middle of the austenite stage and the martensite period of SMAs is delegated a first-arrange stage change. Austenite to martensite stage
changes in SMAs are additionally
dispersion less and reversible. Because of its capacity in experiencing reversible
first-arrange stage change, SMAs
comprises fascinating practices, for
example, superelasticity or
pseudoelasticity by change, and the shape-memory impact [3].
EXPERIMENTAL PROCEDURE: Materials And Methods
Material employed in this study was NITINOL Shape Memory Alloy. It is an alloy of Ni and Ti and well known for high hardness and toughness. As received NITINOL bar has length 500 mm and
diameter 4 mm respectively. Each
specimen was wire-EDMed along its length into 5mm shown in Figure 2.
10 Page 7-23 © MAT Journals 2016. All Rights Reserved
The wire-EDM machine used in this study was ELEKTRA SUPERCUT 734SERIES 2000 with the wire electrode made from brass. The wire was 0.25mm in diameter and the wire is kept in tension using a mechanical tensioning device reducing the
tendency of producing inaccurate parts [4]
.At the experimentation before sample was fixed to machine the initial weight of the sample is measured with the help of weight measurement instrument.Then the sample was fixed with the table of machine and precaution was kept that the sample remaining perpendicular to the cutting wire as shown in Figure 1. Then machine run as per given program and input parameters are given to machine and other parameters are kept constant. After machining, the specimen was collected and the weight of sample was measured with the help of weighing machine then recorded the weight and time required to cut the sample which is helpful to calculating the material removal rate. Similarly 27 trialswere done and sample was numbered as per the trial number. The surface roughness of the EDMed surface along the cutting direction was taken and note down the readings. The surface finish parameter employed to indicate the surface quality in this experiment was the arithmetic mean roughness (Ra). The surftest has a resolution varying from 0.01
μm to 0.4 μm depending on the measurement range. The Cut off length is 0.25, Evaluation length is 1.75and Stylus speed is 0.25mm/sec etc. Figure 3 shows experimental set up.
Fig3: Experimental set up
EXPERIMENTAL DESIGN:
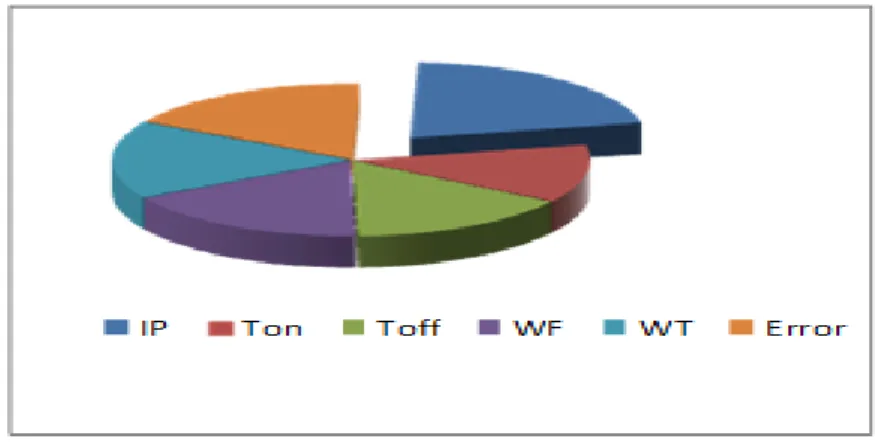
The analysis performed in this study was a screening test. In this test, there were five controlled variables examined including Peak current (IP), Pulse-on time (Ton), Pulse-off time (Toff), Wire bolster (WF) and wire pressure (WT). Three levels of every variable were chosen appeared in Table 1. The base number of trials is discovering by taking after recipe.
Where, F is the input factors, l is the number of levels
So, for more accurate results L27 array will be selected.
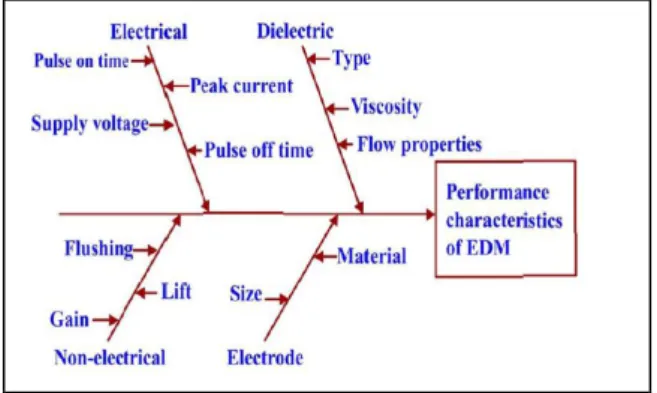
11 Page 7-23 © MAT Journals 2016. All Rights Reserved Fig 4: Ishikawa cause and effect diagram
for EDM
Table 1: Experimental levels Control factor Level 1 Level 2 Level 3 Unit Peak current 30 60 90 Ampere Pulse on time 110 120 130 Machine unit Pulse off time 40 50 60 Machine unit
Wire feed 4 8 12 m / min
Wire
tension 4 8 12 Kg-f
TAGUCHI OPTIMIZATION
METHOD:
Taguchi design of experiment is a powerful analysis tool for modeling and analyzing the influence of control factors
on performance output [5] .Optimization of
process parameters is the key step in the Taguchi method to achieve high quality
without increasing cost. However,
originally Taguchi method was designed to
optimize single performance
characteristics. According to Taguchi
method, the S/N ratio is the ratio of Signal to Noise, where signal represents the desirable value and noise represents the undesirable value. Which is used to calculate the Signal to Noise Ratio (S/N) using the Eq.1. The experimental results are now transformed into a signal-to-noise (S/N) ratio. Lower amount of surface roughness show the high productivity of Wire EDM. Therefore, Smaller the Better are applied to calculate the S/N ratio of
surface roughness respectively [6]. So,
Smaller the Better characteristic is used for S/N ratio calculation. The optimal setting would be the one which could achieve lowest S/N ratio. The S/N Ratio for the experiments conducted is shown in Table 2
Higher machine feed rate gives higher
value of MRR and vice versa.
Theoretically, material erosion is
influenced by the spark energy. As feed rate increase, MRR also increases till it
reaches optimum [7]. Material removal
process in WEDM is the result of spark erosion by transformation of electrical energy to thermal energy as the wire electrode is fed through the workpiece. Larger amount of Material removal rate show the high productivity of Wire EDM. Therefore, Higher the Better are applied to calculate the S/N ratio of Material removal
12 Page 7-23 © MAT Journals 2016. All Rights Reserved
rate respectively. So, Higher the Better characteristic is used for S/N ratio calculation. The S/N Ratio for the experiments conducted is shown in Table 3
It was found that the machining
parameters, for example, the beat on/off term, crest present, open circuit voltage,
servo reference voltage, electrical
capacitance and table pace are the basic parameters for the estimation of the material evacuation rate (MRR) and surface unpleasantness (Ra) . For the ideal choice of procedure parameters, the Taguchi strategy has been widely utilized as a part of assembling keeping in mind the end goal to enhance forms with single execution attributes [8].
In the Taguchi analysis, the raw data than be transformed into S/N ratio values. The criteria for the surface roughness is
“Smaller the Better” while for the material removal rate is “Higher the Better” which
can be expressed as below [8, 10].
S/NLB yi) (1)
Where, S/NLB is Signal to noise ratio, yi is
output characteristic (Surface Roughness (Ra)
S/NHB= yi) (2)
Where, S/NHB is Signal to noise ratio, yiis
output characteristic (Material Removal Rate (MRR))
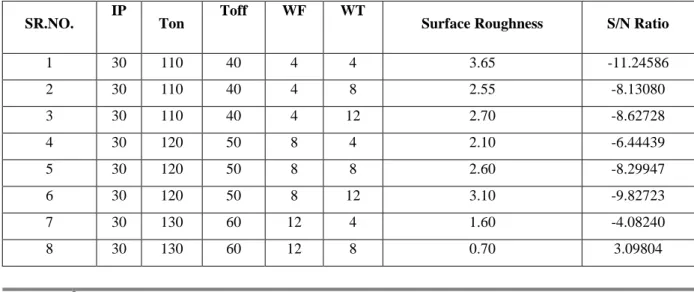
Signal To Noise Ratio Calculation For Surface Roughness:
S/NLB yi2)
S/NLB )
S/NLB
Table 2:Signal to noise ratio calculation for Surface Roughness
SR.NO. IP Ton Toff WF WT Surface Roughness S/N Ratio
1 30 110 40 4 4 3.65 -11.24586 2 30 110 40 4 8 2.55 -8.13080 3 30 110 40 4 12 2.70 -8.62728 4 30 120 50 8 4 2.10 -6.44439 5 30 120 50 8 8 2.60 -8.29947 6 30 120 50 8 12 3.10 -9.82723 7 30 130 60 12 4 1.60 -4.08240 8 30 130 60 12 8 0.70 3.09804
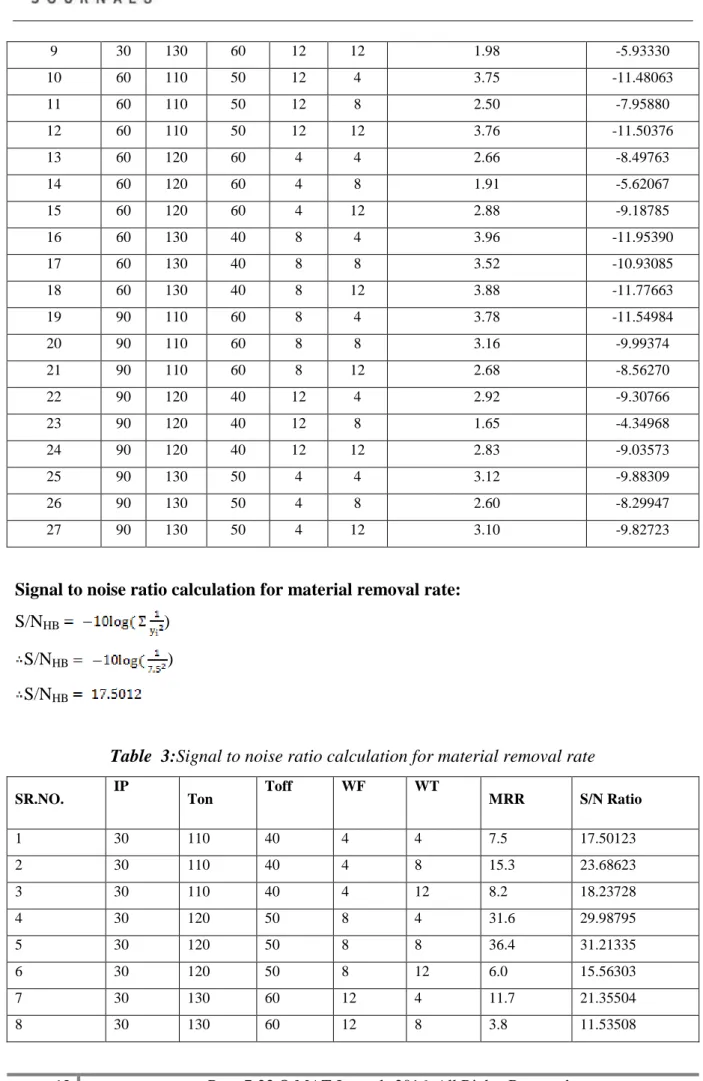
13 Page 7-23 © MAT Journals 2016. All Rights Reserved 9 30 130 60 12 12 1.98 -5.93330 10 60 110 50 12 4 3.75 -11.48063 11 60 110 50 12 8 2.50 -7.95880 12 60 110 50 12 12 3.76 -11.50376 13 60 120 60 4 4 2.66 -8.49763 14 60 120 60 4 8 1.91 -5.62067 15 60 120 60 4 12 2.88 -9.18785 16 60 130 40 8 4 3.96 -11.95390 17 60 130 40 8 8 3.52 -10.93085 18 60 130 40 8 12 3.88 -11.77663 19 90 110 60 8 4 3.78 -11.54984 20 90 110 60 8 8 3.16 -9.99374 21 90 110 60 8 12 2.68 -8.56270 22 90 120 40 12 4 2.92 -9.30766 23 90 120 40 12 8 1.65 -4.34968 24 90 120 40 12 12 2.83 -9.03573 25 90 130 50 4 4 3.12 -9.88309 26 90 130 50 4 8 2.60 -8.29947 27 90 130 50 4 12 3.10 -9.82723
Signal to noise ratio calculation for material removal rate:
S/NHB )
S/NHB )
S/NHB
Table 3:Signal to noise ratio calculation for material removal rate
SR.NO. IP Ton Toff WF WT MRR S/N Ratio
1 30 110 40 4 4 7.5 17.50123 2 30 110 40 4 8 15.3 23.68623 3 30 110 40 4 12 8.2 18.23728 4 30 120 50 8 4 31.6 29.98795 5 30 120 50 8 8 36.4 31.21335 6 30 120 50 8 12 6.0 15.56303 7 30 130 60 12 4 11.7 21.35504 8 30 130 60 12 8 3.8 11.53508
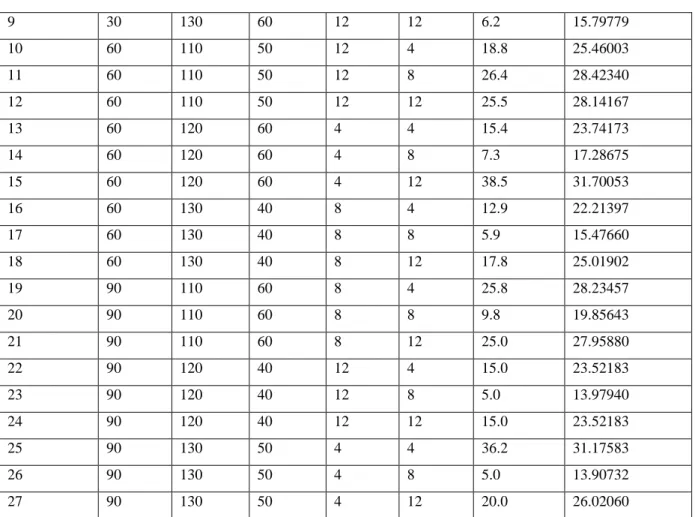
14 Page 7-23 © MAT Journals 2016. All Rights Reserved 9 30 130 60 12 12 6.2 15.79779 10 60 110 50 12 4 18.8 25.46003 11 60 110 50 12 8 26.4 28.42340 12 60 110 50 12 12 25.5 28.14167 13 60 120 60 4 4 15.4 23.74173 14 60 120 60 4 8 7.3 17.28675 15 60 120 60 4 12 38.5 31.70053 16 60 130 40 8 4 12.9 22.21397 17 60 130 40 8 8 5.9 15.47660 18 60 130 40 8 12 17.8 25.01902 19 90 110 60 8 4 25.8 28.23457 20 90 110 60 8 8 9.8 19.85643 21 90 110 60 8 12 25.0 27.95880 22 90 120 40 12 4 15.0 23.52183 23 90 120 40 12 8 5.0 13.97940 24 90 120 40 12 12 15.0 23.52183 25 90 130 50 4 4 36.2 31.17583 26 90 130 50 4 8 5.0 13.90732 27 90 130 50 4 12 20.0 26.02060 ANALYSIS OF VARIANCE
Relative impact of every element is controlled by examination of difference
strategy (ANOVA) and results are
introduced in Table 4 and 5. ANOVA comes about demonstrate that surface
unpleasantness and MRR generally
influenced by which parameters. It is important to say that certainty level of 95% is utilized for analysispurpose, so p-esteem under 0.05 will build up the hugeness of element.
Table 4: Analysis of Variance for SR, using Adjusted SS for Tests
Source DO F Seq. SS Adj. SS Adj. M S F- value P- value
IP 2 3.4802 3.4802 1.7401 9.87 0.002 Ton 2 2.0154 2.0154 1.0077 5.72 0.013 Toff 2 2.5465 2.5465 1.2732 7.23 0.006 WF 2 2.7930 2.7930 1.3965 7.92 0.004 WT 2 2.7199 2.7199 1.3600 7.27 0.005 Error 16 2.8195 2.8195 0.1762 - - Total 26 16.3745
15 Page 7-23 © MAT Journals 2016. All Rights Reserved Fig 5: % Contribution of factors for surface roughness
Where, DOF= Degree of Freedom, Seq. SS =Seq. Sum of Square, Adj. SS = Adj. Sum of
Square,Adj. M S= Adj. Mean of Square
Table 5:Analysis of Variance for MRR, using Adjusted SS for Tests
Source DO F Seq. SS Adj. SS Adj. M S F- value P- value
IP 2 104.3 104.3 52.1 0.48 0.626 Ton 2 165.1 165.1 82.6 0.76 0.482 Toff 2 599.7 599.7 299.8 2.78 0.092 WF 2 108.6 108.6 54.3 0.50 0.614 WT 2 222.0 222.0 111.0 1.03 0.380 Error 16 1727.0 1727.0 107.9 - - Total 26 2926.6
Where, DOF= Degree of Freedom, Seq. SS =Seq. Sum of Square, Adj. SS = Adj. Sum of
Square,Adj. M S= Adj. Mean of Square
Fig 6:% Contribution of factors for material removal rate
MULTI RESPONSE PARAMETRIC OPTIMIZATION
In many cases process parameters cannot be set only for one response, as the objective would be minimizing some response and maximize some response simultaneously. Hence there is need for a multi objective optimization.
16 Page 7-23 © MAT Journals 2016. All Rights Reserved
Gray Relation Analysis
The Gray social investigation is a technique for measuring the level of guess among the groupings utilizing a Gray social evaluation. It is another strategy for performing forecast, social examination, and basic leadership in numerous areas[9]. Be that as it may, conventional Taguchi
technique can't unravel multi-target
streamlining. Along these lines, the Taguchi strategy combined with Gray social investigation can help this issue. Dark Relational Analysis (GRA) is a standardization assessment strategy to tackle a more entangled multi-execution attributes enhancement successfully.
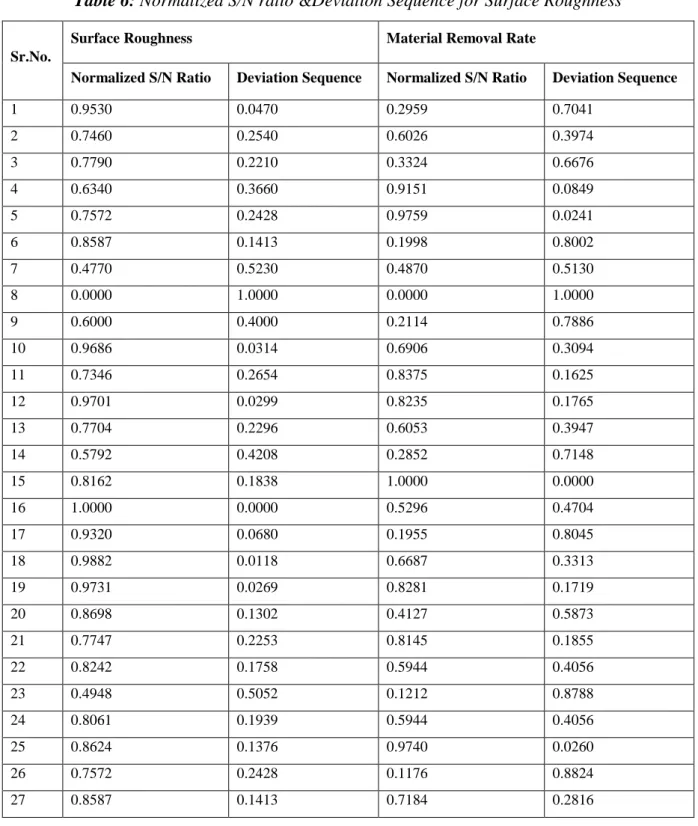
Determination Of Normalized S/N Ratio &Deviation Sequence
Normalize means the measured values of parameters can be varied with the ranging from zero to one. This process is known as
Grey relational normalization [10].
The absolute difference between the
reference sequence and the
comparability sequence after
normalization is known as the deviation
sequence . It is determined using Eq. (3,
4). Values are represented in Table 6 [11].
Normalized S/N Ratio for Surface Roughness
By using the Eq.3 the normalize S/N Ratio for Surface Roughness is calculated as follows.
………… (Eq.3)
Deviation Sequence for Surface
Roughness
By using the Eq.4 Deviation Sequence for Surface Roughness is calculated as follows.
………… (Eq.4)
Normalized S/N Ratio for MRR
By using the Eq.5 the normalize S/N Ratio for Material Removal Rate is calculated as follows.
………… (Eq.5)
Deviation Sequence for MRR
By using the Eq.6the Deviation Sequence for Material Removal Rate is calculated as follows.
17 Page 7-23 © MAT Journals 2016. All Rights Reserved
………… (Eq.6)
=0.7041
Table 6: Normalized S/N ratio &Deviation Sequence for Surface Roughness
Sr.No.
Surface Roughness Material Removal Rate
Normalized S/N Ratio Deviation Sequence Normalized S/N Ratio Deviation Sequence
1 0.9530 0.0470 0.2959 0.7041 2 0.7460 0.2540 0.6026 0.3974 3 0.7790 0.2210 0.3324 0.6676 4 0.6340 0.3660 0.9151 0.0849 5 0.7572 0.2428 0.9759 0.0241 6 0.8587 0.1413 0.1998 0.8002 7 0.4770 0.5230 0.4870 0.5130 8 0.0000 1.0000 0.0000 1.0000 9 0.6000 0.4000 0.2114 0.7886 10 0.9686 0.0314 0.6906 0.3094 11 0.7346 0.2654 0.8375 0.1625 12 0.9701 0.0299 0.8235 0.1765 13 0.7704 0.2296 0.6053 0.3947 14 0.5792 0.4208 0.2852 0.7148 15 0.8162 0.1838 1.0000 0.0000 16 1.0000 0.0000 0.5296 0.4704 17 0.9320 0.0680 0.1955 0.8045 18 0.9882 0.0118 0.6687 0.3313 19 0.9731 0.0269 0.8281 0.1719 20 0.8698 0.1302 0.4127 0.5873 21 0.7747 0.2253 0.8145 0.1855 22 0.8242 0.1758 0.5944 0.4056 23 0.4948 0.5052 0.1212 0.8788 24 0.8061 0.1939 0.5944 0.4056 25 0.8624 0.1376 0.9740 0.0260 26 0.7572 0.2428 0.1176 0.8824 27 0.8587 0.1413 0.7184 0.2816
18 Page 7-23 © MAT Journals 2016. All Rights Reserved
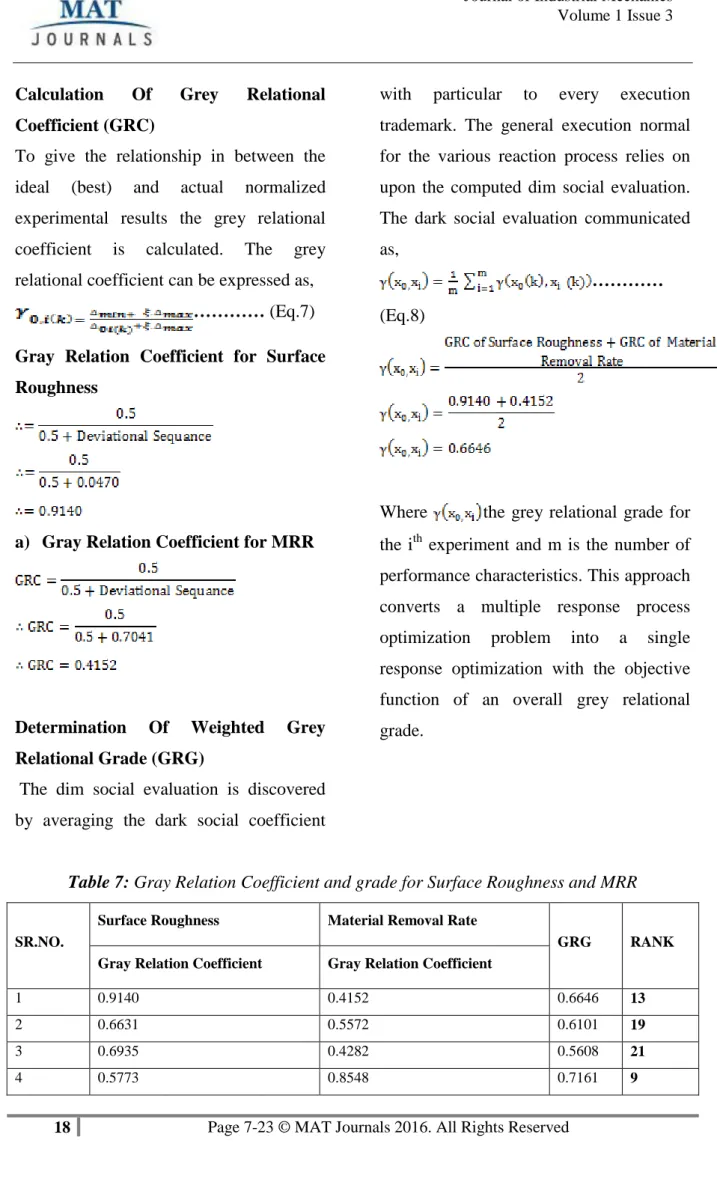
Calculation Of Grey Relational
Coefficient (GRC)
To give the relationship in between the
ideal (best) and actual normalized
experimental results the grey relational
coefficient is calculated. The grey
relational coefficient can be expressed as,
………… (Eq.7)
Gray Relation Coefficient for Surface Roughness
a) Gray Relation Coefficient for MRR
Determination Of Weighted Grey
Relational Grade (GRG)
The dim social evaluation is discovered by averaging the dark social coefficient
with particular to every execution
trademark. The general execution normal for the various reaction process relies on upon the computed dim social evaluation. The dark social evaluation communicated as,
………… (Eq.8)
Where the grey relational grade for
the ith experiment and m is the number of
performance characteristics. This approach converts a multiple response process optimization problem into a single response optimization with the objective function of an overall grey relational grade.
Table 7: Gray Relation Coefficient and grade for Surface Roughness and MRR
SR.NO.
Surface Roughness Material Removal Rate
GRG RANK
Gray Relation Coefficient Gray Relation Coefficient
1 0.9140 0.4152 0.6646 13
2 0.6631 0.5572 0.6101 19
3 0.6935 0.4282 0.5608 21
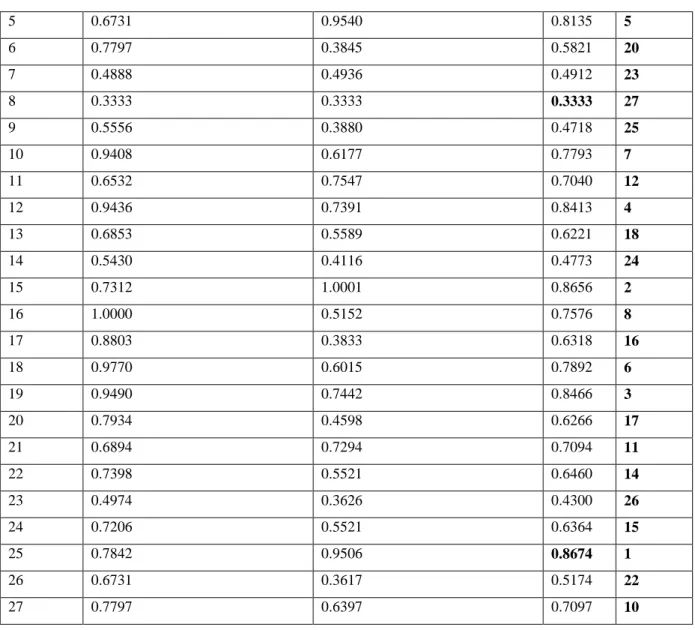
19 Page 7-23 © MAT Journals 2016. All Rights Reserved 5 0.6731 0.9540 0.8135 5 6 0.7797 0.3845 0.5821 20 7 0.4888 0.4936 0.4912 23 8 0.3333 0.3333 0.3333 27 9 0.5556 0.3880 0.4718 25 10 0.9408 0.6177 0.7793 7 11 0.6532 0.7547 0.7040 12 12 0.9436 0.7391 0.8413 4 13 0.6853 0.5589 0.6221 18 14 0.5430 0.4116 0.4773 24 15 0.7312 1.0001 0.8656 2 16 1.0000 0.5152 0.7576 8 17 0.8803 0.3833 0.6318 16 18 0.9770 0.6015 0.7892 6 19 0.9490 0.7442 0.8466 3 20 0.7934 0.4598 0.6266 17 21 0.6894 0.7294 0.7094 11 22 0.7398 0.5521 0.6460 14 23 0.4974 0.3626 0.4300 26 24 0.7206 0.5521 0.6364 15 25 0.7842 0.9506 0.8674 1 26 0.6731 0.3617 0.5174 22 27 0.7797 0.6397 0.7097 10
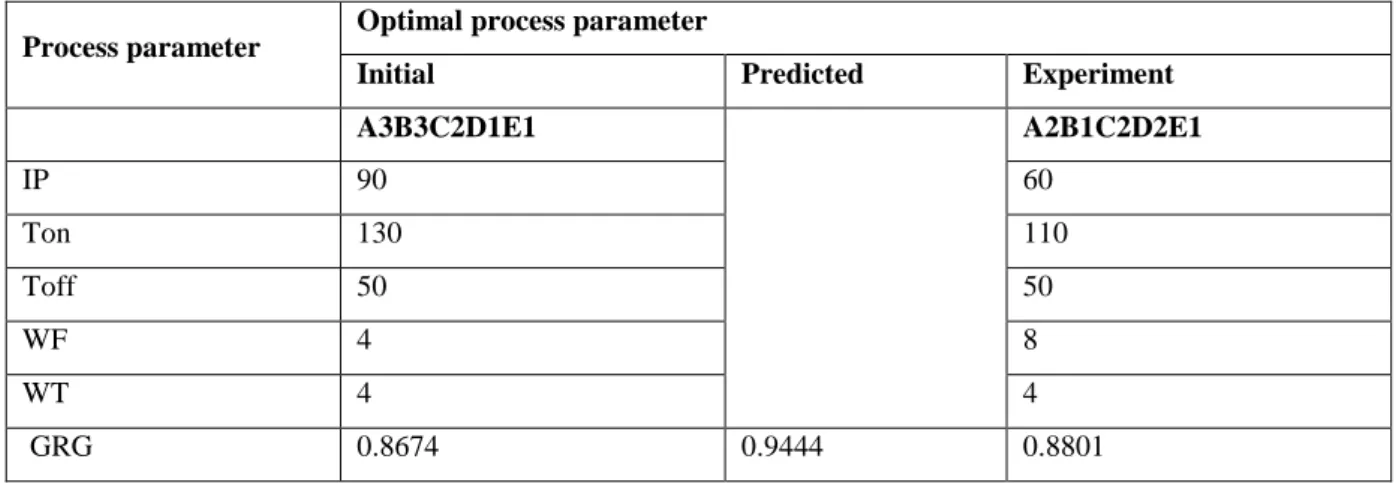
Prediction Of Grey Relational Grade Under Optimum Parameters
Table 8:Optimal factor level for each response
Control factor Unit SYMBOL LEVEL VALUE
Peak current Ampere A 2 60
Pulse on time Machine unit B 1 120
Pulse off time Machine unit C 2 50
Wire feed m / min D 2 8
20 Page 7-23 © MAT Journals 2016. All Rights Reserved Table 9: Optimal process parameter
Process parameter
Optimal process parameter
Initial Predicted Experiment
A3B3C2D1E1 A2B1C2D2E1 IP 90 60 Ton 130 110 Toff 50 50 WF 4 8 WT 4 4 GRG 0.8674 0.9444 0.8801 MICRO HARDNESS
There is a recast white layer formed on the EDMed machined surface. The surfaces are heavily rough because of the debris which are not flashed away completely from the machining zone. It indicates that the specimen’s hardness near the outer surface can reach maximum than core hardness, but this hardening effect is due
to the formation of the oxides Cr2O3, ZrO2,
TiO2, TiNiO3, carbides TiC and the
deposition particles in the recast layer. HV = Vickers hardness is,
Fig 7: Diamond indentation after loading
RESULT AND DISCUSSION
Simulations are run as per Taguchi experimentation plan and respective values of Surface roughness and MRR for each simulation run is converted into the respective S/N ratios as per equation 1 and are given in Table 2,3. Data analysis is made using MINITAB R16@ software at the 95% of confidence. Main effect plots and interaction plots are used to determine the optimum factor levels for each response and results are shown in Figure 9.
21 Page 7-23 © MAT Journals 2016. All Rights Reserved Graph 1: Micro hardness Vs Depth of
indentation
CONCLUSION
In this study, the effect of process parameters on the response variables (MRR, SR and Micro Vickers hardness)
of NITINOL was investigated
experimentally in WEDM. 1) Material Removal Rate
The material removal rate is measured by the weight loss method in which material removal rate is mostly affected by the pulse off time because larger time between two successive sparks reduces the material removal rate.
2) Surface Roughness
The surface roughness of material during WEDM machining is mostly affected by the peak current. If peak current value is reaches maximum then surface become more rough due to high discharge energy during spark generation.
3)Micro Hardness
During WEDM machining material goes under thermo mechanical process so phase transformation occurs. Due to this
there is hard layer is formed on outer side which is called as white layer and it varies up to core.
For multi objective optimization of optimal process parameters of Electro Discharge Machining (WEDM) for NITINOL shape memory alloy using Grey Relational Analysis, initial optimal combination A3-B3-C2-D1-E1 (IP=90, Ton=130, Toff=50, WF=4, WT=4) gives highest grey relational grade that is 0.8674. Thus, trial no. 25 shows the peak point for GRG, this is the initial optimum process parameters because it has highest grade.
4) As for every ANOVA table it
uncovers that pinnacle current, wire encourage and wire pressure are most influencing procedure parameters on surface unpleasantness. Likewise the beat off time is the most influencing
procedure parameter on Material
Removal Rate.
5) Grey social examination (GRA)
has been used to enhance both yield parameters all the while. The outcomes synopsis utilizing GRA is appeared as a part of Table10 beneath:
22 Page 7-23 © MAT Journals 2016. All Rights Reserved Table 10:Results of confirmation test
Levels Initial optimal combination
A3B3C2D1E1 Predicted Experimental A2B1C2D2E1 Material Removal Rate 36.2 34.04 Surface Roughness in µm 3.12 3.42 GRG 0.8674 0.9444 0.8801 REFERENCES
1. Choudharya N., Kaurb D., “Shape
memory alloy thin films and
heterostructures for MEMS
applications A review” journal of
Sensors and Actuators A, vol. 242, (2016), 162–181
2. McNaney J.M., Imbeni V. , Jung
Y.,Papadopoulos P., Ritchie R.O., “An experimental study of the superelastic effect in a shape-memory Nitinol alloy
under biaxial loading” journal of
Mechanics of Materials, vol. 35, (2003), 969–986
3. Thamburaja P., “A
finite-deformation-based phenomenological theory for
shape-memory alloys” International
Journal of Plasticity, vol. 26 , (2010) ,1195–1219
4. Dabade U. A., Karidkar S. S.,
“Analysis of response variables in WEDM of Inconel 718 usingTaguchi
technique” journal of Procedia CIRP
,vol. 41, (2016) ,886 – 891.
5. Equbal M. I., kumar R., Shamim M.,
Ohdar R.K., “A grey-based Taguchi method to optimize hot forging
process”, journal of Procedia
Materials Science, vol. 6, (2014) ,1495 – 1504.
6. B. K. Lodhi, S. Agarwal,
“Optimization of machining
parameters in WEDM of AISI D3
Steel using TaguchiTechnique”
journal of Procedia CIRP ,vol. 14, ( 2014 ) , 194 – 199
7. Alias A., Abdullah B., AbbasN. M.,
“wedm influence of machine feed rate in machiningtitanium ti-6al-4v using brass wire and constant current (4a) ”,journal of procedia engineering, vol. 41 , (2012) , 1812 – 1817
8. DurairajM.,SudhaersanD,Swamynatha
nN., “Analysis of Process Parameters in WireEDM with Stainless Steel using Single Objective Taguchi Method and Multi Objective Grey Relational
23 Page 7-23 © MAT Journals 2016. All Rights Reserved engineering, vol. 64, (2013) ,868 –
877.
9. Khan Z. A.,Siddiquee A. N.,Khan N.
Z.,Khan U., Quadir G. A., “Multi
response optimization of Wire
electrical discharge machining process parameters using Taguchi based Grey
Relational Analysis”, Procedia
Materials Science, vol. 6, (2014) ,1683 – 1695.
10.Saedon J.B., JaafarN.l, Yahaya M.A.,
Saad N.,Kasim M. S., “Multi-objective optimization of titanium alloy through orthogonal array and grey relational
analysis in WEDM”, Procedia
Technology ,vol. 15, (2014) ,832 – 840.
11.PhadkeM.S., “Quality engineering
using robust design”,Prentice Hall,