Petrophysical characterization of paleokarst
and effect on reservoir properties
Master Thesis
Katrine Slotnæs
Department of Physics and Technology/Department of Earth Science
University of Bergen
ii
Abstract
Karst is a geological process that can enhance porosity and permeability within a carbonate succession, thus affecting the heterogeneity producing a substantial effect on the fluid flow. The subject is not widely explored in the petroleum-related literature and hydrocarbon exploration depends on recognizing geological structures. In this case, paleokarst within the Northern Billefjorden, Svalbard, have been used as an analog for classifying paleokarst structures and estimate the petrophysical properties.
Samples were collected from 21 separate breccia bodies. They show a wide range in texture and brecciation. Petrophysical properties were determined using the saturation method for estimating the porosity, and air – and water measurements for estimating the permeabilities.
Samples that were unaffected by brecciation gave low effective porosity values. Whereas the voids and vuggy pore space of the brecciated samples yield also low porosity which indicated that the pores were rarely connected. Cements within the brecciated samples could be observed visually and occluded the fractures traces as much as 100 % in some areas. Flow permeability values determined from the samples gave low permeabilities (< 10 mD) for all of the samples. However the permeability of the samples did not always reflect the outcrops, which were highly fractured. Visual estimations of the outcrops would yield higher permeabilities, as some fractures had larger aperture than the diameter of a core plug (1 inch).
The paleokarst within this study would be classified as a fractured reservoir, with low porosities band high permeabilities. Connectivity between the breccia bodies would establish if the area has a reservoir potential. Exploration of a single breccia pipe, would be a too high risk and not economical. The Minkinfjellet Formation would yield good connectivity, whereas the unbrecciated parts of Wordiekammen consisting of micritic limestone would yield low
permeability between the breccia bodies. However, the Minkinfjellet Formation was covered by scree in the study area so the connectivity is uncertain, whereas a fractured wackestone/packstone layer within the Wordiekammen Formation, could imply good reservoir potential covering the studied areas.
iv
Acknowledgements
This thesis is a part of my Master Degree in Petroleum Technology – Reservoir Geology at the Centre of Integrated Petroleum Research (CIPR), at the University of Bergen. The thesis was supervised by Walter Wheeler (CIPR) and had lots of good ideas, Sverre Hetland whom helped me at the lab and Jan Tveranger for lots of good feedback.
Would also like to thank people helping me with me thesis whenever and wherever I had a problem; a special thanks to; Jonas Solbakken, Per Arne Ormehaug, Christian Eide, Svenn Tveit, Jord de Boer, Annette Johannessen, Bartek Vik and Solveig Risøen.
I would also like to thank my friends and my fellow students at Cipr. With a special thanks to Silje Osland and Ulf. Thank you all for loads of fun.
Furthermore, I would like to thank my family. You always support me and have always been there for me, Helge Slotnæs, Grete Slotnæs, Kristine Slotnæs, Alvin Andreassen, Sølvi Nordlund, Jan Holtet and all the rest, THANK YOU!
Katrine Slotnæs Bergen, June 2012
v
Table of contents
1 Introduction ... 1
1.1 Background ... 1
1.2 From Karst to paleokarst ... 2
1.2.1 Karst ... 2
1.2.2 Origin and distribution of karst landscape ... 3
1.2.3 Development of karst landscape ... 4
1.2.4 Dolines and associated interstratal dissolution – breccia pipes ... 5
1.2.5 Cave sedimentation ... 8
1.2.6 Breakdown ... 8
1.2.7 Classifications of cave facies ... 11
1.2.8 Evolution of paleocave reservoirs ... 13
1.3 Petrophysical properties ... 13 1.3.1 Porosity ... 13 1.3.2 Secondary porosity ... 14 1.3.3 Permeability ... 16 2 Regional Geology ... 17 2.1 Regional overview ... 17 2.2 Geological setting ... 18 2.3 Tectonic setting ... 21 2.4 Basin Geometry ... 23 2.5 Stratigraphic setting ... 24
2.6 Late syn-rift deposits ... 24
2.7 Post-rift ... 25
vi
2.9 Burial and Diagenesis ... 28
2.10 Breccia Classifications in the Billefjorden area ... 31
2.10.1 Breccia facies description ... 31
3 Methods ... 33 3.1 Fieldwork ... 33 3.1.1 Equipment ... 33 3.2 Mapping techniques ... 33 3.2.1 LIME ... 33 3.2.2 ArcGIS ... 34 3.2.3 Svalbardkartet ... 34
3.3 Laboratory technique and methods ... 35
3.3.1 TinyPerm ... 35
3.3.2 Total volume measurements of samples ... 36
3.3.3 Porosity measurements on samples ... 38
3.3.4 Cutting of core plugs ... 39
3.3.5 Permeability and porosity measurements on core plugs ... 39
3.3.6 Uncertainties in laboratory methods ... 42
3.3.7 Uncertainties in the porosity and permeability of the core plugs ... 44
4 The results from the field observations ... 45
4.1 Introduction ... 45
4.2 Area 1 - The Red Breccia Pipe ... 46
4.3 Area 2 ... 53
4.4 Area 3 ... 55
4.5 Facies description ... 57
vii
5.1 Introduction ... 63
5.2 Area 1 – The Red Breccia Pipe ... 64
5.2.1 Location 6 - Sample 6 ... 65 5.2.2 Location 9 - Sample 9 ... 67 5.2.3 Location 14 - Sample 14 ... 69 5.2.4 Location 15 – samples 15 ... 71 5.2.5 Location 16 - Sample 16 ... 74 5.2.6 Location 19 - Sample 19 ... 76 5.3 Area 2 ... 79 5.3.1 Area 2 – sample 1M ... 80 5.3.2 Area 2 – sample Q1 ... 82 5.3.3 Area 2 – Sample Q2 ... 85 5.4 Area 3 ... 88
5.4.1 Location 1 - Sample 1Aa ... 90
5.4.2 Location 1 – Sample 1Ab ... 92
5.4.3 Location 1 – sample 1Ac ... 94
5.4.4 Location 1 – sample 1Ad ... 96
5.4.5 Location 1 – sample 1B ... 98
5.4.6 Location 1 – sample 1C ... 100
5.4.7 Location 3 – Sample 3A1 ... 102
5.4.8 Location 3 – Sample 3A2 ... 104
5.4.9 Location 4 – sample 4 ... 106
5.4.10 Location 5 – Sample 5A ... 108
5.4.11 Location 5 – Sample 5B ... 110
viii
6.1 Breccia ... 113
6.2 Area 1 - The Red breccia pipe ... 116
6.3 Petro-physical properties within The Red Breccia Pipe ... 118
6.3.1 Petrophysical characterization with respect to Loucks and Mescher (2001) ... 118
6.3.2 Petrophysical characterization with respect to Noreide (2008)... 122
6.4 Area 2 ... 126 6.5 Area 3 ... 128 6.6 Reservoir potential ... 130 7 Conclusion ... 134 8 Further work ... 135 9 References ... 136 10 Appendix 1 ... 140
10.1 Area 1 – The Red Breccia Pipe ... 140
10.2 Area 2 ... 147
10.3 Area 3 ... 150
11 Appendix 2 ... 160
11.1 Results of experimental measurement ... 160
11.1.1 Area 1 – The Red Breccia Pipe ... 160
11.1.2 Area 2 ... 162
11.1.3 Area 3 ... 165
1
1
Introduction
1.1
Background
Hydrocarbon reservoirs with enhanced porosity and permeability which result from karstification due to prolonged subaerial exposure of carbonate rock are common in many petroliferous basins in the world (Mazzullo and Chilingarian 1996). Collapsed-paleocave systems are an important class of this type and consist of a complex array of rock textures, fabrics, structures, and pore networks (Kerans 1988; Loucks and Mescher 2001; Loucks 1999, 2001; Loucks and Handford 1992). These can create complex petrophysical heterogeneities in petroleum reservoirs (Loucks 1999), which may affect the fluid flow behavior significantly. This is because paleocave reservoirs have a complex history of formation, including dissolution, fracturing, burial, compaction and coalescing (Hammes et al. 1996; Loucks 1999, 2001, 2007; Loucks and
Handford 1992), often occurring in several stages (Hammes et al. 1996). Paleokarst reservoir can be large scale features, extending for hundreds to thousands of meters (Loucks 1999).
The aim of reservoir characterization is to describe the spatial distribution of the petrophysical parameters such as porosity, permeability and saturation within paleocave reservoir (Lucia 1999). The objective of this study is to improve our understanding of karst reservoir by using a well- known outcrop example, a paleokarst area situated at the northernmost part of Billefjorden, Spitsbergen (e. g Eliassen and Talbot 2005). A suite of samples were sampled from different breccia deposits in this area and characterized, and the petrophysical properties measured. The focus has been on interpreting the development of collapsed paleokarst structures, and how it has affected the petrophysical properties within a breccia body.
Several studies of paleokarst have been made, (Kerans 1988; Loucks and Mescher 2001; Loucks 1999), and petrophysical properties have mostly been estimated by the use of thin sections. The study area at Billefjorden has been documented by several authors (Aase 2006; Braathen et al. 2011; Eliassen 2002; Eliassen and Talbot 2003b; Eliassen and Talbot 2005; Lønøy 1995; Maher and Braathen 2011; Nordeide 2008). This thesis can be considered a continuation of the work begun by (Nordeide 2008). However this study will give a more quantitative description of the petrophysical properties to karst deposit through laboratory testing.
2
1.2
From Karst to paleokarst
This chapter will give an introduction to the development of paleokarst structures. The transition from karst to paleokarst can occur over a period up to millions of years. The processes involved in the transition can be burial of cave systems, collapse of cave systems, sediment infilling, fracturing and cementation (Ford and Williams 1989). A paleokarst landscape gives information about an earlier geological setting dominated by karstification.
1.2.1
Karst
Karst is defined as comprising terrain with distinctive hydrology and landforms that arising from a combination of high solubility rocks and well developed secondary (fracture) porosity, Figure 1.1 (Ford and Williams 1989). Karst areas are characterized by sinking streams, caves, enclosed depressions, fluted rock outcrops, and large springs. Important factors in the formation of karst are rock structure and lithology such as massive, pure, and coarsely fractured rocks (Ford and Williams 1989).
Many sequences of carbonate rocks are found to contain or get terminated by unconformities that are karst solutional surfaces or cavities that are now inactive, these are called paleokarst (Ford and Williams 1989). Paleokarst can be defined as a karstified surface and karst features
associated with it, such as caves, which have been buried by younger rocks. Paleokarstic features at various scales can be recognized within most carbonate successions. More rarely they may be exhumed by the effort of later uplift and erosion (Lowe 1995), which means that the features can be recognized in outcrops at landsurfaces.
It is important to understand the general processes that develop modern cave systems since the scale, geometries, and spatial complexities of paleocave systems are influenced by their initial near-surface scale, geometries and complexities (Loucks 1999).
3
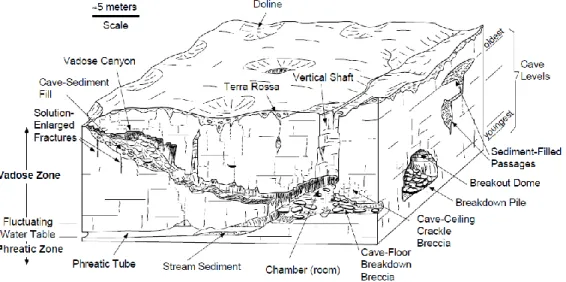
Figure 1.1: The comprehensive karst system. The composite diagram shows the major phenomena encountered in active karst terrains. The diagram illustrates karst features developed at the surface, called exokarst. Endokarst are karst features developed underground, which is often divided into hyperkarst (underground dissolution by circulating meteoric waters) and hypokarst (dissolution by juvenile or connate waters). Reproduced from hydrology (Ford and Williams 1989).
1.2.2
Origin and distribution of karst landscape
The distribution of an aggregate of surface and near-surface karst globally is about 20% of the planet dry- ice-free land (Ford and Williams 1989). Karstification of these surfaces can be called a process of destruction (White 1988), and karst landscapes are the foremost examples of
groundwater erosion on the earth (Ford et al. 1988).
The sculpturing and removal of bedrock is mostly done by solution, and in some cases aided by soil piping and collapse. Karst landforms develop best in limestones, dolomites, gypsum and salt (Ford et al. 1988). Highly soluble rocks such as gypsum and salts are transformed into karst landscapes at a faster rate than for less soluble carbonate rocks (White 1988), where gypsums solubility with respect to limestone is 100 times as great (Warren 2006).
The dissolution and chemical weathering of limestone and dolomite shapes the landscape by creating sinkholes, caves, and a penetrating multistory drainage system underground consisting of
4 shafts, passages, canyons and chambers (Palmer 1991). The regions underlain by evaporite
subcrop exhibit dissolution landforms similar to carbonate karst (Ford and Williams 1989; Warren 2006). But unlike the carbonate karst, the effect of near surface evaporite solution on cavern formation and land surface subsidence are much faster and can take years, not millennia (Warren 2006).
1.2.3
Development of karst landscape
A common dissolution product of karst meteoric diagenetic environment is caves and many reservoirs are known to produce from intervals with paleocaves (Loucks 1999; Lucia 1999). Therefore the focus of this thesis will emphasize on the karst development in the subsurface. Dissolution due to meteoric water is the main factor in formation of karst, but several other factors are recognized. These include climate, microclimate, the presence and thickness of soil, local topography, parent rock structure and texture, tectonic regime, denudation and time (Klimchouk 2004). Nearly all major surface karst features originates from internal drainage, subsidence, and collapse triggered by the development of underlying caves, Figure 1.2.
Figure 1.2: The block diagram shows near surface karst terrain with phreatic (below the water table) and vadose (above the water table) cave features. The figure is from Loucks and Handford (1992).
Caves are developed based on the hydrological or geomorphic expression of any karst region (Palmer 1991). Caves are found above, below and along the water table. Most extensive cave systems contain vadose parts draining to phreatic, or water table parts. Systems that have evolved
5 through several developing stages may contain older phreatic parts and younger water table and vadose passages (Ford et al. 1988).
Dissolution in an evaporite setting typically begins in the shallow subsurface as edges of salt beds are flushed by meteoric or marine waters and continues deeper, wherever and whenever bed egdes are flushed by undersaturated brines (Warren 2006).
1.2.4
Dolines and associated interstratal dissolution – breccia pipes
Dolines (aka. Sinkholes in North America) lead to underground passages that can contain underground streams, and are commonly floored by cave sediments and collapse breccia (Lucia 1999). Dolines are closed circular to elliptical depressions, often funnel shaped, with diameters ranging from a meter to a few kilometres and depth from a meter to hundreds of metres. The dolines indicate subsidence and/ or collapse of underlying salts or carbonates (Warren 2006). There are different types of dolines, Figure 1.3. Dissolution, collapse and suffusion are more active, more rapid and more frequent in evaporite terrains compared to carbonates (Warren 2006).
Figure 1.3: Typical evaporite karst features created by-: A) Suffosion, shallow evaporite dissolving rapidly below a soil of insoluble residues. B) Collapse, steep sided sinkholes that often indicates entrance to a cave. C) Solution, subsidence dolines that indicates deep and widespread evaporite dissolution. D) Subsidence on a basin scale. The figure is from (Warren 2006)
6 Sag structures are circular to subcircular (McDonnell et al. 2007) like dolines and can also be seen in the subsurface. Sag structures are due to underlying collapse mechanism like paleocave collapse, evaporite and hydrothermal dissolution (McDonnell et al. 2007).
Mechanical strength of a rock mass is massive bedrock devoid of jointing and thinly bedded and densely jointed strata. When the bedrock is barely affected by the jointing, the subsidence mechanism is mainly controlled is by the width and size of the cavities. The roof of stratiform cavities with a wide span tend to result in sagging, Figure 1.4(a). But when cavities have a significant height and a limited width, the collapse processes are controlled by dome shaped failure planes, Figure 1.4 (b). With a network of dense jointing, the dominant mechanisms are collapses, and the brecciation controlled by numerous pre-excisting failure planes, Figure 1.4 (c). In Figure 1.4 (d) the mechanisms are about the same as in Figure 1.4(b), but sagging is evident in the stratiform layers next to the open cavity. Sagging and collapse are as well evident when the bedrock is densely jointed and caused by sheet interstratal karstification, Figure 1.4 (e), (Gutiérrez et al. 2008). The main controls in interstratal karstification of evaporite bedrock are sagging and collapse. These processes affect the evaporite bedrock as well as overlying bedrocks such as limestone (Gutiérrez et al. 2008).
Figure 1.4: The diagrams show the main mechanisms in development of bedrock and caprock sinkholes. The figure is from Gutiérrez et al. (2008).
7 Breccia pipes develop as landscape features on the same scale as collapse dolines. They are steep sided chimney like features created by progressive upward stoping from in the evaporate case, a basal sulfate or a salt bed. In regions of thick evaporites the stoping process is driven by the escape of undersaturated basinal or deeply circulating meteoric waters leaking from levels below the sealing evaporite bed. The water that create a stoping pipe, may be focused into point or line sources via underlying biogenic buildups or fracture networks (Warren 2006).
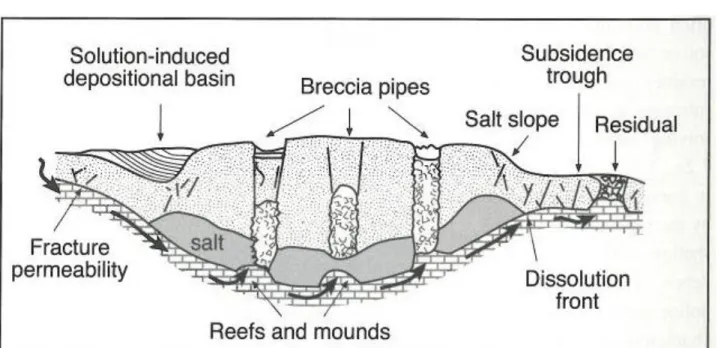
Figure 1.5: Solution subsidence trough which is an elongate depression created by interstratal
dissolution. The largest solution-induced depositional basins tend to occur along the margins, creating a solution form that can be represented as a shallow salt slope in the subsurface. Dissolution can occur when the salt is buried and the overlying strata (usually dolomites, gypsum/anhydrite or redbeds) may be comprehensible brecciated. From (Ford and Williams 1989).
Breccia pipes consist of fallen breakdown and debris. The breccia pipes range size from few meters across and tens of meters high, but they can also be of an even larger scale, extending up several hundred meter high through the cover rocks and proportionally many hundreds meter across. These large scale features do not necessarily reach the surface (Waltham et al. 2005). Breccia pipes may exhibit four different states, Figure 1.5: 1) Active and prograding upwards towards the surface, but not yet expressed on the surface; 2) Active or inactive, expressed on the surface as a closed depression or as a surface outflow channel from a depression; 3) Inactive and buried by later strata, paleokarst breccia pipe; 4) Inactive and standing up as a positive relief feature on the land surface, as it is more resistant to weathering than the upper strata. The pipe is then a residual pipe, most likely due to cementation of the strata (Warren 2006).
8 Breccia pipes are not a major feature in limestone karst, and nearly all deep breccia pipes
originates from dissolution of gypsum or salt (Waltham et al. 2005). For example there are estimated to be more than 5000 breccia pipes over gypsum and salt in North America (Quinlan Jr 1978; Warren 2006).
1.2.5
Cave sedimentation
Caves are basically giant sediment traps and the sediments can either be allochthonous, which is sediments transported into the cave from outside the cave, or it can be autochthonous which means they originate from inside the cave (Loucks and Handford 1992). Allochtonous sediments are usually water transported and composed sand, clay and rock fragments. Autochthonous sediments are locally derived and can be subdivided into 3 categories which are: chemical sediments, local detritus, and breakdown (White and White 1969).
Chemical sediments consist of locally derived calcite, aragonite and gypsum. Weathered products of limestone such as clay minerals, chert, sand and fossil fragments fall into the local detritus category. Breakdown is the third category and is the general term for the fallen bedrock within the cavity (White and White 1969).
1.2.6
Breakdown
Cave collapse is the product of mechanical failure of cave roofs and is the natural development of karst cave evolution (White and White 2000). Roof collapse can occur during the time of exposure and can continue after exposure as the overlying strata is deposited and the overburden pressure increases (Lucia 1999).
Subsidence mechanism of a rock mass is largely determined by the mechanical strength of the rock itself. The rock strength is largely determined by the density and orientation of bedding planes and joints, the geometry and width span of the cavities, the hydraulic conditions (vadose or phreatic) that will determine the mode of groundwater flow, and the effective weight of cavity roof, as the buoyant support is removed (Gutiérrez et al. 2008).
The cause of all breakdowns within a void is due to mechanical failure within or between rock beds or joint-bounded strata. The distribution of a load (load equals the density of the rock, gravity and the thickness of the rock mass or height of the cliff overhead), as a stress field about a cave cross-section is given in Figure 1.6 a). A tension dome is created in the rock mass above a
9 passage and the height of the tension dome is determined by the width of the cavity. The rock beds in the tension dome are subject to sagging, and the overlying weight is transferred to the adjoining passage walls, greatly increasing the stress there. The tension dome is also within the floor but have little significance for breakdown in natural caves. Cave breakdown is failures in the tension dome, and are most regular in form where the strata are well-bedded and horizontal (Ford and Williams 1989). The Figure 1.6 b), and Figure 1.6 d), indicates different mechanisms of breakdown in cases where the strata not necessarily are well-bedded and horizontal (Ford and Williams 1989).
Figure 1.6: A) Distribution of stress lines and a tension dome around a cave. B) Pressure-release spalling where load is maximum, at a pillar or the foot of a wall. C) Deformation of the breakout dome where the stratal dip is steep. Multiple development of cave formation from (Ford and Williams 1989).
Products of collapse that are important for reservoir description are fractures and collapse breccia. The geometry of the breccia deposits follow the pattern of major cave development (Lucia 1999). The fracture porosity will be concentrated in the failed roof and flanks of the cave system (Loucks and Handford 1992; Lucia 1999). Cavern development and collapse can produce a vertical sequence of fractures and different breccia types (Kerans 1988; Lucia 1999)
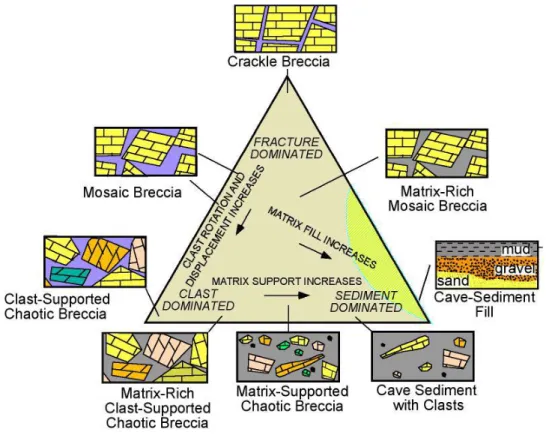
10 Loucks (1999) classified the fractures and different breccia types of cave breakdown, where he used a ternary diagram to show the relationship between crackle breccia, mosaic breccia, chaotic breccia, and cave sediments, Figure 1.7 (Loucks 2007).
Crackle breccia shows minor displacement between the separate rock fragments and are the product of fracturing due to stress relief in the cave ceiling and walls (Loucks 1999). Mosaic breccia are more displaced and rotated than crackle breccia, but can still be fitted back together (Loucks and Handford 1992). Chaotic breccia cannot be fitted back together and is composed of a mixture of clast that originates from one or several sources. They have been transported vertically by collapse, or laterally by fluvial or density flow mechanism and they range from matrix-free to matrix-rich (Loucks 2007). Sediment fill indicates processes of suspension,
traction and mass flow mechanisms and can therefore be of any material texture or fabric (Loucks and Handford 1992).
Due to differential compaction, crackle breccia with loosely fitted clasts are formed in the buried cave-roof. Due to further mechanical compaction, rebrecciation creates a chaotic breccia of
Figure 1.7: Triangle classification showing the breccia and clast deposits within a cave system. Originally from Loucks (1999), modified in Loucks et al. (2007)
11 smaller clasts as the voids are closed. In the subsurface, hydrothermal dissolution can give
preferred mechanism for mineral deposits. Because of several episodes of rebrecciation and tectonic overprint it can be hard to distinguish between the cave related breccia and the tectonic overprint (Loucks and Handford 1992).
1.2.7
Classifications of cave facies
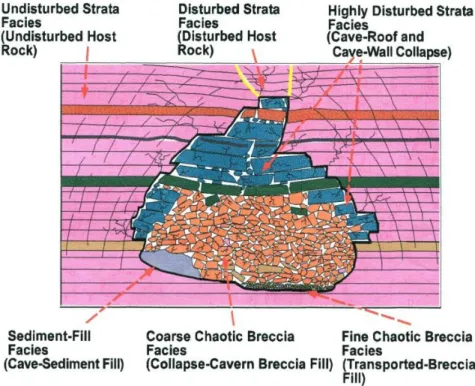
Karst brecciation is the controlling factor for a paleokarst reservoir`s quality and heterogeneity, and not the tectonic overprint (Kerans 1988). A model of karst facies is therefore important in order to understand the heterogeneity of the reservoir (Loucks et al. 2004). Loucks and Mescher (2001) proposed a general classification of six common paleocave facies, described below, and shown in Figure 1.8.
1. Continuous strata, is characterized by undisturbed bedding continuity for tens to
hundreds of meters. The strata can show minor deformation such as titling and fracturing and solution holes with breccia and /or sediment fill.
2. Discontinuous strata, is characterized by high continuity of the bedding with small scale folding and faulting that is commonly overprinted with crackle and mosaic brecciation. This facies is interpreted as disturbed host rock around collapsed cave passages.
3. Highly disturbed strata, is highly disturbed, very discontinuously bedded strata with pockets and layers of chaotic breccia. Small scale folding and faulting is common with significant overprint of crackle and mosaic breccia. This facies is interpreted as lithified collapsed roof and wall rock at the top of the caverns.
4. Coarse-clast chaotic breccia, is poorly sorted, matrix to clast-supported, granule- to boulder sized chaotic breccia that is 0.3 to 3 meter long. It is commonly clast supported, but can contain matrix material. It forms ribbon- to tabular-shaped body as much as 15 meter across and hundreds of meters long. The facies has been interpreted to be deposited in-situ as collapsed-breccia cavern fill which has not been transported by stram or mass-flow processes. Interclast pores in the matrix-free chaotic breccia have good reservoir quality when not cemented.
5. Fine-clast chaotic breccia, is poorly to well sorted, matrix- to clast-supported, granule- to cobble-sized chaotic breccia with varying amounts of matrix. The clasts can be imbricated or graded and forms ribbon- to tabular shaped body as much as 15 meters
12 across and hundreds meter long. It consists mostly of cavern fill that has been transported either by mass flow or stream flow processes.
6. Finer grained sediment, consists of fine silt-to granule-sized sediments that contain less than 10 % granules, and are carbonate and/or siliclastic debris. Sedimentary structures can be common. The facies ranges from 0,3 to 0,8 meter in thickness and is interbedded with chaotic breccia facies. The fine grained material that make up this facies is interpreted to have been transported by traction, mass-flow, and suspension mechanism (Loucks et al. 2004).
Figure 1.8: Cross sectional view of a collapsed cave passage and facies classification. Originally from Loucks and Mescher (2001), modified in (McDonnell et al. 2007).
The facies classification proposed by Loucks and Mescher (2001) was un-obtainable, but the classification was re-stated in (Loucks et al. 2004). However since the classification originally was published in Loucks and Mescher (2001), it will in this thesis be referred to Loucks and Mescher (2001).
13
1.2.8
Evolution of paleocave reservoirs
When there is a high density of cave passages, the expanded area of breccia and fractures from each passage may intersect with each other. The result is interconnection of cave passage chaotic breccia with crackle, mosaic and fractures, creating a large-scale, coalesced, collapsed paleocave system (Loucks 1999). This large scale system may be hundreds to several thousand of meters across, and tens of meters to more than 100 meter thick (Loucks 2007).
Large scale breccia can also be formed due to stratiform brecciation, where the general style of interstratal collapse is typified by blanket aquifers and broad areas of gentle sagging where diffuse flow of undersaturated flow over large areas has slowly removed evaporites. The blanket aquifer can lie within, below or above the dissolving evaporite bed. Larger interbed and
overburden clast tend to be tabular, and dominated by mosaic to crackle breccias. In areas with focused dissolution, large caverns and solution planes have formed within the dissolving evaporite bed, so that the whole of the overlying unit can be reduced to a breccia pipe (Warren 2006).
1.3
Petrophysical properties
Reservoirs in karstified carbonate rocks are usually heterogeneous. The heterogeneity is the result of the irregular distribution of porosity zones and complex nature of pore systems (Chilingar et al. 1996). The heterogeneity causes problems in reservoir development as the karst related
dissolution that has overprinted pre-existing porosity systems complicates reservoir petrophysical characterizations (Chilingar et al. 1996).
1.3.1
Porosity
Porosity is defined as the void part of the rocks total volume that is unoccupied by rock grains or mineral cement (Zolotukhin 2000). From a reservoir engineering point of view, porosity is one of the most important of the rock properties (Amyx et al. 1960), due to hydrocarbon storage
potential.
Porosity can be divided into primary porosity, secondary porosity and effective porosity. Primary porosity is defined as developed during deposition of the rock (Zolotukhin 2000). Primary pores can be divided into interparticle and intraparticle, Feil! Fant ikke referansekilden.. The
14 the combined effects of compaction and cementation. The intraparticle pores are found within skeletal grains of carbonate sands, and are thus often cul-de-sac pores, but are usually also absent due to compaction and cementation (Selley 1985).
The absolute porosity is the total volume of pores irrespective whether the pores are
interconnected or not. Absolute porosity is given, in percentage, as the ratio of the total void volume,VT, to the bulk volume, VB.
(1.1)
The effective porosity gives the volume of interconnected pores, and is dependent on rock type, grain size range, grain packing and orientation (fabric), cementation, weathering and leaching (Zolotukhin 2000). Effective porosity is the ratio between the total pore volume of the
interconnected pores, VP, to the bulk volume of the rock, VB.
(1.2)
For highly cemented materials and limestone, there can be a significant difference in the total and effective porosity. The effective porosity is usually the quantitative value desired since it
represents the void space occupied by mobile fluids (Amyx et al. 1960).
1.3.2
Secondary porosity
Secondary porosity is produced during geological processes subsequent to the deposition of the rock. Processes includes diagenesis, fractures, fissures and channels within the formation (Ford and Williams 1989). Secondary porosity in limestone is typified by the vugs or solution cavities. Rocks with original porosity have more uniform characteristics than rocks that have their porosity enhanced (Amyx et al. 1960).
Paleokarst is reworked carbonate and evaporite rock, and can therefore have induced porosity with a complex pore geometry configuration. This means that two or more pore systems may occur. The basic rock material is fine intercrystalline and referred to as the matrix, with one pore system consisting of uniformly small pores. Larger voids and pores are due to leaching or fracturing of the primary rock material, and can be variable in size and distribution (Amyx et al. 1960). The secondary porosity can therefore be classified into several pore types.
15 Solution-induced pores are common in carbonates and generally a distinction is made between moldic and vuggy porosity, Table 1.1. Moldic porosity is fabric selective, which means that only the grains or only the matrix has been leached out. Whereas vugs, are pores whose boundaries cross-cut grains, matrices, and/or earlier cement, and are generally larger than moldic pores. With increasing size vuggy porosity can increase into cavernous porosity (Selley 1985).
Table 1.1: Classification of porosity found in sediments. Modified from (Selley 1985)
Time of formation Type Origin
Primary of depositional
Secondary or postdepositional
Interparticle and intraparticle Sedimentation Intercrystalline and Fenestral Cementation
Vuggy and moldic Solution
Fracture Tectonics, compaction,
dehydration and diagenesis Microporosity is porous cement or interstitial matrix and fracture porosity which is secondary pores shaped by open microfractures (Zolotukhin 2000). Vugular openings and fractures can be large and are attributed to the rock after its deposition. Both fractures and vuggy porosity can be partially closed or fully closed by infill of cement such as precipitated calcite or other material (Amyx et al. 1960).
Secondary porosity can be caused by the effects of cementation(Selley 1985). Fenestral pores occur where there is a primary or penecontemporaneous gaps in the rock framework, which is larger than the grain-supported interstices, Table 1.1 (Selley 1985; Tebbutt et al. 1965).
Therefore can fenestral pores appear to be primary rather than secondary, and are typically found in carbonates (Selley 1985).
Intercrystalline porosity is pores occurring between the crystal faces of crystalline rocks, Table 1.1. Most limestones that are recrystallized contain negligible porosity. But is more common in dolomites that have gained intercrystalline porosity due to replacement of calcite (Selley 1985). Fracture porosity is one of the most important of the pore geometries to consider as they increase the storage capacity of a reservoir, as they enhance the permeability in the reservoir, Table 1.1. Fractures are most common in brittle rock such as limestones (Selley 1985).
16
1.3.3
Permeability
The permeability is a measure of the ability of a porous medium to transport a fluid through its network of interconnected pores (Amyx et al. 1960). Permeability can be considered as a static parameter if there is only a single fluid flowing through the medium (Zolotukhin 2000), thus absolute permeability is a rock dependent property. The absolute permeability is defined through Darcy`s law, Equation 1.3, for an incompressible fluid and for a horizontal flow in the direction of decreasing pressure (Lien 2004):
Δp μ L A K Q (1.3) Where:
Q = Volumetric fluid flow rate K = Absolute permeability
A = Cross-sectional area of the porous medium μ = Fluid viscosity
Δp = Pressure drop across the flow
When several fluids flow through the interconnected pores, the permeability depends strongly on each of the fluids relative saturation. This is called the effective permeability. Because the non-miscible fluids would inhibit the flow of each other, the effective permeability can be
considerable lower than the absolute permeability (Zolotukhin 2000). The Darcy equation has to be applied for each phase.
The relative permeability is the ratio between the effective permeability of each fluid phase and the absolute permeability of the medium (Lien 2004). The relative permeability gives the direct measurement for a porous medium to conduct one fluid when one or more fluids are present. The flow properties are then a composition of the effects of pore geometries, wettability, fluid
17
2
Regional Geology
This chapter will summarize the regional geology of the study area, which is situated in the northernmost part of Billefjorden at Spitsbergen. A brief background of the geological setting and development within the region will be given, with the emphasizes on the formation of the
Billefjorden trough and the geological formations. In the end, an introduction to the breccia bodies within the Billefjorden Trough will be given.
2.1
Regional overview
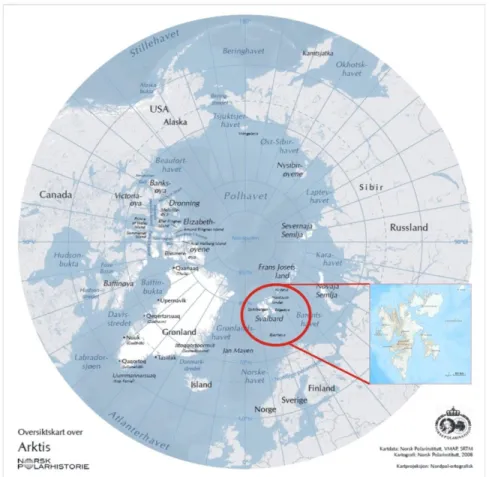
The Svalbard archipelago, Figure 2.1, is situated at latitudes 74˚ to 81˚ North, and longitude 10˚ to 35˚ East and includes all the islands within these latitudes (Nøttvedt et al. 1993; Steel and Worsley 1984).
Figure 2.1: Map showing the location of The Svalbard Archipelago (inset) situated in the Arctic region in the Northern Hemisphere. The Arctic region map is retrieved from polarhistorie.no/seksjoner/Ressurskart and the map of the Svalbard Archipelago is retrieved from TopoSvalbard at polarinstituttet.no.
18 The Svalbard Archipelago includes Spitsbergen, Nordaustlandet, Edgeøya, Barentsøya, Bjørnøya and innumerable smaller island and skerries. The islands combined comprises of a total land area of 62,700 km2 (Worsley 1986). The Svalbard Archipelago form the subaerially exposed north-western margins of the Barents Sea shelf. Even though it covers less than 5 % of the Barents Sea, it gives a comprehensive overview of the geology of the entire region (Harland 1997; Steel and Worsley 1984; Worsley 2008, 1986). Approximately 60 % of Svalbard archipelago is
permanently covered by glaciers and inland ice, but at summer time, successions ranging from the Precambrian to the Paleogene are well exposed in the coastal regions(Steel and Worsley 1984).
2.2
Geological setting
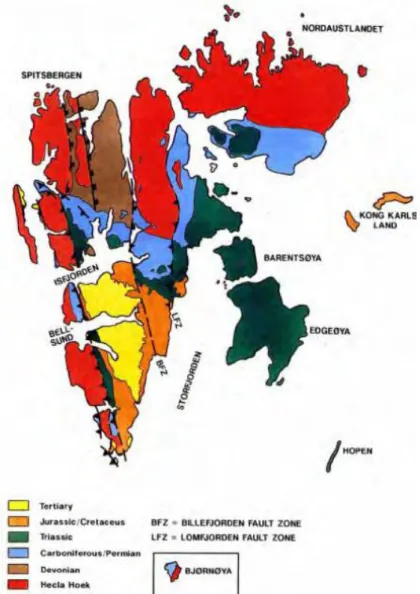
The basement of Svalbard, The Hecla Hoek Formation, was formed as a part of the Caledonian orogeny. In this period the faulting, folding, thrusting and metamorphism of Pre-Cambrian to middle Ordovician sediments and igneous rocks, were at the most intense(Nøttvedt et al. 1993). In the post-Caledonian of Svalbard, tectonic setting has been an important controlling influence on sedimentation patterns. The tectonic framework of the largest island of Svalbard, Spitsbergen, is by N-S to NW-SE structural lineaments on which repeated differential movement or inversion took place since Devonian times. The lineaments are centered around The Lomfjorden Fault Zone, Billefjorden Fault Zone (BFZ) Figure 2.2, as well as Hornsund and Paleo-Hornsund fault zones (Steel and Worsley 1984). The tectonic movement along these lineaments varied from slight flexuring to discrete faulting, where the faulting varied from dip-slip to strike-slip dominance (Steel and Worsley 1984).
19 In the late Devonian, the Devonian succession consisting mostly of continental red beds, was partly deformed and overthrusted, resulting in an angular unconformity to the overlying Carboniferous (Nøttvedt et al. 1993). The early to middle Carboniferous was a period of
extension along the N-S to NW-SW lineaments, creating a number of narrow rift basins, like the Billefjorden graben (Nøttvedt et al. 1993). In the middle Carboniferous the extensional rift basins shows an en echelon distribution, indicating that it has resulted from oblique-slip movements,
Figure 2.3 (Johannessen and Steel 1992; Steel and Worsley 1984). The narrow Carboniferous basins developed into broader basins, and from the early to the middle Carboniferous there was a
Figure 2.2: Geological map showing the deposits deposited under different geological time periods. The map is from (Nøttvedt et al., 1993).
20 shift from coarse clastic red-beds to carbonates and evaporites (Johannessen and Steel 1992). During this time the climate had changed from humid to arid conditions, and from continental to marine conditions, resulting from a regional rise in sea level (Gjelberg and Steel 1981). During the late Carboniferous, Permian and Mesozoic, Svalbard became a stable platform and drifted slowly northward to higher latitudes.
The focus of this chapter is one of the characteristic Carboniferous asymmetric and narrow basins, Billefjorden (Gjelberg and Steel 1981), including the Billefjorden trough located in the area of present day Billefjorden (Eliassen and Talbot 2003b; Johannessen and Steel 1992).
Figure 2.3: Geography and the main depositional environment in Middle Carboniferous. The grey areas indicate where there was mostly erosion of the strata. from (Steel and Worsley 1984) and modified in (Ramberg et al. 2008)
21
2.3
Tectonic setting
The onset of Carboniferous extension as a result from transtensional tectonic movement in the Bashkirian times to Gzhelian times (Eliassen and Talbot 2003b; Gjelberg and Steel 1981; Steel and Worsley 1984), was concentrated along a few major lineaments like the Billefjorden Fault Zone (BFZ) (Nøttvedt et al. 1993). The Billefjorden Trough is a half-graben developed along the eastern side of the (BFZ), between the footwall of the Nordfjorden block and hanging wall of the Ny Friesland block (Johannessen and Steel 1992). The syn-tectonic nature of the basin fill is evident from the marked thickening and coarsening of strata towards the fault zone, creating a distinct asymmetry of the basin. The asymmetry is evident from the 700 meters of syn-tectonic strata close to the faulted zone in the west and pinching out to only a few tens of meters at the eastern side, Figure 2.4 (Johannessen and Steel 1992).
Figure 2.4: The Billefjorden Trough and the adjacent structural heighs and the stratigraphic position of Minkinfjellet and Wordiekammen Formation breccias, Modified figure from (Eliassen and Talbot 2005), originally published in (Johannessen and Steel 1992)
During the Moscovian, active rifting ceased, and the syn-tectonic basin was filled up with sediments. In the early Kazimovian, regional subsidence caused drowning of the structural heights, causing a widening of the basin, Figure 2.4 (Eliassen and Talbot 2005). The entire rift
22 fill succession of the Billefjorden Trough is described as approximately 1 km thick (Braathen et al. 2011). By the end of the Carboniferous and Permian, a large stable platform developed that persisted through the Mesozoic (Steel and Worsley 1984), into Tertiary times (Nøttvedt et al. 1993). In the Figure 2.5, the geological stratigraphy and the tectonic framework of the study area are indicated.
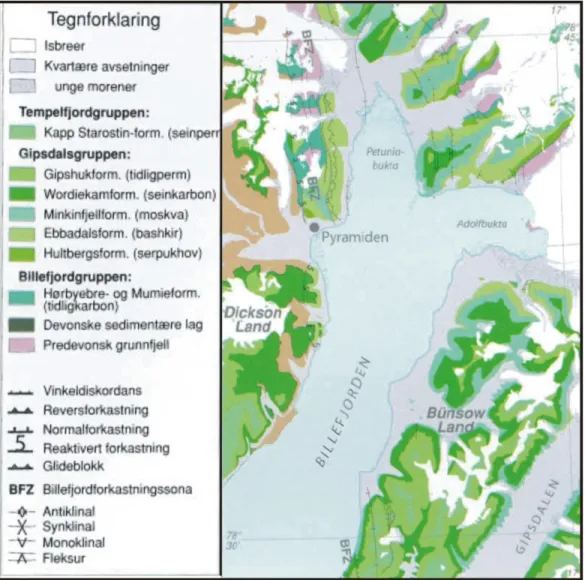
Figure 2.5: Geological map over Carboniferous and Permian stratigraphy in Billefjorden, from (W.Dallmann) and modified from (Ramberg et al. 2008).
23
2.4
Basin Geometry
The Billefjorden trough is located between the footwall of Nordfjorden block and the hanging wall of Ny Frieslandblock (Johannessen and Steel 1992). The Billefjorden Trough trends N-S, and is a half graben developed in the hanging wall of a steeply east-dipping fault, the Billefjorden Fault Zone. The BFZ is an array of subsidiary faults that link up with each other through soft or hard link structures (Braathen et al. 2011).
The western boundary of the BFZ is a basement horst developed between the Balliolbreen and Odellfjellet faults, whose vertical movements controlled the western margin of the
mid-Carboniferous basin, mainly shifting the basin margin eastward throughout time. The eastern margin of the Billefjorden trough is defined by differential onlap of the Middle Carboniferous formations onto the Ny Friesland Platform (McCann and Dallmann 1995). Faulting in the eastern part of the Billefjorden basin is represented by the Lemstrømfjellet Fault Zone (LFZ). There the general gentle western dip of the basin succession towards the BFZ is disrupted by several west-dipping normal faults, where some shows a monocline or drag-fold structure (Braathen et al. 2011).Within LFZ the Løvehovden fault represent the southern termination of the
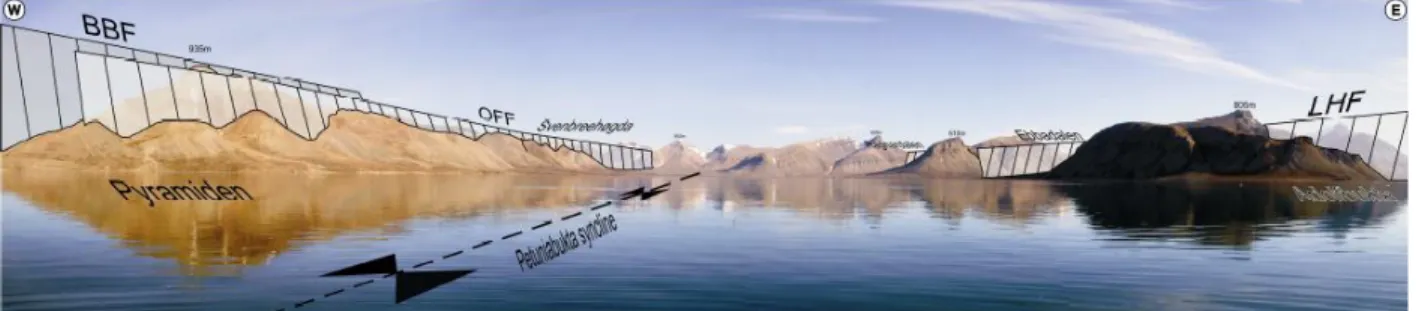
Lemstrømfjellet fault, Figure 2.6 (Maher and Braathen 2011) Although the Wordiekammen Formation is considered a post-tectonic unit, thickness changes along the Løvehovden fault suggest continued fault-controlled basin subsidence. The stratiform breccias in the area are most common on the footwall side of intra-basin faults (Maher and Braathen 2011).
Figure 2.6: Photo-panorama of Billefjorden Trough. The picture shows the extent of the faults with the Balliolbreen Fault (BBF) and Odellfjellet Fault (OFF) to the west, and to the east the Løvehøvden Fault (LHF)(de Boer et al. 2011).
24
2.5
Stratigraphic setting
The stratigraphy of the Billefjorden trough is shown in Figure 2.4, and shows the Carboniferous pre-, syn- and postrift successions. The successions range from continental through sabkha into marine strata (Eliassen and Talbot 2005). In the area studied, the uppermost stratigraphic unit at the outcrop sites were the Gipshuken Formation, deposited in the early Permian (Lauritzen 1981; Steel and Worsley 1984). This section will only focus on the syn-rift to early post-rift
successions, because these were the area of study.
2.6
Late syn-rift deposits
From the late Serpukhovian to early Bashkirian time, there was a dramatic change from humid to arid conditions and the change from continental to marine conditions from a regional sea-level rise (Gjelberg and Steel 1981). Rapid subsidence and faulting occurred along the BFZ, and the general trend was regression in the area (Steel and Worsley 1984).The syn-rift fill of the Billefjorden Trough consist of Hultberget Formation, Ebbadalen Formation (composed of Ebbaelva, Odellfjellet and Tricolorfjellet members) and the Minkinfjellet Formation (Braathen et al. 2011; Cutbill and Challinor 1965; Dallmann et al. 1999; Johannessen and Steel 1992).
The Odellfjellet Member is up to 400 meter thick and onlaps the faulted basin margin in the west. It consists of red, grey and yellow conglomerates and sandstones, red shales with some gypsum nodules and yellow dolomite. These strata are interpreted to be clastic wedges building out from the BFZ as alluvial fans, fan delta, shoreline and shallow marine carbonates. Laterally
interfingering the Odellfjellet member is the Tricolorfjellet Member (>240 m thick) (Dallmann et al. 1999), which represents the basinal facies consisting of sabkha deposits like
gypsum/anhydrite. The sabkha deposits alternates with open marine/lagoonal to intertidal deposits, consisting of black and yellow limestones/dolomites. Odellfjellet and Tricolorfjellet members are time-synchronous (Johannessen and Steel 1992). The deposits of Odellfjellet Member became drowned by evaporites and carbonates of the uppermost Tricolor Member and finally by marine deposits of the overlying Minkinfjellet Formation (Johannessen and Steel 1992).
The Minkinfjellet Formation, up to 300 meter thick (Eliassen and Talbot 2005), is deposited in Moscovian – early Kasimovian times (Dallmann et al. 1999). The succession is
carbonate-25 dominated, consisting of interbedded sandstones, evaporites and minor shales (Eliassen and Talbot 2003b). Breccias within the formation are widespread, and increasing with the proportion of evaporites to the south (Eliassen and Talbot 2003b; Maher and Braathen 2011). During the Moscovian, active rifting ceased, but the Nordfjorden block remained sub-aerially exposed and deposition of the Minkinfjellet Formation was limited to the west (Eliassen and Talbot 2005). To the east the deposition is characterized as differential onlap onto the New Friesland Platfrom, extending further east than the Ebbadalen formation (Eliassen and Talbot 2005; McCann and Dallmann 1995). By the Kazimovian, regional subsidence led to drowning of both the structural heights, and a wider basin developed (Eliassen and Talbot 2005) The unit is considered
retrograding and a part of a transgressive phase of a new megasequence (Johannessen and Steel 1992).
The breccias within the Minkinfjellet Formation has been given an informal name, the Fortet member (Dallmann et al. 1999). The member includes only the breccias within the Minkinfjellet formation, even though brecciation continues into the overlying Black Crag Beds. Due to this the brecciation will be referred to their formal formation names.
2.7
Post-rift
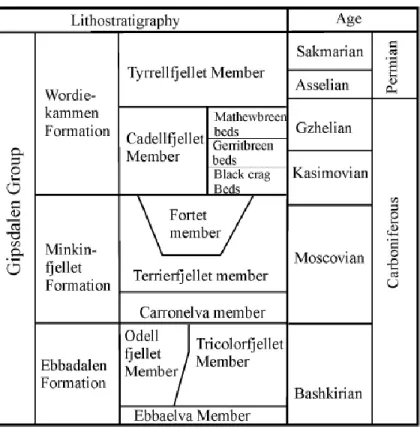
The Wordiekammen Formation overlies the Minkinfjellet Formation, and is represented in the Billefjorden area by Cadellfjellet (thickness 90-250 m) and Tyrrellfjellet (thickness 110-180 m) Members, Figure 2.7 (Dallmann et al. 1999). The Wordiekammen Formation was deposited from late Moscovian to Sakmarian (Dallmann et al. 1999), and is considered as a post-tectonic unit (Braathen et al. 2011). Although (Maher and Braathen 2011) documented thickness changes, for example around the Løvehovden fault which suggest a continued fault-controlled basin. The Wordiekammen Formation accumulated as a transgressive to regressive unit, and the sediments were deposited in a broad basin covering much of central Spitsbergen (Eliassen and Talbot 2005; Pickard et al. 1996; Samuelsberg and Pickard 1999; Steel and Worsley 1984). The sediments are mainly of marine limestone (Dallmann et al. 1999), mostly deposited on a platform in open to semi-restricted, shallow subtidal marine and intertidal to supratidal enviroments (Dallmann et al. 1999; Eliassen and Talbot 2005; Samuelsberg and Pickard 1999; Sundsbø 1982)
26 In the Billefjorden Trough and to the east of it, the Cadellfjellet Member forms the lowermost part of Wordiekammen Formation. The lowermost beds of the Cadellfjellet Member is the Black Crag beds (Dallmann et al. 1999) represented in our study, which is sparse to non-fossiliferous dark brown to black mudstone (micrite) units. These units are typically massive and cliff forming (Pickard et al. 1996), interbedded with thinner, yellow and white wackestone- and packstone beds (Braathen et al. 2011). The Black Crags are restricted to the Central part of Billefjorden Trough, and thicken from the south to the north with thicknesses ranging from 20 to 60 meter (Eliassen and Talbot 2005; Pickard et al. 1996; Samuelsberg and Pickard 1999). Locally brecciation in the Black Crags, cut the formation in form of breccia pipes (Braathen et al. 2011; Eliassen and Talbot 2003b), which have been the area of study in the Billefjorden Trough, and will be discussed further.
Figure 2.7: Late Carboniferous to early Permian stratigraphy in Billefjorden area (Eliassen and Talbot 2005), after (Dallmann et al. 1999).
From the Sakmarian to the Artinskian times in the Middle Permian, a major regression event occurred, leading to sabkha progradation. The sabkhas mark the lower boundary of the
27 to 280 meter thick, but only the lower third constitutes rhythmic intercalations of sabkha and dolomites. The upper 100-150 meter comprises thinly interbedded dolomites and marls, with only evaporitic near the top of the formation. The formation is generally characterized by supra- to intertidal sedimentation on evaporitic and carbonate flats (Stemmerik and Worsley 2005). The Gipshuken Formation is the highest geological unit in our area of study, and whereas only scattered patches of sabkha deposits remain in northern Billefjorden (Braathen et al. 2011)
2.8
Brecciation
Thick and widespread carbonate breccia occurs within the Billefjorden Trough in both syn-rift and early post-rift deposits. The breccias exhibit a lateral extent over more than 250 km2. The
Figure 2.8 shows the area of study, and the figure shows that the dominant breccias are the cross-cutting breccias with thicknesses up to 200 m measured in the central part of the basin. In the area in total, the dominant occurrence of breccias are as individual beds of 0,5-15 meter that are interbedded with undeformed limestones and siliciclastics (Eliassen and Talbot 2005). The Breccias are developed throughout the Minkinfjellet formation and in basal parts of the
Wordiekammen formation (Eliassen and Talbot 2005). The breccias are polygenetic (Maher and Braathen 2011), and can be divided into two categories (Eliassen and Talbot 2005).
The first category of thick breccia bodies is situated in the central part of the basin. It consists of massive and up to 200 meter thick funnel-shaped breccia pipes, which resembles typical doline breccias. Another feature is large V-structures, which are broken and tilted carbonate beds, showing crackle to mosaic brecciation. The breccias can show subtle bedding or zonation of different types of breccias, which is not laterally consistent (Eliassen and Talbot 2005).
The second category is of stratabound breccia beds interbedded with undeformed carbonate and silisiclastic rocks. The second category has a wider areal extent towards the basin margin than category one, with the dominant occurrence of individual beds with thickness ranging from 30 cm to tens of meters (Eliassen and Talbot 2005). Texturally the clasts are small, ranging from sub-centimeter to meter in size and monomict. They have no zonation or bedding but inverse grading is common. The upper boundary is commonly of disrupted bedding and small scale V-structures (meter size) (Eliassen and Talbot 2005).
28 The massive breccia bodies of category one are found in the middle and upper parts of the
Minkinfjellet Formation and the lower part of Wordiekammen Formation. Category two is only found within the Minkinfjellet formation (Eliassen and Talbot 2005). Studies of breccia deposits supports a solution collapse origin, as interstratal karstification of gypsum and anhydrite beds within the Minkinfjellet and upper Ebbadalen Formations are considered the cause of brecciation at this stratigraphic level (Eliassen and Talbot 2005). The extent of brecciation seems to be directly linked to the amount of gypsum deposited in the basin (Eliassen 2002), with a larger amount of gypsum deposited in the central basin presumably led to thicker solution collapse breccias in this area. Dissolution of thinner gypsum beds presumably produced thinner stratabound breccias towards the basin margin (Eliassen and Talbot 2005). Further, a
disconformable surface between the Ebbadalen and Minkinfjellet formations on the eastern side of LFZ is related to fault movement, exposure, and near- or at-surface evaporate dissolution that locally produced stratiform breccias (Maher and Braathen 2011).
Figure 2.8: The map shows the distribution of breccia types within the study area in the Billefjorden Trough basin. The figure is modified from (Eliassen and Talbot 2005).
2.9
Burial and Diagenesis
The development of the breccia bodies are considered to be Late Carboniferous to Early Permian. This is due to the gypsum dissolution was interstratal by the time brecciation occurred, and the surrounding rocks were lithified and cemented (Eliassen 2002; Eliassen and Talbot 2005). As well as the collapsed breccias developed after dolomitization and formation of chert nodules in the host rock (Eliassen 2002; Eliassen and Talbot 2005). For these reasons the brecciation must
29 have occurred after deposition of the Minkinfjellet and Wordiekammen Formations, and took place in the subsurface after some degree of burial. Cementation of the breccia bodies must have occurred at similar or slightly greater depths. A burial depth of up to 500 m during brecciation and cementation are not unlikely (Eliassen and Talbot 2005).
The main phase of the dissolution and brecciation was probably related to laterally extensive exposure surfaces detected within the middle and upper part of Wordiekammen Formation (Eliassen 2002). The surfaces were exposed due to a significant fall in sea-level leading during the Late Carboniferous to Early Permian (Eliassen and Talbot 2005). The Gzhelian and
Asselian/Sakmarian exposure surfaces are considered to be the best candidates for timing the karstification of Minkinfjellet Formation evaporites, and the brecciation of the Minkinfjellet and Wordiekammen Formation carbonate rocks (Eliassen 2002). Diagenesis in the Late
Carboniferous to Early Permian occurred at depth but from waters of meteoric origin (Eliassen and Talbot 2005).
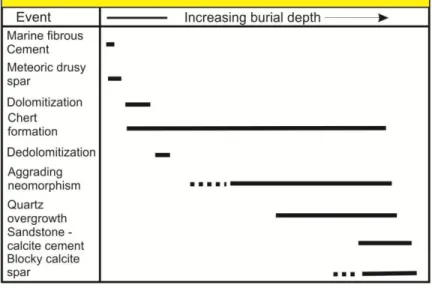
The types of cements presented in Table 2.1 includes the three generations of cement have been detected in the Minkinfjellet Formation limestone. 1) Early marine fibrous cement, which has volumetrically minor abundance. 2) Drusy calcite spar precipitated during flushing of meteoric water is present around the former exposure surfaces. 3) Coarse crystalline blocky pore-filling spar, which were precipitated during deeper burial (Eliassen 2002). Aggrading neomorphism producing pseudosparitic crystalline limestone, is common in original lime-mudstones and wackestones. Partial or complete dolomitization is widespread within Minkinfjellet Formation and is caused by gypsum precipitation and production of hypersaline brines in the basin. Three mechanisms of silicification are common in the carbonates in Minkinfjellet Formation. 1) Silica replacement of the gypsum nodules. 2) Concretionary growth of silica which has been nucleated by organic matter. 3) Megaquartz that has replaced the calcite spar. The dominant cement in the Minkinfjellet sandstones is quartz. Pore-filling calcite spar are also abundant in the sandstones and post-date the quartz-cementation (Eliassen 2002).
30
Table 2.1: Cements with increasing burial depth in Minkinfjellet formation, the figure is from (Eliassen and Talbot 2003a).
The cementation in the Black Crags of the Wordiekammen Formation took place in near-surface marine and meteoric environments, down to deep burial environments, Table 2.2 (Aase 2006). The figure shows that the same types of cements as in Minkinfjellet can be found within the Black Crag Beds.
Table 2.2: Sequential evolution of diagenetic events in the Black Crag Beds, the table is from (Aase 2006).
31
2.10
Breccia Classifications in the Billefjorden area
The breccia classification in the area of study is based upon the facies interpretations from Hege Cecilie Noreides master thesis. Her master thesis, “Spatial distribution and architecture of breccia pipes features at Wordiekammen, Billefjorden, Svalbard”, made the classifications for the breccia pipes found within Wordiekammen formation and Fortet of the Minkinkammen Formation.
2.10.1
Breccia facies description
In Noreide (2008), three representative breccia pipes along the western and southern slopes of Wordiekammen were selected for detailed studies of structures and sediment fill. The facies descriptions in (Nordeide 2008) were based upon classification of breccia collapsed caves done by Loucks (1999). In (Noreide 2008), six facies were recognized, and their photo description is indicated in Figure 2.11 :
Facies A: Brecciated micrite: The facies consists of angular clasts that range in size from 2-10 cm.The color is red and grey and the composition is clast supported micritic breccia. The clasts are brecciated but almost in place.
Facies B: Micritic breccia: The facies consists of angular to sub-angular clasts, ranging from 1-3 cm with occasionally clasts up to 10 cm large. The composition is clast supported grey micritic breccia. The facies is highly fractured and is porous with minor amount of silty matrix.
Facies C: Stratified mixed breccia: The texture of the facies is of angular to ribbon, with clasts ranging from 0.5 m and up to boulders. The color is grey and yellowish. The composition
consists of facies F and facies G, with grain and granule sized matrix. Stratification of the facies is with mainly facies F in on sequence, and then facies G in another.
Facies D: Massive mixed breccia: The texture of the facies ranges from angular to ribbon, with gravel to boulder sized rock fragments. The color is grey and yellow and has a chaotic
sedimentary structure. The facies consists of facies F and facies G, with grain sized and granule sized matrix.
Facies E: Cemented micritic breccia: The clasts are angular to sub-angular, and consist mainly of 0.3-1 cm clasts, but up to 7 cm clasts were observed. The color is grey and is mainly facies F but with cement around the clasts. The sedimentary structure is fine-clast cemented breccia.
32
Facies F: Stratified micrite: The texture of this facies is massive and consists of massive clasts. The color ranges from light grey to grey micritic breccia. The sedimentary structure is massive and generally blocky. Horizontal sequences with intervals of light grey and grey color. Farctures around color change were observed.
Facies G: Wackestone/packestone: It has a sedimentary texture and consists of fossiliferous sedimentary rock. The color is yellow and consists of packstone. The sedimentary structure is massive or some sandstone stratification.
Figure 2.9: Photo description of facies A through G. Picture A, shows facies A and B. Picture B, shows facies B and C. Picture C shows facies C and D. Picture D shows facies D and E. Picture E shows facies E and F. Picture F shows facies F and G, Picture G shows facies G as the darker redder bedding
33
3
Methods
3.1
Fieldwork
The fieldwork in Billefjorden area in Spitsbergen was conducted from 1st of August to 7th of August 2011. The fieldwork was spent on identifying the paleokarst features in Wordiekammen and Minkinfjellet Formations, in an area ranging from Ebbadalen to Adolfbukta. During this period the size of breccia bodies were identified and mapped. The main focus was on identifying and describing the different facies distribution within a breccia pipe. Positions of the different outcrops within the breccia pipes were made by using GPS, measurement band - and stick.
3.1.1
Equipment
Compass GPS ( WGS_1984_UTM_Zone_33N)
Map: Geological map of Billefjorden, Central Svalbard, Scale 1:50 000 Measuring tape (40 meter)
Measuring stick (2 meter) Lens
Field notebook
“Sedimentary rocks in the field” by Maurice E. Tucker, 1996 Altimeter
3.2
Mapping techniques
Several techniques have been used in the making a topographic overview over the outcrops in the Billefjorden area. Spitsbergen is badly covered by satellite pictures, so a few mapping programs have been used in order to make a topographic overview picture.
3.2.1
LIME
LIME (Lidar Interpretation and Manipulation Environment) (Buckley et al. 2008) is a lidar interpretation program which is based on terrestrial laser scanning for modelling geological outcrops. The lidar interpretation program integrates photographic 3-D models of geological outcrops (Buckley et al. 2008). The data collected for the 3-D models are based on GPS coordinates. The outcrops at Billefjorden area was scanned in 2007, and careful planning were
34 done to determine the times when the GPS Constellation was at its best geometric configuration. This is because of the proximity of Svalbard to the North Pole, there are several periods within 24 hour period with poor satellite geometry (Buckley et al. 2010). LIME was used in mapping of the outcrop sites to find the missing GPS coordinates and correct the GPS coordinates taken in the field.
3.2.2
ArcGIS
ArcGIS is a system working with maps and geographic information, and is a group of computer programs based on geographic information systems (GIS), and is produced by Esri. ArcGIS is a complete system for designing and managing solutions for geographic information and
knowledge. ArcGIS desktop were used to design a shape file for the GPS coordinates made in the field and constructed from LIME.
3.2.3
Svalbardkartet
Norwegian polar institute does the mapping of the Norwegian areas in Antarctic and in the Arctic, hence Spitsbergen. They have created the interactive maps of Spitsbergen online, called Svalbardkartet and TopoSvalbard (Norsk-Polar-Institutt). The Svalbardkartet shows a detailed topographic base map, equivalent to the topographic main map serie, Svalbard 1:100 000. Into the Svalbardkartet the shape files made in ArcGIS, were incorporated, and a detailed topographic 2-D view of the breccia pipe outcrop site was constructed. The interactive TopoSvalbard map gave coordinates and distance measurements between the localities of study, as well used to make descriptive figures.
35
3.3
Laboratory technique and methods
3.3.1
TinyPerm
TinyPerm II is a portable air permeameter, Figure 3.1. It is a portable hand-held instrument to measure the rock matrix permeability or effective fracture apertures on outcrops, or at samples in a laboratory.
Since all of the samples had a rough surface, an artist`s kneaded-rubber was applied to the nozzle to prevent airflow along the surface of the sample and ensure accuracy. To calculate the
permeabilities, Equation 3.1 was used:
( ) (3.1) The tiny perm measurements were performed five times at each point of measurement, in order to sort out anomalous measurements. The points of measurements taken were indicated with the letters from A to G, see Appendix 1 1. Standard deviation was used to find the probability of the results, Equation 3.2.
∑ ( ̅)
(3.2)
The uncertainties in the measurements could be quite large since the best way to measure tiny perm is on a flat surface. Most of the samples had a rough surface, and reliability values are hard to achieve, but they give an approximation of the permeability. The permeability of these samples is in a wide range due to the heterogeneity and degree of fracturing in the samples. For the more homogenous sample, more equal permeability results were achieved.
36
Figure 3.1: TinyPerm II, a portable air permeameter.
3.3.2
Total volume measurements of samples
Due to the highly irregular shape of the samples, their volumes were measure with mass balance and Archimedes law. The Archimedes law states that buoyancy equals the weight of the
displaced fluid (Lien and Løvhøiden 2004). The formula for buoyancy is.
⃗⃗⃗ (3.3)
In order to get the volume, the Archimedes law, Equation 3.3, was incorporated in the mass balance equation, shown in Figure 3.2. The mass balance equation is:
Mgdown=(ρwVg+mg)up (3.4)
The reference fluid is distilled water, with density, ρ = 1 g/ml. Converting Equation (3.4), gives the equation for the total volume of the rock.
37 The setup for the measuring of the total volume, Figure 3.2 show the different parameters put into the Equation 3.5.
Figure 3.2: The setup for the total volume measurements on both saturated and dry samples.
The measurements of the total volume were performed several times, on both dry samples and saturated samples. The procedure was performed as follows for the dry samples:
1. The samples were dried at 80 ˚C, until the samples had a constant dry weight. 2. The weighted dry weight in air was called, mdown.
3. A string was put around the sample and the sample was lowered into the water. The weight in water was then read off the scale, mup.
4. The samples weight was weighted after the experiment, to measure the excess water the samples gained during the measurement, as the samples were measured without a packing.
Distilled water was used because of its neutral ion composition. The samples were not packed, as a result of all the packages were torn apart because of the samples rough surface. By weighing the samples after the measurements the error of the excess water was corrected, as described in section 3.3.6.
For the volume measurement on the saturated samples, setup in Figure 3.2, the procedure is mainly the same as for the dry samples, whereas the second step is added. The saturation procedure:
38 2. The samples were saturated in a desiccator. The desiccator was evacuated with the
samples, until the pressure was below 1 Torr. After the pressure was below 1 Torr, the desiccator was filled with distilled water. Then the water filled desiccator with the samples was left for 6-7 hours, before the samples were taken out.
3. The samples were then taken out and weighted. Which gave the saturated weight in air,
mdown.
5. Then a string was put around the sample and the sample was lowered into the water until it is totally covered. The weight in water was then read of the scale, mup.
6. Finally the samples were weighted one more time in air.
The pore volume of the samples was measured simultaneously, as both the dry weight and the saturated weight of the sample was weighted during the procedure. After the saturation procedure had been completed, the total volume was measured with volume displacement method, since they would not take up any water in the pore system. Two different containers were used, one for the small samples and one for the larger samples. The use of two different containers were due to the volume displacement was insignificant for the small samples in the large container. Volume displacement is often used when the sample has an irregular shape. The measurements gave an indication of the total volume.
3.3.3
Porosity measurements on samples
The porosity of the samples was performed as simultaneously as the measurement of the total volume in the saturation procedure described in section 3.3.2. By creating vacuum in the sample, the water will instantly be sucked into the pore space of the rock, due to forced imbibition. However, to ensure that the samples were saturated completely, then stayed in the desiccator for 6-7 hour on average. The pore space of the samples was calculated by subtracting the dry sample weight from the weight of the saturated sample using the equation below.
(3.6)
In the Equation 3.6 the density of water, ρ, equals 1 g/ml. The porosity of the samples was then gain by using Equation 1.2, thus gaining the effective porosity.