2017 IEEE. Personal use of this material is permitted. Permission from IEEE must be obtained for all other uses, in any current or future media, including reprinting/republishing this material for advertising or
promotional purposes, creating new collective works, for resale or redistribution to servers or lists, or reuse of any copyrighted component of this work in other works. and is licensed under All Rights Reserved license:
Win, Thu Yein, Tianfield, Huaglory and Mair, Quentin (2017) Big Data
Based Security Analytics for Protecting Virtualized Infrastructures in
Cloud Computing. IEEE Transactions on Big Data (99). pp. 1-15. ISSN
2332-7790
Official URL: https://doi.org/10.1109/TBDATA.2017.2715335 DOI: http://dx.doi.org/10.1109/TBDATA.2017.2715335 EPrint URI: http://eprints.glos.ac.uk/id/eprint/4823
Disclaimer
The University of Gloucestershire has obtained warranties from all depositors as to their title in the material deposited and as to their right to deposit such material.
The University of Gloucestershire makes no representation or warranties of commercial utility, title, or fitness for a particular purpose or any other warranty, express or implied in respect of any material deposited. The University of Gloucestershire makes no representation that the use of the materials will not infringe any patent, copyright, trademark or other property or proprietary rights.
The University of Gloucestershire accepts no liability for any infringement of intellectual property rights in any material deposited but will remove such material from public view pending investigation in the event of an allegation of any such infringement.
Big Data Based Security Analytics for Protecting
Virtualized Infrastructures in Cloud Computing
Thu Yein Win,
Member, IEEE
, Huaglory Tianfield, and Quentin Mair,
Member, IEEE
Abstract—Virtualized infrastructure in cloud computing has become an attractive target for cyberattackers to launch advanced attacks. This paper proposes a novel big data based security analytics approach to detecting advanced attacks in virtualized infrastructures. Network logs as well as user application logs collected periodically from the guest virtual machines (VMs) are stored in the Hadoop Distributed File System (HDFS). Then, extraction of attack features is performed through graph-based event correlation and
MapReduce parser based identification of potential attack paths. Next, determination of attack presence is performed through two-step machine learning, namely logistic regression is applied to calculate attack’s conditional probabilities with respect to the attributes, and belief propagation is applied to calculate the belief in existence of an attack based on them. Experiments are conducted to evaluate the proposed approach using well-known malware as well as in comparison with existing security techniques for virtualized infrastructure. The results show that our proposed approach is effective in detecting attacks with minimal performance overhead.
Index Terms—Virtualized infrastructure, virtualization security, cloud security, malware detection, rootkit detection, security analytics, event correlation, logistic regression, belief propagation
Ç
1
I
NTRODUCTIONA
virtualized infrastructure consists of virtual machines(VMs) that rely upon the software-defined
multi-instance resources of the hosting hardware. The virtual
machinemonitor,alsocalledhypervisor,sustains,regulates
and manages thesoftware-defined multi-instance
architec-ture. The ability to pool different computing resources as
well as enable on-demand resource scaling has led to the
widespreaddeploymentofvirtualizedinfrastructuresasan
importantprovisioningtocloudcomputingservices.
This has made virtualized infrastructures become an
attractivetargetforcyberattackerstolaunchattacksfor
ille-galaccess.Exploitingthesoftwarevulnerabilitieswithinthe
hypervisor source code, sophisticated attacks such as
Vir-tualized Environment Neglected Operations Manipulation
(VENOM)[1]havebeenperformedwhichallowanattacker
tobreakoutofaguestVMandaccesstheunderlying
hyper-visor.Inaddition,attackssuchasHeartbleed[2]and
Shell-shock [3] which exploit the vulnerabilities within the
operating system can also be used against the virtualized
infrastructureto obtainlogindetailsof theguestVMsand
performattacksrangingfromprivilegeescalationto
Distrib-utedDenialofService(DDoS).
Existing security approaches to protecting virtualized
infrastructures generally include two types, namely
mal-ware detection and security analytics. Malware detection
usually involves two steps, first, monitoring hooks are
placedatdifferentpointswithinthevirtualized
infrastruc-ture,thenaregularly-updatedattacksignaturedatabaseis
usedto determineattackpresence.Whilethis allowsfora
real-timedetectionofattacks,theuseofadedicated
signa-ture database makes it vulnerable to zero-day attacks
for whichithasnoattacksignatures.
Securityanalytics appliesanalytics onthevarious logs
which are obtained at different points within the
network to determine attack presence. By leveraging
the huge amounts of logs generated by various
security systems (e.g., intrusion detection systems(IDS),
security information and event management (SIEM),
etc.), applying big data analytics will be able to detect
attackswhicharenot discovered through signature- or
rule-based detection methods. While security analytics
removes the need for signature database by using
event correlation to detect previously undiscovered
attacks, this is often not carried out in real-time and
currentimplementationsareintrinsicallynonscalable.
Toovercometheselimitations,inthispaperweproposea
novelbigdatabasedsecurityanalytics(BDSA)approachto
protecting virtualized infrastructures against advanced
attacks. Bymakinguse ofthe networklogsaswell asthe
user applicationlogscollectedfromtheguest VMswhich
arestoredinaHadoopDistributedFileSystem(HDFS),our
BDSAapproachfirstextractsattackfeaturesthrough
graph-basedeventcorrelation,aMapReduceparserbased
identifi-cation of potential attackpathsand then ascertainsattack
presencethroughtwo-stepmachinelearning,namely
logis-ticregressionandbeliefpropagation.
T.Y. Win is with the Faculty of Business, Computing & Applied Sciences, University of Gloucestershire, Cheltenham GL50 2RH, United Kingdom. E-mail: [email protected].
H. Tianfield and Q. Mair are with the Department of Computer, Communi-cations and Interactive Systems, Glasgow Caledonian University, Glasgow G4 0BA, United Kingdom. E-mail: {h.tianfield, q.mair}@gcu.ac.uk. Manuscript received 26 May 2016; revised 30 Apr. 2017; accepted 10 June 2017. Date of publication 0 . 0000; date of current version 0 . 0000.
(Corresponding author: Thu Yein Win.) Recommended for acceptance by S. Cui.
For information on obtaining reprints of this article, please send e-mail to: [email protected], and reference the Digital Object Identifier below.
Digital Object Identifier no. 10.1109/TBDATA.2017.2715335
2332-7790ß2017 IEEE. Personal use is permitted, but republication/redistribution requires IEEE permission. See http://www.ieee.org/publications_standards/publications/rights/index.html for more information.
The remainder of the paper is arranged as follows.
Section 2 presents a review upon the existing security
approaches.Section 3proposesour bigdata basedsecurity
analytics (BDSA) approach. Experimental evaluations are
presented inSection 4,while Section5discussesourBDSA
approachincontrastwiththerelatedwork.Section6draws
theconclusion.
2
L
ITERATURER
EVIEW2.1 Malware Detection in Virtualised Infrastructure
Malwarereferstoanyexecutablewhichisdesignedto
com-promisetheintegrityofthesystemonwhichitisrun.There
aretwoprominentapproachestomalwaredetectionincloud
computing, namely in-VM and outside-VM interworking
approachandhypervisor-assistedmalwaredetection.
2.1.1 In-VMandOutside-VMInterworkingApproachto MalwareDetection
In-VMandoutside-VMinterworkingdetectionconsistsofan
in-VMagentrunningwithintheguestVM,andaremote
scru-tinyservermonitoringtheVM’sbehaviour.Whenapotential
malwareexecutionisdetectedthein-VMagentsendsthe
sus-piciousexecutabletothescrutinyserver,whichthenusesthe
signaturedatabasetoverifymalwarepresenceorotherwise
and then informs the in-VM agent of the results.
CloudAV, a cloud-basedmalware detection system
fea-turing multiple antivirus engines,employsin-VMand
out-side-VM interworking approach to protect the guest VMs
against attacks [4]. Apparently the effectiveness of this
schemedependsonthefrequencyatwhichthevirus
signa-tures are updated by the antivirus vendors.
The in-VM and outside-VM interworking approach is also used by CuckooDroid, to detect mobile malware
pres-enceonAndroiddevices[5].Itconsistsofanin-deviceagent
whichscansexecutablesonthedeviceandsendsany
suspi-cious executable to a remote scrunity server which runs a
hybrid of anomaly-based and signature-based malware
detectors. The scheme first extracts malware features by
using staticas well as dynamicanalysis on malwareapps.
Theobtainedfeaturesarethenusedtotrainaone-class
Sup-port Vector Machine (SVM) classifier for anomaly-based
detection. Implemented onan emulated Android platform,
CuckooDroid achievedadetectionaccuracyof98.84percent.
2.1.2 Hypervisor-Assisted Malware Detection
Hypervisor-assisted malware detection, on the other hand, uses the underlying hypervisor to detect malware within the guest VMs.
A hypervisor-assisted malware detection scheme is designed in [6] to detect botnet activity within the guest VMs. The scheme installs a network sniffer on the hypervi-sor to monitor external traffic as well as inter-VM traffic. Implemented on Xen, it is able to detect the presence of the Zeus botnet on the guest VMs.
A hypervisor-assisted detection scheme is proposed in [7] using guest application and network flow characteristics.
This scheme first uses LibVMI to extract key process
feat-ures from the processes running within VMs and then uses
tcpdumptogether with theCoralReefnetwork packet analysis tool from Center for Applied Internet Data Analysis (CAIDA)
to extractnetworkflowfeatures.Theobtained featuresare
then used to train one-class SVM classifiers to detect
malwarepresencewithinguestVMs.Implementedon KVM,
theschemeisabletodetectwell-knownDistributedDenial
ofServiceandbotnetattackssuchasLowOrbitIonCannon
(LOIC)andZeus.
Thehypervisor-assisteddetectionisalsousedin
Access-Miner [8]. Implemented as a custom hypervisor,
Access-Miner monitors normal user behavior within the system
andcreatesaccessactivitymodelswhichareusedfor
anom-aly-basedmalwaredetection.Toensurethattheunderlying
hardware is protected, it intercepts the guest system call
requestsandusesapolicycheckermoduletodetermineifit
shouldaccessthesystemresource.
2.2SecurityAnalytics
Security Analyticsrefers to theapplication of analytics in
thecontextofcybersecurity[9]. Basedonavarietyofdata
collected from different points within an enterprise
net-work,securityanalyticsaimstodetectpreviously
undiscov-eredthreatsbyuseofanalytictechniques.
Commontechniquesofsecurityanalyticsinclude
cluster-ingandgraph-basedeventcorrelation.
2.2.1 ClusteringforSecurityAnalytics
Clusteringorganisesdataitemsinanunlabeleddatasetinto
groups basedontheirfeaturesimilarities [10].For security
analytics, clustering finds a pattern which generalises the
characteristicsofdataitems,ensuringthatitiswell
general-izedto detectunknownattacks. Examplesof cluster-based
classifiersinclude K-meansclusteringandk-nearest
neigh-bors, whichare usedin both intrusion detectionand
mal-waredetection.
Clustering is used for security analytics for industrial
control systems[11]in annetworkedcritical infrastructure
(NCI) environment. First, data outputs from various
net-worksensorsarearrangedasvectorsandK-means
cluster-ing is applied to group the vectors into clusters. The
MapReducemodelisthenappliedtothegroupedclustersto
findgroupingsof possible attackbehaviour,thusallowing
thedetectiontobecarriedoutefficiently.
In[12]an“attackpyramid”-basedschemeisproposedto
detect advancedpersistent threats (APTs)in a large
enter-prise networkenvironment.Based on threat tree modeling,
different planes(namelyhardware,user,network,
applica-tion)towhichanattackmaybelaunchedareplaced
hierar-chically withtheend goalplacedatthetop. First,outputs
fromallavailablesensorsinthenetwork(e.g.,networklogs,
executiontraces,etc)areputintocontexts.Then,intermsof
the contexts various suspicious activities detected at each
attack planeare correlated in a MapReducemodel, which
takes in all the sensor outputs and generatesan event set
describing potential APTs. Finally, an alert system
deter-minesattackpresencebycalculatingtheconfidencelevelsof
eachcorrelatedevent.
SecurityIntelligencetechNologyforBlockingAPT
(SIN-BAPT) [13] uses big data processing such as HDFS and
MapReduce together to detectthe presence of APTs in an
enterprise network environment. Used for anomaly-based
detection,theschemecollectslogdatafromdifferentsources
MapReduce model for feature extraction. Once organized into clusters, the data is then used to determine attack pres-ence according to pre-defined rules.
2.2.2 Graph-Based Event Correlation
Whileclusteringdeterminesattackpresencethrough
group-ingcommonattackcharacteristics,itislimitedin
establish-inganaccuratecorrelationwhichmayexistbetweenevents.
This makes itdifficult to accurately identify thesequences
ofeventsleadingtothepresenceofanattackwithinthe
net-work,aswellastheentrypointoftheattack.
Graph-basedevent correlationovercomesthislimitation
by representing the events from the logs obtained as
sequences in a graph. Given a collection of logs from
different pointswithinthenetwork(e.g.,firewalllogs,web
serverlogs,etc.),theseeventsarecorrelatedinagraphwith
the event features (e.g.,timestamp, sourceand destination
IP, etc.) represented as vertices and their correlations as
edges. This enablesthe accurate identification of theentry
point which an attack enters, as well as the sequences of
eventswhichtheattackundertakes.
Graphs-basedeventcorrelationisusedin BotCloud,a
bot-netdetectionsystemforlargeenterpriseenvironments[14].
Based ontheNetflowdata whichdescribethevarious
net-worktrafficflowsbetweenclients,theschemerepresentsthe
networkflowbetween clientsin theformof adependency
graph.ThegraphistheninputintoaMapReducemodelto
identifynetworkIPassociationsusing PageRank algorithm.
Graphs-based event correlation is presented in the
security framework designed to detect attacks within
critical infrastructures [15]. The scheme collects events
fromdiffer-ent sources within the network, and generates
a temporal graph model to derive different event
correlationsforthreatdetection.
Relationshipsbetweenfilesarerepresentedasa graphto
detectmalwarepresence[16].Theschemefirstcollectsfrom
theclientsthefilelistswhichdescribetheirmutual
relation-ships,anddeterminesiftherearepotentiallymalicious
rela-tionships.Thefileassociationsarethenusedtogeneratean
undirected weightedfile relationship graph,and based on
the graph a belief propagation classifieris trained. On the
datasetfromtheComodoCloudSecurityCenter,thescheme
achievedadetectionaccuracyof95.81percent.
2.3 Limitations of Existing Approaches
Existing approaches to detecting attack presence are limited in terms of their ability to detect threats in real-time as well as to scale across multiple hosts.
One of the limitations of existing security approaches stems from the use of a dedicated signature database for threat detection. This applies to approaches that feature a reg-ularly updated attack signature database for threat detection. Typically in the in-VM and outside-VM interworking approach, an in-VM agent detects and passes any suspicious file to the remote scrunity server, which uses the signature database to determine if it is a malware. The dependence on a regularly-updated signature database makes it limited in
detecting zero-day attacks. WhileBareCloud[17] andCloudAV
[4] attempt to get around this limitation by using multiple antivirus engines for threat detection, they are still limited in
detecting previously undiscovered attacks due to the post
factum datainupdatingthesignaturedatabase.Thisisfurther
exacerbated by an increased number of false positives
reportedbythedifferentantivirusengines.
Security analytics removes the need for signature
data-basebycorrelatingevents fromthecollectedlogs,butthey
still suffer from the post factum data in training for threat
detection. Typically BotCloud [14]and Nazca [18]collectdata
overlongperiodsoftime(usuallyovera24hourperiod)and
apply analyticsfor threatdetection. Whilealong periodof
time allows for a rich collection of data, that entails a
tendencyindetectingthreatswhichhavealreadytakenplace
over a breadth of time within the network. This makes it
difficult,ifnotimpossible,tofocusonimmediateeventsand
takeimmediateactionsagainstacompromisedpointwithin
thenetwork.
Another limitation of existingsecurity approaches isthe
centralized execution process. For instance, SINBAPT [13]
runs on a single host, collecting data from various points
withinthenetworkandanalysingthemasasinglecentralized
process.Whilecentralizedexecutionprocessisfeasiblein
net-work environments in which there is a single centralized
serverresponsibleformonitoringallnetworkcomponents,it
isinfeasibleforlargenetworkenvironmentsinwhich
multi-pleguestVMsarehostedondifferenthostsandattack
pres-encehastobecommunicatedtootherhostsinnearreal-time.
3
P
ROPOSEDA
PPROACH3.1 OverallFramework
Thebasicideaofourproposedapproachistodetectin
real-time any malware and rookit attacks via a holistic and
efficientuseofallpossibleinformationobtainedfromthe
vir-tualizedinfrastructure,e.g.,variousnetworkanduser
appli-cationlogs.Ourproposedapproachisabigdataproblemfor
thefollowingcharacteristicsofthenetworkanduser
applica-tionlogscollectedfromavirtualizedinfrastructure:
Volume: DependingonthenumberofguestVMsand
thesize of thenetwork, the amountof thenetwork
and user application logs to be collected canrange
fromapproximately500MBto1GBanhour;
Velocity: The network and user application logsare
collectedinreal-time,inordertodetectthepresence
of malware and rootkitattacks, accordingly the
col-lecteddata containingitsbehaviorneedsto be
proc-essedassoonaspossible;
Veracity: Due to the“lowand slow” approach that
malware and rootkit take in hiding their presence
withintheguestVMs,dataanalysishastorelyupon
eventcorrelationandadvancedanalytics.
Thedesignprinciples,whichareintegralinthedevelop-
mentofourBDSAapproachtoprotectingvirtualized
infra-structures,canbeelaboratedasfollows.
DesignPrinciple#1-Unsupervisedclassification:The
attack detection system should be able to classify
potentialattackpresence basedonthedata collected
fromthevirtualizedinfrastructureovertime.
Design Principle#2 - Holisticprediction: Theattack
detection systemshould be ableto identify potential
attacks by correlating events on the data collected
Design Principle # 3 - Real-time: The attack detection system should be able to ascertain attack presence as immediately as possible so as for the appropriate countermeasures to be taken immediately.
Design Principle # 4 - Efficiency: The attack detection
system should be able to detect attack presence at a high computational efficiency, i.e., with as little per-formance overhead as possible.
Design Principle # 5 - Deployability: The attack
detec-tion system should be readily deployable in produc-tion environment with minimal change required to common production environments.
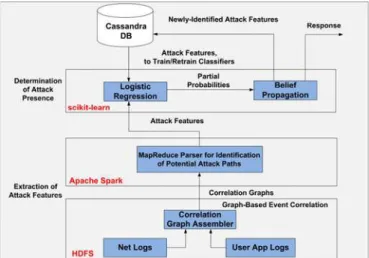
Fig. 1 illustrates the overall conceptual framework of our proposed big data based security analytics approach, with the different components highlighted in blue. Our BDSA approach consists of two main phases, namely
Extraction of attack features through graph-based
event correlation and MapReduce parser based iden-tification of potential attack paths, and
Determination of attack presence via two-step
machine learning, namely logistic regression
andbeliefpropagation.
Priortotheonlinedetectionofattacks,thereisactuallya
systeminitialization,inwhichofflinetrainingofthelogistic
regressionclassifiersiscarriedout,thatis,thestored
fea-turesareloadedfromthe Cassandra databasetotrainthe
logisticregressionclassifiers.Specifically,well-known
mali-ciousaswellasbenignportnumbersareloadedtotraina
logisticregressionclassifiertodetermineiftheincoming/
outgoingconnectionsareindicativeofanattackpresence.
Likewise,well-knownmalwareandlegitimateapplications
togetherwiththeirassociatedportsareloadedtotraina
logisticregressionclassifiertodetermineifthebehaviorof
anapplicationrunningwithintheguestVMisindicativeof
anattackpresence.Thesetrainedlogisticregression
classi-fiersarereadyforonlineuse,upontheextractionofnew
attackfeatures,todetermineifthepotentialattackpathsare
indicativeofattackpresence.
IntheExtractionofAttackFeaturesphase,first,itcarries
out Graph-Based Event Correlation. Periodically collected
fromtheguestVMs,networkanduserapplicationlogsare
stored in the HDFS. By assembling the information
con-tainedin thesetwologs, theCorrelationGraph Assembler
(CGA)formscorrelationgraphs.
Then,itcarriesouttheIdentificationof PotentialAttack
Paths.AMapReducemodelisusedtoparsethecorrelation
graphsandidentifythepotentialattackpathsi.e.,themost
frequentlyoccurringgraphpathsintermsoftheguestVMs’
IP addresses. Thisis basedon theobservationthata
com-promisedguestVMtendstogeneratemoretrafficflowsasit
triestoestablishcommunicationwithanattacker.
IntheDeterminationofAttackPresencephase,two-step
machine learning is employed, namely logistic regression
andbeliefpropagationareused.Whiletheformerisusedto
calculate attack’s conditional probabilities with respect to
individualattributes,thelatterisusedtocalculatethebelief
ofanattackpresencegiventheseconditionalattributes.
Fromthepotentialattackpaths,themonitoredfeaturesare
sorted out and passed into their logistic regression
clas-sifiers to calculate attack’s conditional probabilities with
respect to individual attributes. The conditional
probabili-ties with respect to individual attributes are passed into
beliefpropagationtocalculatethebeliefofattackpresence.
Onceattackpresenceisascertained,theadministratoris
alarmedoftheattack.Furthermore,the Cassandra databaseis
updatedwiththenewly-identifiedattackfeaturesversusthe
classascertained(i.e.,attackorbenign),whicharethenused
toretrainthelogisticregressionclassifiers.
3.2ExtractionofAttackFeatures
3.2.1 Graph-BasedEventCorrelation
The IP addressesof theguest VMsare used to obtainthe
memory process lists on the VMs as well as the ports to
whichtheprocessesarelistening.
TShark isusedtoobtainthenetworklogscontainingthe
traffic flows of the guest VMs. Specifically it collects the
source and the destination IP addresses along with their
respectiveportnumbers.Italsoundertakestheremote
exe-cutionofthenetstatcommandto obtaintheguestVMs’
memoryprocesslists.
The network logs contain connection entries describing
theguestVMs’internalaswellasexternalnetwork
connec-tions, namelythesource anddestination IPaddresses (i.e.,
IPsource and IPdestination) as well as the port numbers (i.e.,
Portsource andPortdestination)used.Eachentryinthenetwork
logsisoftheformatasbelow:
net log:¼ hIPsource; Portsource; IPdestination;
Portdestinationi: (1)
Theuserapplicationlogs,ontheotherhand,contain
pro-cess entries detailing the applications running within the
guestVMsandtheportnumbersonwhichtheapplications
arelistening for connections.Each entry in theapplication
logsisoftheformatasbelow,
app log:¼ hIPguest; Appguest; UserIDApp;
PortAppi;
(2)
where IPguest refers to the guest VM’sIP address,Appguest
refers to the application running on the VM, UserIDApp
refers to the user ID to which the user application is
Fig. 1. Conceptual framework of the proposed big data based security analytics (BDSA) approach.
running, and PortApp refers to the port opened by the
application.
Once obtained, the log entries are used to form a correla-tion graph based on the following observacorrela-tions. The first observation is that a compromised guest VM tends to com-municate more frequently with other guest VMs, resulting in an increase in the network traffic containing its IP address. The second observation is that the communication means of the malware running on the compromised VM is through its execution on it and listening for external connec-tions. In the light of these two observations a correlation graph is formed which best describes the guest VMs’ behav-ior by assembling the information obtained of the network and user application logs.
Before it proceeds to form the correlation graph, first only those entries with the guest VMs’ IP addresses either as the source or the destination are filtered out of the network logs. This eliminates the routine traffic flows which periodi-cally check the status of the host high performance cluster
(HPC) by applications such asApache Hadoop.
The filtered network log entries are then assembled with the user application logs according to the guest VMs’ IPs and the port numbers which are opened by the user applica-tions. A path is grown with the monitored features as
verti-ces and their correlations as edges of the form hIPsource,
Portsource; IPdestination; Portdestination,Appguest,PortApp,UserIDAppi.
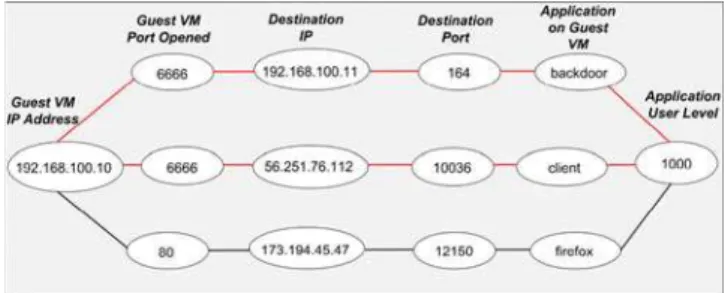
As a result a correlation graph is formed an example of which is shown in Fig. 2.
The formed correlation graph, consisting of multiple paths is then stored in the HDFS on the HPC node as a new entry, called correlated log, of the format as below:
correlated log:¼ hIPsource; Portsource; IPdestination;
Portdestination; Appguest;
UserIDAppi:
(3)
3.2.2 MapReduce Parser for the Identification of Potential Attack Paths
Identification of potential attack paths is carried out by pars-ing the correlation graph with a MapReduce model. MapRe-duce is a distributed programming model which consists of
two processes namelyMapandReduce.
In theMapprocess, key-value pairs of the form (ki,vi) are
sorted from the correlation graph, where ki denotes the
monitored traffic flow whileviis the count of occurrence of
the traffic flow in the graph. Taking the correlation graph in
Fig. 2 as an example, theMapprocess represents each path
in the graph as a keyki and its occurrence as a valuevi as
shown in Snippet 1.
Snippet 1. (path,count)pairsofcorrelationgraphsorted
inMapprocess (<192.168.100.10, 6666, 192.168.100.11, 164, backdoor, 1000>, 1) (<192.168.100.10, 6666, 58.251.76.112, 10036, client, 1000>, 1) (<192.168.100.10, 80, 173.194.45.47, 12150, firefox, 1000>, 1)
Inthe Reduce process,thekey-valuepairsobtained dur-ingthe Map processareunified.Withthesameexamplethe
Reduce process analyzes the intermediate key-value pairs
generatedfromthe Map process,andunifiesallthose
key-value pairs, aggregating their occurrence counts, if their
sourceIPsaswellassourceportsarethesameregardless
of theotherelementsonthepath. Thisgenerates aset of
new-variantkey-valuepairs(k0
i,v0i),wherek0irepresentsthe
unifiedpathforadistinctivesourceIPandport,whilev0
iis
the total occurrence counts within the graph. For the
example correlation graph above, the (unified path,
aggregatedcounts)pairsareshowninSnippet2.
Snippet 2. (unifiedpath,aggregatedcounts)pairsfrom
Reduce process
(<192.168.100.10, 6666, .., .., .., ..>, 2)
(<192.168.100.10, 80, 173.194.45.47,
12150, firefox, 1000>, 1)
Flaggedupbythe MapReduce parser’soutput,anygraph
pathswithanoccurrencecountgreaterthanoneare
poten-tialattackpathsand arethus picked upand passed onto
the determination of attack presence phase. For the
examplecorrelationgraphabove,thepotentialattackpaths
areidentified(markedinred)asshowninFig.3.
3.3 DeterminationofAttackPresence
The potential attackpaths identified fromthe correlation
graphasflaggedupbytheMapReduceparsercanbe
read-ilyretrieved intothedifferent attackfeatures.Wereferto
thestrippingprocess asattackfeature Sorteroutof attack
paths. For the determination of attack presence two-step
machine learning is used, namely logistic regression and
beliefpropagation.
Logisticregressionprovidesaquickmeansof
ascertain-ingwhetheragiventestdataprojectstooneofthetwo
pre-definedclasses,aswellassupportingthequicktrainingofa
Fig. 2. Correlation graph assembled from network and user logs. Fig. 3. Potential attack paths in the correlation graph as flagged up by MapReduce parser.
classifier given a training set, ðXYÞ, which denotes a series of features versus classes. This makes it suitable for calculating attack’s conditional probabilities with respect to (wrt) individual attributes. Furthermore, whenever an attack presence has been ascertained, the logistic regression classifiers can be quickly retrained in real-time using the newly-identified attack features for future attack detection.
Belief propagation takes into account the conditional probabilities in order to calculate the belief of attack pres-ence within the virtualized environment. This allows for a holistic approach to attack detection, ensuring that the cal-culated belief accurately reflects the probability contribu-tions from the individual attributes.
The determination of attack presence consists of two phases, i.e.,
Training and retraining of logistic regression
classifiers
Attack classification using belief propagation
Conditional probabilities with respect to the attributes are calculated based on the features observed from the logs using the trained logistic regression classifiers. Using any of the obtained conditional probabilities with respect to indi-vidual attributes alone is not enough to obtain a complete perspective of the attack probability. Therefore, observa-tions of all attributes should be taken advantage of to ascer-tain attack presence. Belief propagation is used to calculate the belief of an attack by taking into consideration attack’s conditional probabilities with respect to all the attributes.
3.3.1 Training and Retraining of Logistic Regression Classifiers
Used in binary classification problems, logistic regression provides a quick means of training a classifier which is used to determine if a particular test data projects to one of the two pre-defined classes.
Logistic regression operates as follows. LetC be a set of
two pre-defined classes, i.e., fc;cg or f0;1g (e.g., fattack;
benigng). Suppose there are n independent features and a
feature data series is of the form x¼ ½x1;x2;. . .;xnT. Let
X¼ fxð1Þ;xð2Þ; ::xðNÞgbe the series ofNobtained data of
fea-ture data seriesx, wherexjdenotes thejthsampled data of
x. Let Y ¼ fyð1Þ; yð2Þ;. . .:; yðNÞg be the corresponding class
set specifying which one of the two pre-defined classes c
andceach featurexprojects to.
Four attributes are defined to characterize a potential
attack, namely incoming network connections (in connect),
outgoing network connections(out connect), unknown
binary executions (unknown exect) and opened ports
(port change). While the monitored features refer to the sen-sor data out of the computer system being monitored, attrib-utes are defined to characterize the situation where an attack may present. The first two attributes are used to determine attack presence based on their source and desti-nation port numbers, while the latter two attributes are used to determine attack presence based on the applications running within the guest VMs as well as the ports opened by the applications.
In order to determine the presence of the attack with respect to the attributes, logistic regression classifiers are trained for analyzing the source and destination ports as
well as the applications and the ports which are opened
in theguestVMs.
LogisticregressioncalculatestheprobabilityPofattackat
which a feature x projects to one of the two pre-defined
classesusingthe logit functionasbelow:
1
P ðy ¼ cjxÞ ¼
1þe ; (4)
wherev0;v1;v2;. . . ;vnaretheweightingcoefficients,and
¼v0þv1x1þv2x2þ þvnxn: (5)
Inthecontextof ourBDSAapproach,weset twologistic
regression classifiers LRapp and LRport using Eq. (4). Once
trained, beforehand in a batch, and retrained with
newly-identified attack features, the conditional probabilities with
respect to individual attributes are calculated using the
respectivelogitfunctions.
To train a logistic classifier for port analysis we have
gatheredasetof300portnumbersusedbydifferentmalware
applications as well as another set of 300 ports used by
legitimateapplications(e.g.,SSH)tobethetrainingdata set.
While the malware port numbers are obtained from SANS
[19], the port numbers used by legitimate applications are
obtainedfromInternetAssignedNumbersAuthority(IANA)
[20].
In order to train the logistic regression classifier, the
obtainedports arefirstcategorizedintotwogroups,namely
sysportcontainingthelegitimateportnumbers,andmalware
port containingthemalware portnumbers. Each oftheport
categoriesis thenencoded withanumericalvalue, withsys
portassignedavalueof1whilemalwareportavalueof2,so
thattheycanberepresentedasfeaturevectorsxportduringthe
trainingofthelogisticregressionclassifier.
Theportnumbersaretreatedasnumericalvalues,inorder
to cater for the port numbers which do not deviate
significantlyfromthoseinthetrainingsetandthusbelongto
thesameport category. For example thenginx web server
listensforconnections onport 80when deployedin aguest
VM without any web server running on it prior to its
deployment.When deployedon a guestVM whichalready
hasanotherwebserver(e.g.,Apache)runningonit,however,
itneedstoupdate itsdefaultport toanother value(e.g.,82)
sincetheApachewebserveralsolistensforcon-nectionson
port 80 to avoid causing access conflicts. Therefore, by
treatingtheport numbersas numericalvaluesinthefeature
set,itallowsminorportchangessuchasthistobeclassifiedas
legitimateportnumberswithoutmisclassification.Duringthe
experiments,wefindthatthetrainedportlogisticregression
classifierisabletoidentifyaportnumberasbelongingtothe
sameportcategoryifitdoesnotdeviatefromthetrainingset
portbeyond2(i.e.,port82isclassifiedasalegitimateportdue
toitscloseproximitytoport80).
Table 1 shows the port numbers together with their
encodedportcategoryvaluesandtheirclassifications,with0
representinga legitimateport and1representingamalware
port.
UsingtherepresentationasshowninTable1,atrainingset
ðXport YportÞ are created. Xport consists of a series of
feature vectors xporteach of which is of theform xport¼T
corresponding class which eachxportprojects to. Using the
first entry in Table 1 as an example, its feature vector
xsys port is represented as ½22;1T while its corresponding
class vectorysys portis represented as 0.
The obtained training set Xport = fxð1Þ;xð2Þ;. . .;xðiÞg
together with its corresponding class vector Yport = fyð1Þ;
yð2Þ;. . .; yðiÞg are then used to train a logistic regression
classifier using scikit-learn which uses Eq. (6) to train the
classifier. The training set ðXportYportÞ are stored in the
Cassandradistributed database
PðAttackjxportÞ ¼
1
1þe port; (6)
where,
port¼v0þv1x1þv2x2þ þvn:xn (7)
Similarly, to train a logistic regression classifier for appli-cation analysis we have identified benign
internet-interfac-ing user applications (e.g., firefox for web browsing,
nginxfor web server) as well as those applications that are
frequently used by malware and botnet programs (e.g.,
net-cat). The identified applications are categorized into three
categories: web_app, sys_util, and unknown depending on
their usages. Each of the application category is then
encoded with a numerical value with web_app assigned a
value of 1,sys_utila value of 2, andunknowna value of 3.
Similarly each of the user ID is encoded with a numerical
value, with user ID 0 (i.e.,rootuser) assigned a value of 0
and user ID 1000 (i.e., non-rootuser) assigned a value of 1.
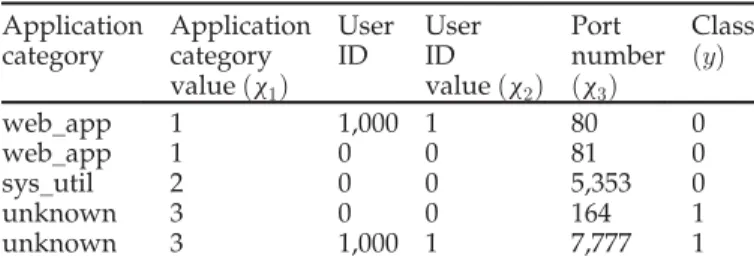
Table 2 shows the application categories and the user IDs together with their respective category values and classifica-tions, with 0 representing a legitimate application and 1 rep-resenting a possible malware application.
Once the features are encoded with numerical values, a
training data setðXappYappÞthen is formed ,Xappthe series
of feature data seriesxapp¼ ½xapp category value;xuser id value;xportT
together withYappcontaining the corresponding class which
each xapp projects to. Using the first entry in Table 2 as an
example, its feature vectorxweb appis represented as½1;1;80T
and its corresponding class vectoryweb appis represented as 0.
The training set Xapp =fxð1Þ;xð2Þ;. . .;xðiÞgtogether with
its corresponding class vector Yapp = fyð1Þ; yð2Þ;. . .; yðiÞg
are then used to train a logistic regression classifier using
scikit-learn which uses Eq. (8) to train the classifier. The
training setðXappYappÞare stored in theCassandra
distrib-uted database as separate column tables
PðAttackjxappÞ ¼1 1
þe app; (8)
where,
app¼v0þv1x1þv2x2þ þvnxn: (9)
Itshouldbenotedthatforeachlogisticregression
classi-fier, it should have its own weighting coefficients,
corre-spondingtherespectivefeaturevector.Duringthetraining
ofthelogisitcregressionclassifersforourproposedBDSA
approach, the scikit-learn machine learning
package uses the Coordinate Descent [21] algorithm to
automatically calculate theweights v0;v1;v2;::;vj for a
giventrainingset ðXYÞ.
Unknown ports and application are ascertained using
the trained logistic classifiers. The column tables of the
respective features in the Cassandra database are then
updatedandusedtoretrainthelogisticclassifiersforfuture
classifi-cation. The trained port and application logistic
regressionclassifiers areused to calculate theconditional
probabilities which are input into belief propagation,
as inputs theirrespectivefeaturevectors.
3.3.2 Attack Classification Using Belief Propagation
Presenceof attackisdetermined byanalyzingfour
attrib-utes, namely incoming network connections (in_connect),
outgoing network connections (out_connect), unknown
binary executions (unknown_exect) and opened ports
(port_change).Thisisbasedontheobservationthatthe
pres-enceofanattacktendstoresultinchangesinthese
attrib-utes,astheinfectedguestVMattemptstoestablishexternal
connections withthe remoteattacker. With eachattribute
represented by a node, they form a Bayesian network
asillustratedinFig.4a.
Used in graphical models such as Bayesian networks
and MarkovRandomFields(MRF),belief propagation is
used calculate the probability distribution (i.e., belief)
of a target node’sstateusing message passing [22]. Given
a node v in a Bayesiannetwork, thebelief BELðvÞ ofits
stateiscalculated usingthemarginalprobabilitiesfromits
neighbouringnodes. Beliefpropagationtakesintoaccount
theneighbouringnodes’
TABLE 1
Examples of Training Set: Ports versus Classes
Port numberðx1Þ Port category Port category
valueðx2Þ ClassðyÞ 22 sys_port 1 0 80 sys_port 1 0 8,080 sys_port 1 0 6,666 malware_port 2 1 1,090 malware_port 2 1 7,777 malware_port 2 1
Fig. 4. (a) Bayesian network of attributes, (b) Bayesian network with fac-tor graphs.
TABLE 2
Training Set: Applications versus Classes
Application category Application category valueðx1Þ User ID User ID valueðx2Þ Port number ðx3Þ Class ðyÞ web_app 1 1,000 1 80 0 web_app 1 0 0 81 0 sys_util 2 0 0 5,353 0 unknown 3 0 0 164 1 unknown 3 1,000 1 7,777 1
individual influence in calculating the belief ofv’s state, and is therefore used in our BDSA approach for determining attack presence.
Given feature vectors (i.e.,xin connect,xout connect;xport change,
xunknown exect) which are of the following form, xin connect¼ ½xport number;xport category valueT xout connect¼ ½xport number;xport category valueT xport change¼ ½xapp category value;xuser id value;xportT xunknown exect¼ ½xapp category value;xuser id value;xportT;
(10)
the port and application logistic regression classifiers
(i.e.,LRportandLRapp, respectively) which are trained using
scikit-learnproduce as outputs their respective condi-tional probabilities which calculate the probabilities of each feature belonging to each of the two pre-defined classes
(i.e.,AttackandBenign) which are of the form as below:
Pport changeðAttackjxport changeÞ ¼
PAttackport change; PBenignport change
Punknown exectðAttackj
xunknown exectÞ ¼
Punknown exect
Attack ;
PBenignunknown exect
Pin connectðAttackjxin connectport Þ ¼
PAttackin connect; Pin connect
Benign
Pout connectðAttackjxout connectport Þ ¼
PAttackout connect; Pout connect
Benign
:
(11)
PAttackrepresentstheconditionalprobabilitywithrespect
to an attribute being indicative of an attack, and PBenign
beingtheconditionalprobabilitywithrespecttoanattribute
beingindicativeofabenign.Intuitivelyifagivenattribute
projectstoanattack,thenitsattackprobability(i.e.,PAttack)
would be much higher than its benign probability (i.e.,
PBenign)andthereversewouldbetrueifitwerebenign.
Thetrainingsetforxin connectandxoutconnectcorresponds
to theentries asshowninTable1,andthetrainingset for
xportchange and xunknownexect corresponds to the entries as
showninTable2.
Whilethetrainedportandapplicationlogisticregression
classifiersprovidetheconditionalprobabilitieswithrespect
toindividualattributes,eachofthemonitsownisnotable
toprovideacompletepictureof attackswithinthe
virtual-izedenvironment.Therefore,beliefpropagationis applied
to calculatethebelief inthepresenceof attackgiventhese
conditionalprobabilities.
To applybeliefpropagation,themonitoredfeaturesare
firstrepresentedasnodesinaBayesiannetworkasshown
inFig.4a.TheBayesiannetworkprovidesarepresentation
of therelationship betweendifferentfeatures in
determin-ing attack presence. Each node consists of a Conditional
Probability Table(CPT)containing the marginal
probabili-tiesofeachpossiblestate(i.e.,attackorbenign)withrespect
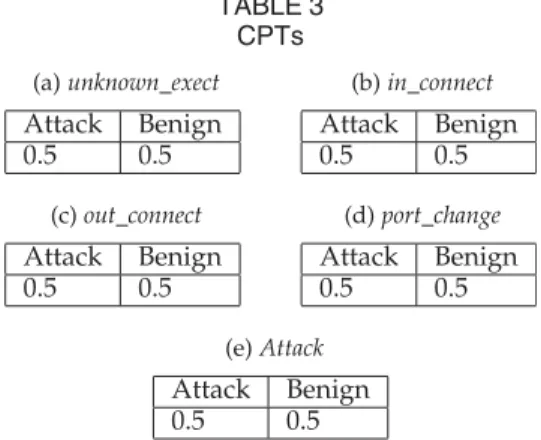
totheattribute.TheinitializedCPTsofeachofthenodesin
the Bayesian networkare shown in Tables 3a, 3b, 3c, 3d,
and3e.TheinitialisedvaluesintheCPTsofeachnodeact
asplaceholderstoensureconsistencypriortotheexecution
ofourBDSAapproach.
Duringtheexecutionoftheapproach,however,theCPTs
of the monitored features are updated with therespective
attack and benign probabilities (i.e., PAttack and PBenign)
which are calculated by the trained port and application
logisticregressionclassifiers.
AfterthemarginalprobabilitiesarerepresentedasCPTs,
thebelief(BELAttack)ofthe Attack node’sstateisthen
calcu-lated usingmessage-passing.This involvespassing the
mar-ginalprobabilitieswithrespecttoindividualattributes(i.e.,
portchange, unknownexect, inconnect, and outconnect) into the Attack node in the identified Bayesian network.
Theirattackprobabilities(i.e., ½PAttack)arethenaggregated
inthe Attack nodebeforecalculatingBELAttackasbelow:
BELAttack¼Pport changeðAttackjxport changeÞ Punknown exectðAttackj
xunknown exectÞ Pin connectðAttackj
xin connectport Þ Pout connectðAttackjxout connectport Þ:
(12)
Howeverone of the limitations of this approach is the
sizeoftheCPTtablefortheAttack node.Giventhenumber
ofnodesinvolved,the Attack nodehastomaintain32 entries
(25
¼ 32) containing the conditional probability
dis-tributionsofeachofthefournodeswithintheBayesian
net-work as well as its own attack probabilities obtained
throughapplying Eq.(12).Inadditionitalsomakesit
diffi-cultto update theCPT entries within theAttack node
effi-ciently toreflectthe updatedCPT valuesof theindividual
nodes, as they are updated during the execution of our
BDSA approach. The individual CPTs of the attributes as
wellasthejointconditionalprobabilitiesbetweenthemare
thereforerepresentedasa factor graph [23].
Usedin factorgraphsto representthestructureof a
fac-torization, factor graphs in aBayesian networkencodethe
individual as well as joint Conditional Probability Tables
(CPTs) among the nodes in the Bayesian network [23].
Given belief propagation’s message-passing formula to cal
culating marginal probabilities, representing the CPTs as
factor graphs allows the changes in the local CPTs to be
TABLE 3 CPTs
tracked more efficiently during the execution of the algorithm.
In the updated Bayesian network identified in Fig. 4b, the factor graphs are illustrated by red square boxes together.
Factor graphsFexe,Fin,Fout, andFportrepresent the CPTs of
the individual attributes, Fattack represent the joint CPT
between unknown_exect,in_connect, and Attack which is of
the following form as shown in Table 4.
The use of factor graphs reduces the number of entries in
the joint conditional probability distributions for theAttack
node (denoted by Fattack) since it only needs to track 8
entries representing the conditional probabilities between 3
nodes (i.e.,unknown_exect,in_connect, andAttack) as shown
in Table 4. This makes it easier to update its conditional probability values during the execution of our BDSA approach.
The process of belief propagation can further be explained, with an example of the potential attack paths as shown in Fig. 2.
Given a potential attack path as shown in Snippet 3, the
logistic regression classifiers for unknown exect as well as
in connectdetermine if the application and the incoming con-nection, respectively, are indicative of a malware attack
pres-ence. First, the application details (i.e., backdoor, unknown,
1000, 164) and the incoming connection details (i.e., 192.168.100.10, 6666) are extracted from the attack path. They are then represented as feature vectors and put as test data to their respective classifiers. Similarly, for the logistic regression
classifiers forout connectandchange port, the outgoing
con-nection (i.e., 192.168.100.11, 164) and application port details
(164,malware port) are extracted and then put as test data to
their respective logistic regression classifiers.
Snippet 3.Example of potential attack path
(<192.168.100.10, 6666, 192.168.100.11, 164, backdoor, 1000>, 1)
Using the updated Bayesian network with factor graphs, the message-passing approach of belief propagation works as follows. Upon receiving the marginal probabilities from their respective logistic regression classifiers, each of the nodes in
the updated Bayesian network calculates a messagemwhich
represents the probability of their respective attributes being
an attack (Attack) or benign (Benign). The messages m are
passed into theAttacknode to calculate beliefBELAttackof its
state and is calculated as below, where eachVcorresponds
to each of the nodes in the Bayesian network (i.e.,
V1¼unknownexect, V2¼inconnect, V3¼outconnect, andV4¼portchange)
mexe!AttackðAttackÞ ¼
X exe2V1 Fðexe; attackÞ min!AttackðAttackÞ ¼ X in2V2 Fðin; attackÞ mout!AttackðAttackÞ ¼
X
out2V3
Fðout; attackÞ mport!AttackðAttackÞ ¼
X port2V4 Fðport; attackÞ: (13) mattack¼ unknown exect
Whilethemessagesfromtheoutconnectandportchange
(i.e.,moutand mport,respectively)directly gointotheAttack
nodeforcalculation,themessagesfromunknownexectand
in connect (i.e., mexeand min, respectively) arepassed into
factornodeFattacktocalculatetheirjointconditional
proba-bilitydistributionwhichreflectstheirmutualrelationship.
Thisis done bymultiplyingeachentry in Fattackwithmexe
andmin,beforesummingoverallpossiblestates(i.e.,Attack
and Benign) of the unknown_exect and in_connect nodes.
ThisresultsinthegenerationofamessagemFattack whichis
calculatedasbelow,andpassedintothe Attack node
X X
in connect
Fattackðunknown exect; in connectÞ mexemin:
(14)
Using the probability values calculated by the
outconnect and change port nodes(i.e., mout and mport
respectively),thebeliefBELAttackiscalculatedasbelow:
BELAttack¼mportmFattackmout: (15 Algorithm1providesthepesucodeofthebeliefpropa-
gationalgorithmwhichisusedinourBDSAapproach.
Algorithm 1.Belief Propagation for BDSA
Input:Pport change,Punknown exect,Pin connect, andPout connect
1: Initialize:Create the Bayesian network of attack features
using factor graphs as shown in Fig. 4b
2: Set the factor graphsFexe,Fin,Fout, andFportwith the
placeholder CPTs as shown in Tables 3a3e.
3: whileTruedo
4: UpdatethefactorgraphsFexe, Fin,Fout,andFport with
therespectiveconditionalprobabilitiesPAttackandPBenign.
5: Calculatemexe!Attack,min!Attack,mout!Attack, and
mport!Attack
6: Forunknown exectandin connect, calculateFattack
using Eq. (14).
7: CalculateBELAttackusing Eq. (15).
8: ifBELAttack < lower beliefthen
9: Alarm “attack presence”.
10: Update the tables inCassandraDB with
newly-identified attack features.
11: End do
12: End
Atthe initialization phase, theprior probabilitieswith
respectto individualattributes areassignedvalues based
on the initial observations obtained offline. During the
lifetimeoftheexecutionoftheBDSAapproach,the
TABLE 4
Joint CPT BetweenUnknown_Exect,
in_Connect, andAttack
nodeunknown exect nodein connect nodeAttack
Attack Attack Attack
Attack Benign Attack
Benign Attack Attack
Benign Benign Attack
Attack Attack Benign
Attack Benign Benign
Benign Attack Benign
probabilities contained in the factor nodes are updated based on the updated logistic classifiers values.
3.4 Overall Algorithm of BDSA
Our BDSA approach can be formulated in pseudocodes as shown in Algorithm 2. The overall information flows of our BDSA approach can be illustrated as in Fig. 5.
Algorithm 2.Security Analytics in BDSA
1: Initialize:Obtain benign and malicious parameters of the
attack features fromCassandraDB.
2: Train classifiers for monitored features using Logistic Regression.
3: whileTruedo
4: Collect network and user application logs from guest
VMs.
5: Filter network log entries using the guest VMs’ IP addresses.
6: Form correlated_log.
7: Use correlated_log to form a correlation graphG.
8: Input G into MapReduce parser to identify potential
attack pathsfattack pathsg, which is a sub-set of all graph paths as shown in Fig. 3.
9: foreachattack pathinfattack pathsgdo
10: i 0.
11: foreach monitored featuretfeatureinattack pathdo
12: CalculatePport change,Punknown exect,Pin connect, and Poutconnect
13: PassPport change,Punknown exect,Pin connect, and PoutconnectintoStep.4ofAlgorithm1.
14: End do
15: End do
16: End
The execution of the proposed BDSA approach begins by loading all well-known malicious as well as benign port numbers from the distributed Cassandra database. Both of these port types are then used to train a classifier using using logistic regression. This allows the proposed approach to determine on-the-fly the probability of an unknown port being malicious, before passing it to the belief propagation framework for final aggregation.
A trained logistic classifier is used to determine if any of the attributes are malicious or benign, before passing their respective probabilities to the belief propagation process for Fig. 5. Information flows in our BDSA approach.
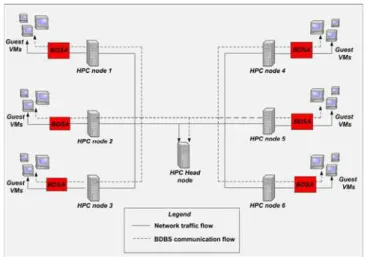
Fig.6.Testbedsystemtopology.
final probability aggregation. Belief propagation process
takes attack’s conditional probabilities with respect to
individual attributes to calculate the belief of attack
presence,taking intoaccounteachconditional probability
valuesto ensurethatthevalueobtainedis notinfluenced
onlybyanyconditionalprobabilityalone.
4
E
XPERIMENTALE
VALUATION4.1 TestbedSetup
Theproposedbigdatabasedsecurityanalyticswas
imple-mentedusingPython.Forexperiments,BDSAisrunonthe
HPCservernodesrunningUbuntu14.04intheon-campus
Virtualiszation Open Technology Research (VOTER)
net-work.Fig.6illustratesthetestbedsetupinprototypingthe
proposedBDSAapproach,whilethesoftwarestackoneach
HPCnodeisillustratedinFig.7.Eachoftheseservers
con-sistsofanIntelXeonquadcoreprocessorat2.66GHzalong
with12GBsofmemory,withLinuxkernelversion3.18.18
(64-bit)runningonit.Avirtualizationenvironmentisfirst
setupusingKernel-basedVirtualMachine(KVM)oneach
oftheHPCnodestoenablemultipleguestVMstoberun
on them, as well as support their migration across the
nodes.ApacheHadoopistheninstalledontheservernodes
to support distributed log storage, and Apache Spark is
installed to provide real-time data collection and
MapReduceparsing.Cassandracolumnardatabasesystem
is installed on top of it to support distributed storage of
identified
malicious applications and ports, as well as the real-time
re-training of the logistic regression classifiers. Finally the
sci-kit-learnPython machine learning package is then installed on the nodes to enable the creation of logistic regression classifiers for the BDSA approach.
Based on our experiments, an attack path is considered
malicious if the beliefBELAttackcalculated from belief
prop-agation is below the thresholdlower belief¼0:2.
The BDSA approach is evaluated by creating a guest VM running CentOS 6.5 as well as another two guest VMs run-ning Ubuntu 14.04 (64-bit) on one of the aforementioned HPC server nodes. Aspects for evaluation include the ability to detect both userspace malware as well as kernel-level rootkit attacks and the time taken to detect the presence of attacks within the guest VMs.
4.2 Detection of Userspace Malware and
Kernel-Level Rootkits
The ability of the BDSA approach to detect different mal-ware attacks is evaluated by executing the two userspace malware programs as well as the two kernel-level rootkits on the guest VMs. The malware and rootkits are taken from PacketStorm [24] as shown in Table 5. They were selected due to the availability of their source code, which enables the severity of their attacks to be modified and tested against our BDSA approach.
4.2.1 Detection of Userspace Malware
Also known asapplication-levelmalware, userspace malware
runs at the application-level of the guest operating system alongside other legitimate applications. The ability of our BDSA approach to detect userspace malware is evaluated by executing the aforementioned userspace malware on the guest VMs.
In order to run the userspace malware, a test scenario is set up, that is, one guest VM acts as an attacker while another guest acts as an attack victim. The attacker VM is then made
to listen to different non-standard port numbers using
net-cat, and then runs the reverse shellcode on the victim VM. The same test scenario is used for creating a Command & Control (C & C) botnet, by running the server component of
thebotnetontheattackerVManditsclientcomponentonthe
guestVM.Inbothofthetestscenarios,theuserspacemalware
is executed as is with only the hard-coded destination IP
addressesandtheportnumbersmodified.
Both userspace malware programs are executed 5 times
withuptothreeguestVMs.Inallcases,ourBDSAapproachis
able to detect them through monitoring the communication
flowsbetweenthemaswellastheportswhichareopenedon
theguestVMs.
4.2.2 DetectionofKernel-LevelRootkits
While userspace malware runs at the application-level
alongside other legitimate applications, kernel-level rootkits
run within the kernel of theoperating system. Rootkit
nor-mallyproceedsintwosteps.First,rootkitmakesattemptsto
gainprivilegedlevel(root)accessintotheoperatingsystem.
Then, it installs itself into the operating system kernel as a
LoadableKernel Module(LKM). Becauseitis theprivileged
level atwhich they are executed,rootkits aredifficult to be
detectedusingtraditionalapplication-levelmalwaredetection
approaches.
The ability of our BDSA approach to detect kernel-level
rootkitsisevaluatedbyexecutingtheXingYiQuan and Azazel
rootkitsontheguestVMs. Theserootkits takecontrol ofthe
guest VM by modifying the underlying system call table
(sys_call_table) entries and establishing external net-
work connections using the Netfilter kernel module, which
thusmakesitdifficultforapplication-levelfirewallstodetect
thecommunicationflows.However,while XingyiQuan isnot
persistentacrossreboots Azazel ispersistentintheguestVM’s
kernelacrossboots.
As inthecaseforuser-levelmalwarein orderto run
root-kits, a client-server test scenario is set up, that is, one
guest VMacts as an attacker while another VM acts as an
attack victim. The rootkits are then run on the client,
with the attacker VMmade to listen for connections using
netcat.
Both rootkits areexecuted 5 times with up to threeguest
VMs.Inallcases,ourBDSAapproachisabletodetectthem.
By remotely executing the netstat command at theroot
evel, our BDSA approach is able to detect the
applications aswellastheportswhicharebeingopenedby
therootkits.
4.3 MeasurementoftheAverageDetectionTime
Inorderto measuretheamountoftimetakenforourBDSA
approachtodetectattackpresenceintheguestVMs,the two
userspacemalwareprogramsas wellasthetwokernel-level
rootkitstakenfromPacketStorm[24]asshowninTable5are
executedontheguestVMs.Thetestsarecarriedoutin3cases,
namely with 1 guest VM, with 2 guest VMs, and with 3
guestVMs,respectively.
In each test first the malware programs and rootkits are
executed in their respective execution spaces on the guest
VMs,withtheBDSAapproachrunningontheHPChost. The
malware programs and rootkits are executed on the guest
VMs, and the detection time for each attack execution is
recordedaccordingly.ThedetectiontimeDofonetestisthe
summationof therecorded times aftertheexecution of the
malwareandrootkits,thatis,
D¼Tmalware1þTmalware2þTrootkit1þTrootkit2: TABLE 5
Malware and Rootkits Tested
Malware/ Rootkit
Category Execution space on guest VM
Characteristics Reverse
shellcode
Malware User space Establishing an
external reverse shell connection
C & C botnet Malware User space Creating a
master-slave botnet connection
XingYiQuan Rootkit Kernel space Executing in
the guest VM’s kernel and establishing an external connection
Azazel Rootkit Kernel space Executing in the
guest VM’s kernel and establishing an external connection
After the execution of each of the malware or rootkit in each test an interval of wait for approximately two minutes is taken before the test is repeated for the next time. Given the different execution space in which the tested malware and rookits operate on the guest VM, this inter-test waiting helps to prevent the detection time from being affected by caching, typically employed by the guest OS to store fre-quently triggered instructions to facilitate faster execution.
The tests are repeated 10 times consecutively, with an interval of wait between the two tests. The 10 times of the consecutively repeated tests are set as one round. For each case of 1, 2, and 3 VMs 5 rounds of tests are carried out. After each round of tests, a cease of attacks for approxi-mately two minutes is taken to remove the collected logs from the HDFS; then, it resumes a new round. The detection times are averaged across the 5 rounds to eliminate
poten-tial inconsistency of measurements. That is, in the jth test
for theith case, the detection timeDijis as below:
Dij ¼ X 5 k¼1 Dkij ! =5; (16)
wherekis the index for the rounds of tests (i.e.,k= 1,..., 5);i
is the index for the cases of VMs (i.e.,i=1,2,3); andjis the
index for the consecutively repeated tests (i.e.,j=1,..,10),Dij
is the bundled time of detecting all the 4 malware programs and rootkits in Table 5 after being launched as a pack of attacks on to the guest VMs.
Therefore, in each case of the 1, 2 and 3 VMs there are 50 measurements of the detection time which are averaged across the 5 rounds of tests for consistency purpose. The
resulting 10 detection times Dij are then illustrated in
box-plots as shown in Fig. 8.
As expected, there is only a slight increase in the detec-tion time as the number of guest VMs increases. When tested with a single VM, the median detection time in the boxplot is approximately 0.06 ms which increases to 0.07 ms with the introduction of a second VM. The slight increase in median detection time is because the two guest VMs run different operating systems, with one running Ubuntu 14.04 and the other running CentOS 6.5. This results in a delay
timeinobtainingtheguestprocesslistsfromtheVMs,due to
the difference in processing remote command executions
(netstat)bytheguestOSes.WhilebothguestOSesareable
toprocessthesameremotecommandexecutions,theCentOS
guestOSusesasitsaccesscontrolmodulethestricter SeLinux
(Secure Linux) instead of the relatively more flexible
AppArmor access control module used in the Ubuntu guest
OS. This meant that the SeLinux conducts more rigorous
checksontheremotecommandexecutionbeforeallowingitto
beexecutedontheguestVM,causinganincreaseindelayasa
result.
Inaddition,thetwooutlierdetectiontimesinthecase
oftwoguestVMsstemsfromthetendencyoftheguestSSH
server to reset itself periodically after a certain number of
connections (1,000 in this case) as a built-in mechanism to
prevent against Distributed Denial of Service attacks.
With theintroductionof a third guest VMrunning Ubuntu
14.04,themediandetectiontimeincreasedslightlyupto0.066
mswhichisrelativelyconsistentwithpreviouscasewithtwo
guestVMs.ThisisduetotwooftheguestOSesrunningthe
moreflexible AppArmor accesscontrolmodule,whichenables
theremotecommmandexecutionsto beexecutedontheguest
VMs and the results to be obtained quicker. However the
numberofoutlierdetectiontimesalso increasedfromtwoin
the previous case to four, reflecting the guest SSH server
running in thethird guestVM to periodically resetitself to
preventagainstDDoSattacks.
4.4 ComparisonswithExistingSecurityApproach
In order to evaluate comparatively the performance of our
BDSA approach, wehave also implemented theVMI-based
Livewire virtualization security approach basedon the work
byGarfinkeletal.[25].
The reasonof choicebehind this is that Livewire is
similar approach to threat detection in using external
monitoring of guest VM behaviour. Specifically, Livewire
periodically pollsthe guest VMbehavior through executing
remote commands such as ps as well as obtaining the
hardware-level informationtoinfertheguestVM’sbehavior.
DuetothesimilarityinthisregardtoourBDSAapproachin
monitoring threat in guest VMs, Livewire is used for the
comparative evaluation.
Thecomparativeevaluationscenarioiscarriedoutas
fol- lows. First a guest VM running Ubuntu 14.04 (64-bit)
on both the Livewire host and the host on which our
BDSA approach was deployed. With the polling period
being set to 1 second for both approaches, thebotnet code
as well as themalware code fromPacketStorm [24]is then
executedon theguestVM. Thetestsarerunfor5times for
consistency of measurements and the average detection
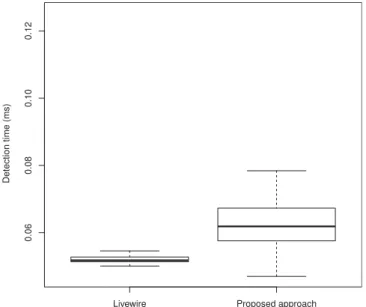
timesforboth approachesareobtained,andplottedinFig.9.
At a first glance, Livewire is able to detect attack
presence fasterthan our BDSAapproach by approximately
0.04ms. Thereasonbehindthisisduetotheabilityof Livewire
totakeadvantageofthe principle of locality forthreatdetection.
Giventhat Livewire runsonthesamehostonwhichtheguest
VMislocated,itisabletotraversethehostphysical memory
faster.This isevidencedbythe28outlierdetection timesin
the Livewire boxplot, and can be attributed to the delays
caused by the software interrupts issued by the KVM
hypervisor. Fig. 8. Detection times of our BDSA.