University of Wollongong University of Wollongong
Research Online
Research Online
University of Wollongong Thesis Collection
1954-2016 University of Wollongong Thesis Collections
2015
Energy efficiency and thermal comfort upgrades for higher education
Energy efficiency and thermal comfort upgrades for higher education
buildings
buildings
Laia Ledo
University of Wollongong, ll996@uowmail.edu.au
Follow this and additional works at: https://ro.uow.edu.au/theses
University of Wollongong University of Wollongong
Copyright Warning Copyright Warning
You may print or download ONE copy of this document for the purpose of your own research or study. The University does not authorise you to copy, communicate or otherwise make available electronically to any other person any
copyright material contained on this site.
You are reminded of the following: This work is copyright. Apart from any use permitted under the Copyright Act 1968, no part of this work may be reproduced by any process, nor may any other exclusive right be exercised, without the permission of the author. Copyright owners are entitled to take legal action against persons who infringe
their copyright. A reproduction of material that is protected by copyright may be a copyright infringement. A court may impose penalties and award damages in relation to offences and infringements relating to copyright material.
Higher penalties may apply, and higher damages may be awarded, for offences and infringements involving the conversion of material into digital or electronic form.
Unless otherwise indicated, the views expressed in this thesis are those of the author and do not necessarily Unless otherwise indicated, the views expressed in this thesis are those of the author and do not necessarily represent the views of the University of Wollongong.
represent the views of the University of Wollongong.
Recommended Citation Recommended Citation
Ledo, Laia, Energy efficiency and thermal comfort upgrades for higher education buildings, Doctor of Philosophy thesis, Faculty of Engineering, University of Wollongong, 2015. https://ro.uow.edu.au/theses/ 4712
Research Online is the open access institutional repository for the University of Wollongong. For further information contact the UOW Library: research-pubs@uow.edu.au
ENERGY EFFICIENCY AND THERMAL
COMFORT UPGRADES FOR
HIGHER EDUCATION BUILDINGS
A thesis submitted in partial fulfilment of the requirements for the award of the degree
DOCTOR OF PHILOSOPHY (PhD)
From
UNIVERSITY OF WOLLONGONG
by
Laia Ledo,
BEng
,
MSc
SUSTAINABLE BUILDINGS RESEARCH CENTRE
FACULTY OF ENGINEERING AND INFORMATION SCIENCES
iii
ABSTRACT
Existing higher education buildings have an important role in the minimisation of greenhouse gas emissions from our built environment and in assisting the mitigation and adaptation of our society to climate change. However, operating and managing the building stock of organisations such as universities is complex because their diverse infrastructure and non-uniform building conditions can make it difficult to prioritise the resources needed to upgrade particular buildings and systems.
Thus, the aim of this thesis was to develop a decision support framework to aid the decision making process in terms of assessing the overall building portfolio through optimising retrofit strategies for particular buildings. This work started with an investigation of the current decision making approaches used by different tertiary institutions, followed by the development of Key Performance indicators (KPIs) to map the characteristics of portfolios of higher education buildings. Then a weighting scheme that included subjective and objective weighting factors for these KPIs was presented. Thereafter, a methodology for a particular building of the university portfolio was developed to: a) evaluate the practical performance of existing university buildings in terms of energy and water consumption, indoor environmental quality (IEQ), envelope air-tightness, and overall occupant satisfaction; and b) to identify the optimal retrofit strategy for a particular building in order to minimise total costs (i.e. implementation, operational and maintenance costs whilst preserving satisfactory thermal comfort) through the life of the building. Finally, the effectiveness of the tools developed was tested by analysing the performance of a portfolio of university buildings, and evaluating the theoretical and practical benefits arising from the implementation of various retrofits.
The techniques used included: i) semi-structured, face-to-face and phone interviews conducted with senior staff members and the decision makers of facilities management teams from Australian and New Zealand universities; ii) analysis of building portfolio data gathered from various databases typically used at universities; iii) development of a decision framework that included the normalisation of KPIs and decision makers’ preferences through a weighting scheme; iv) a comprehensive sustainability audit undertaken at one of the University of Wollongong (UOW) campus buildings; v) energy modelling to determine the building energy consumption and thermal comfort
iv conditions; and vi) a sensitivity and retrofit optimisation analysis were conducted to find the best combination of building parameters to minimise total costs.
The results from the semi-structured interviews revealed the following: a) a logical and systematic approach to retrofitting of university building stock was not always pursued, however some commonalities exist, such as evaluation of building condition audits; b) although Key Performance Indicators (KPIs) are critical in assessing the existing building stock prior to refurbishment, there was no consensus on the best KPIs to use; c) existing issues such as missing data or lack of funding were seen as the most common problems in current decision making; d) effective demonstration of the benefits of retrofitting a building to university senior managers is a vital part of seeking funding for the retrofits; and e) the implementation of a given retrofit strategy for a particular building is typically driven by a cost-benefit analysis.
Analysis of these interviews provided the background for determining the most appropriate KPIs for retrofit optimisation in the higher education sector. These KPIs included the characteristics of the building, e.g. energy performance, space utilisation or non-compliance issues. Then the KPIs were normalised through a weighting scheme that prioritised the buildings for retrofitting.
The most significant findings from the comprehensive sustainability audit revealed: a) very poor envelope air-tightness; b) a relatively high occupant dissatisfaction with building indoor thermal comfort conditions; and c) that occupants’ perceived health and productivity in the building were below national and international averages.
Thereafter, the sensitivity and retrofit optimisation analysis was applied to a calibrated building energy model. Results showed that: a) the influence of parameters such as internal loads and internal temperature set-points had a significant impact on building performance in terms of energy consumption and thermal comfort; in contrast b) the influence of the quality of the building thermal envelope depended more strongly on the climate, e.g. the building envelope parameters had less impact on energy and comfort in milder climates than in more extreme climates.
This research has provided a framework to better facilitate the assessment of higher education building portfolios so as to reveal the benefits of implementing a particular retrofit strategy. This, in turn, may be used to strengthen the business case for retrofitting, and to assist facilities management (FM) teams to improve their decision
v making processes while making potential outcomes clear to the client, i.e. university senior management.
vi
ACKNOWLEDGEMENTS
I want to thank Prof Paul Cooper for his supervision and guidance during my research. I am extremely privileged to have had him by my side in this journey. Thanks for teaching me so many valuable life lessons; you are an example for all of us. I would also like to thank Dr Zhenjun Ma for his key advice and input. I need to thank him for always being willing to help me. Thanks to Dr Georgios Kokogiannakis for always making the time to discuss any issue with me. Despite you joined us in my last stage of the PhD, you were of great help.
This research would not have reached this point without the help of Dr. Phil Flentje and Mr. John Hazelton. Thanks for going far and beyond to assist me, providing me with the data and suggestions and for all your patience with me. I would also like to thank the engineering workshop, especially to Mr. Kevin, for manufacturing a fantastic pole for my weather station, Mr. Keith for helping me with setting-up the weather station cabling and Mr.Wayne for sorting out all the Work, Health and Safety procedures.
Craig McLauchlan and Stephen Choi deserve a thank you for their help, particularly in auditing Building 4 and conducting the blower door test. I really enjoyed working with you both.
It is also a pleasure to thank those who help me along the way; I am extremely grateful and lucky to have you all in my life:
To all my SBRC family, they made being at work a delightful pleasure! Thanks for encouraging me, giving me suggestions about work (and life) and sharing n coffees through those years. Massimo, you deserve a special thanks, this work would not have been possible without our discussions and your continuous moral support in many aspects of my life.
To Ana for making me feel like home, with walks, chats, pancakes or just by being with me and helping me through the process.
To my girls, Munsa, Mireia, Sun, Zui, Dru and Mire for being always by my side anywhere in the world.
To my family, particularly my goddaughter, Aina, and Pol, thanks for reminding me how loved I am.
vii Finally, thanks to the most important people in my life, my parents, Blueta and Papito, my brother, Xavier, and my brand new sister-in-law, Miriam. You have always been there for me, providing me with unconditional support and infinite love. I would be totally lost without you, us estimo moltíssim.
viii
TABLE OF CONTENTS
DECLARATION ... ii
ABSTRACT ... iii
ACKNOWLEDGEMENTS... vi
TABLE OF CONTENTS... viii
LIST OF FIGURES ... xiii
LIST OF TABLES ... xxi
1.1 Background ... 29
1.2 Research Aim and Objectives ... 30
1.3 Research Questions ... 31
1.4 Overview of the methodology... 31
1.5 Structure of the Thesis ... 32
2.1 Energy Use of Australian Higher Education Facilities ... 35
2.2 Potential Energy Reduction of Australian Higher Education Buildings ... 36
2.3 Demolish and Rebuild or Retrofit Australian Higher Education Buildings ... 37
2.4 Indoor Environmental Quality in Higher Education Facilities ... 39
2.4.1 Thermal Comfort... 41
2.5 Building Performance Assessment Methodologies for Higher Education Facilities ... 45
2.5.1 Auditing ... 45
2.5.2 Post Occupancy Evaluations (POEs) in Higher Education Facilities ... 47
2.5.3 Established Sustainability Assessment Methodologies for Higher Education Facilities ... 50
2.6 Sustainability Refurbishment Technologies and Systems ... 52
2.6.1 Technical Improvements ... 53
2.6.2 Organisational Improvement... 55
ix 2.6.4 Barriers for Implementing Sustainable Retrofits at Higher Education
Facilities ... 57
2.7 Approaches and Tools for Retrofit Decision making ... 58
2.7.1 Approaches of Higher Education Facilities Manager Teams to Retrofitting Decision making... 61
2.7.2 Building Performance Simulation ... 62
2.7.3 Optimisation Techniques ... 63
2.7.4 Decision Support Tools ... 65
2.7.5 Decision Support Tools for Educational Buildings ... 67
2.8 Concluding remarks ... 67
3.1 Introduction ... 70
3.2 Project Plan and Ethics... 70
3.3 Interviews ... 71
3.4 Qualitative analysis methods... 73
3.5 Positionality Statement ... 73
3.6 Current Practices of Facilities Management Staff and Decisions Makers in Retrofitting Higher Education Building Portfolios ... 74
3.6.1 Australian Higher Education Buildings Upgrades Processes ... 74
3.6.2 Proposed Changes to Improve the Decision making Process ... 81
3.6.3 Systematic Decision Making Frameworks and Tools ... 84
3.6.4 Key Performance Indicators Used ... 85
3.7 Current Practices to Implement Energy Efficient Upgrades at UOW ... 87
3.8 Summary ... 89
4.1 Introduction ... 91
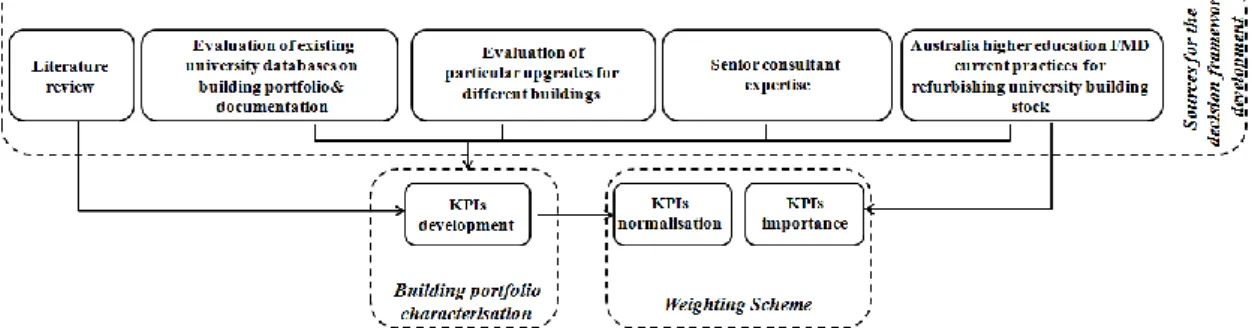
4.2 Decision Support Framework ... 91
4.3 Framework Conception Process ... 92
x
Figure 4.2 Schematic of the Decision Support Framework methodology. ... 96
4.4.1 Characterisation of University Building Portfolios ... 97
4.4.2 Benchmarking ... 102
4.4.3 Development of an Integrated KPI Weighting Scheme ... 104
4.5 Summary ... 108
5.1 Overview of Building Portfolio Case Study ... 110
5.2 Experimental Equipment... 111
5.3 Results of the Building Portfolio Characterisation ... 113
5.3.1 Campus Space Characteristics ... 113
5.3.2 Energy Performance KPI ... 116
5.3.3 Water Performance KPI ... 125
5.3.4 Building Envelope and Facilities Performance KPI ... 126
5.3.5 KPI: Space Management ... 128
5.4 Building Space Characteristics and KPI Relationships ... 130
5.4.1 Relationship Between KPIs and Building Space Typology... 132
5.4.2 KPI Interrelationships ... 133
5.5 Decision Support Framework Results... 134
5.5.1 Energy Performance ... 135
5.5.2 Overall Building Performance ... 136
5.6 Summary ... 138
6.1 Introduction ... 140
6.2 Building Performance Assessment ... 141
6.2.1 Comprehensive Building Audit Methodology ... 142
6.2.2 Post Occupancy Evaluation (POE) Surveys ... 145
6.3 Building Retrofit Optimisation Methodology ... 146
xi
6.3.2 Building Energy Model Set-up Procedure ... 149
6.3.3 Model Calibration ... 150
6.3.4 Identification of Most Influential Parameters ... 151
6.3.5 Optimisation Procedure ... 154
6.4 Modified Method to the Typical Approach to Retrofitting Higher Education Buildings ... 160
6.5 Summary ... 161
7.1 Case Study Building Overview ... 162
7.1.1 Building Characteristics ... 162
7.2 Experimental Equipment ... 163
7.2.1 Local weather conditions ... 167
7.3 Existing Building Performance Results ... 168
7.3.1 Previous Upgrades Assessment ... 169
7.3.2 Walk-through Assessment ... 175
7.3.3 Energy Assessment ... 176
7.3.4 Indoor Environmental Quality Assessment Results ... 177
7.3.5 Envelope Assessment ... 180
7.3.6 Occupant Perceptions - Post Occupancy Evaluation (POE) Results ... 183
7.4 Building Simulation as Investigative Tool: Initial Modelling Results to avoid air -conditioning ... 188
7.4.1 Methodology ... 188
7.4.2 Comparison of experimental and predicted room temperatures ... 190
7.4.3 Results and Discussion ... 191
7.4.4 Conclusions of Initial Modelling ... 200
7.5 Summary ... 201
8.1 Building Thermal Performance Simulation ... 203
xii
8.2.1 Building without Occupancy Validation... 206
8.2.2 HVAC Consumption Validation ... 208
8.3 Retrofit Optimisation Method ... 211
8.3.1 Results of Sensitivity Analysis (SA) ... 211
8.3.2 Set-up of Optimisation Method for Retrofit Strategy ... 216
8.3.3 Results of the Retrofit Optimisation ... 218
8.4 Results of Upgrade Implementation ... 228
8.4.1 Window Film Model Calibration ... 229
8.4.2 Experimental Temperatures Before and After the Upgrade ... 232
8.4.3 Model Predicted Temperatures against Experimental Temperatures ... 234
8.4.4 Modelled Solar Gains... 235
8.5 Results Discussion ... 236
9.1 Future Work ... 242
REFERENCES ... 244
APPENDIX A: Ethics Documentation ... 258
APPENDIX B UOW BUILDING PORTFOLIO CHARACTERISTICS ... 262
APPENDIX C Building 4 existing room usages ... 266
xiii
LIST OF FIGURES
Figure 1.1 Research process flow chart. ... 34
Figure 2.1 2020 emissions reduction opportunity per building sector with different retrofit options (ClimateWorks 2010). ... 37
Figure 2.2. CO2 emissions for newly built and refurbishment over time, adapted from (Baker 2009)... 38
Figure 2.3 Health gains due to an improved indoor air quality (Kats 2006)... 40
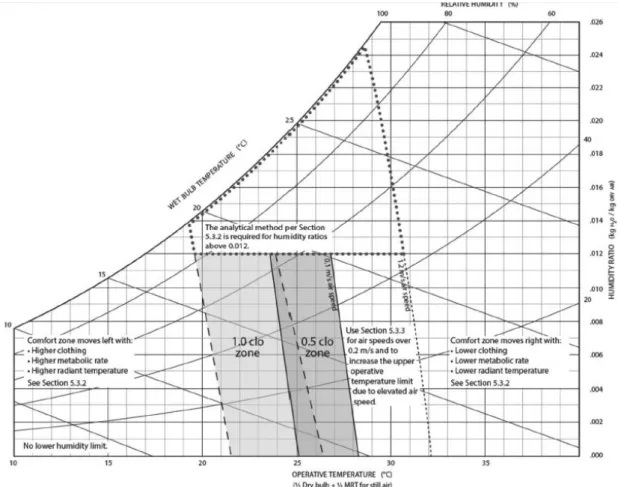
Figure 2.4 ASHRAE graphical representation of the comfort zones for summer and winter, during sedentary activity and air speed below 0.2 m/s (ASHRAE Standard 55 2013). ... 42
Figure 2.5 Adaptive comfort Standards. (a) ASHRAE 55-2004 (b) EN15251 2007 (c) ASHRAE 55-2013. ... 44
Figure 2.6 Predicted and actual energy consumption by sector (Menezes et al. 2012). 57
Figure 2.7 Method for retrofitting, with the key activities and tools in a building retrofit process, from Ma et al. (2012). ... 60
Figure 2.8 Strategic investment pyramid from APPA (2006). ... 61
Figure 3.1 Schematic of the common themes, stakeholders and strategies identified by retrofit decision maker interviewees. ... 77
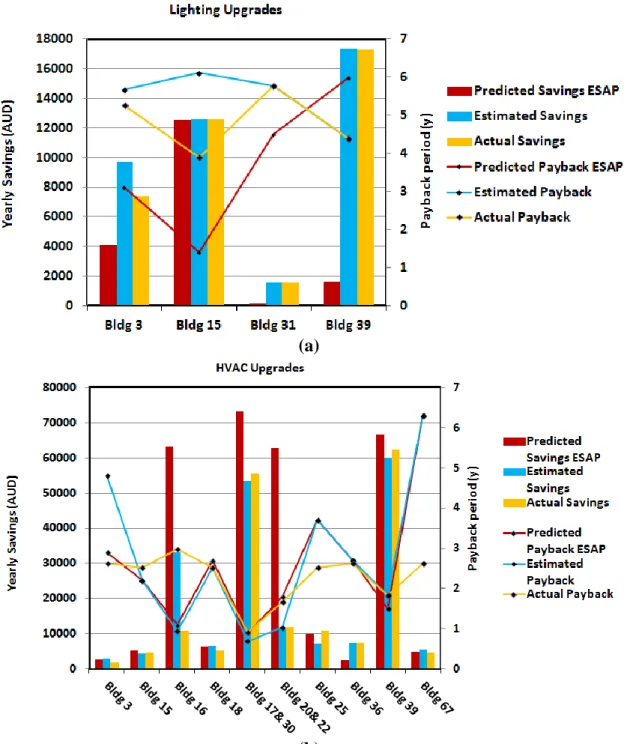
Figure 3.2 Estimated and actual energy savings and payback for a) lighting upgrades and b) HVAC upgrades. ... 88
Figure 4.1 Schematic of the process used to develop the Decision Support Framework. ... 93
Figure 4.2 Schematic of the Decision Support Framework methodology. ... 96
Figure 4.3 Final list of KPIs developed for building performance characterisation. .. 101
Figure 4.4 Prototype of the Decision Support Tool interface where the KPIs’ significance need to be selected. ... 106
Figure 4.5 Prototype of the Decision Support Tool interface where the KPIs’ significance need to be selected. ... 108
xiv
Figure 5.1 An aerial view of the University of Wollongong campus from Google maps
(Map data ©2015 Google, Wollongong). ... 111
Figure 5.2 Screen shot of the electricity consumption reporting in the DASH portal. 113 Figure 5.3 Percentage of different space typologies at UOW. ... 115
Figure 5.4 Electricity intensity for each building for 2012, 2013 and 2014 normalised against the average for all the studied buildings at the University of Wollongong. ... 117
Figure 5.5 Normalised gas intensity for each building for 2012, 2013 and 2014. ... 118
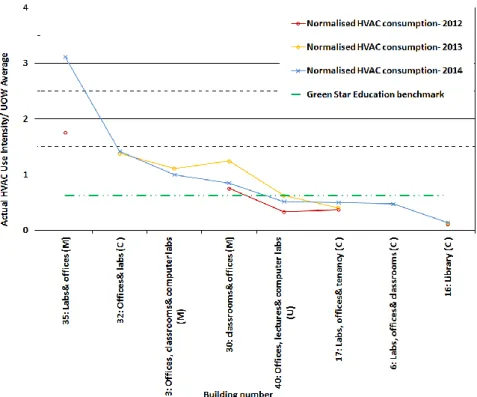
Figure 5.6 Normalised HVAC intensity for each building for 2012, 2013 and 2014. A missing mark implies there was insufficient data to calculate the yearly HVAC consumption. ... 119
Figure 5.7 Peak-to-average load ratio and average load intensity normalised against the average for all studied buildings at the University of Wollongong. ... 121
Figure 5.8 Energy Signature method used to evaluate two interventions in two different buildings: a) rectifying the control system, and b) voltage reduction. ... 122
Figure 5.9 ES method to assess the HVAC consumption in different periods during and out of session during summer. ... 123
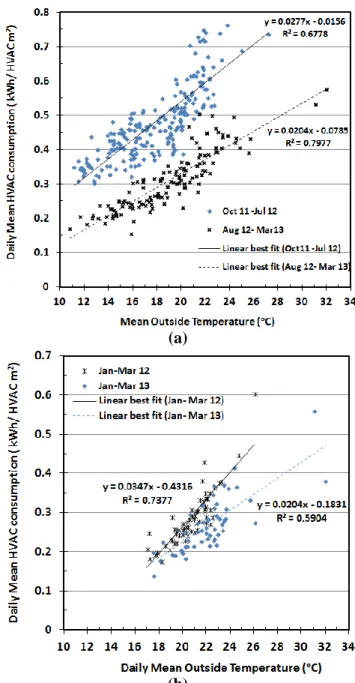
Figure 5.10 Energy Signature method used to assess HVAC consumption during two consecutive summers (2012 and 2013) for Building. ... 124
Figure 5.11 Normalised water intensity for each building. ... 126
Figure 5.12 Normalised unsolicited envelope, HVAC and plumbing maintenance complaints intensity for each building. ... 127
Figure 5.13 Normalised room utilisation for each building. ... 129
Figure 5.14 Matrix scatter plot of space typology and KPIs; which was used to explore interrelationships within the data. ... 131
Figure 6.1 Process schematic to find an optimal retrofit strategy. ... 140
Figure 6.2 Flow chart illustrating the building performance assessment process... 141
Figure 6.3 Typical thermal imaging camera. ... 144
xv
Figure 6.5 Diagram of the building simulation methodology used to obtain the decision variables that minimise the cost function and therefore the optimal retrofit strategy. ... 147
Figure 6.6 Calculated productivity, P, and instantaneous thermal comfort penalty function, TCPF, as a function of time during the last week of December 2013, for a research fellow’s office (4.129). Also shown are indoor temperature, and the minimum, Tcmin, and maximum, Tcmax, of the thermal comfort band. ... 158
Figure 6.7 Integrated method to decision making for higher education building retrofits; to improve on the current practices approach detailed in §3.6.1 Figure 3.1. ... 161
Figure 7.1 Building 4 east wing façade. ... 163
Figure 7.2 Equipment employed to assess Building 4 performance a) water meter at a whole-building level, b) power to monitor the different circuits from one of Building 4’s distribution boards, c) data logger and multiplexer with the connected cables of the sensors (thermocouples and weather station instruments) and d)IEQ instruments (i.e. temperature, humidity, CO2 and lux levels). ... 164
Figure 7.3 Monitoring plan for ground floor and first floor of Building 4, with location types of logging, spot checks measurements and tests conducted. ... 167
Figure 7.4 Weather station mounted on the top of Building 4. ... 168
Figure 7.5 Energy Signature for Building 4 comparing the period 1st November-15th December 2011, 2012 and 2013. Each point represents the daily energy intensity (8.00am to 5.00pm) against the daily average air temperature for weekdays... 171
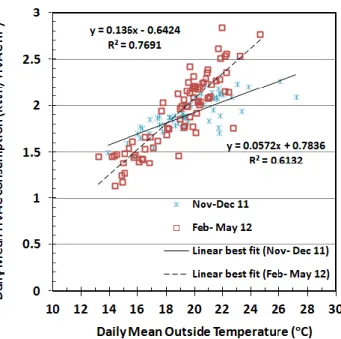
Figure 7.6 Energy Signature for different buildings at UOW main campus from 1st November 2012 to 15th December 2012. Each point represents the daily energy intensity (8.00am to 5.00pm) against the daily average air temperature. ... 172
Figure 7.7 Percentage of occupied hours (8.00am to 5.00pm weekdays) when given temperatures were exceeded. The measurement period corresponds to before and after the air-conditioning was installed. That is from 15st November 2010 to 24st January 2011, and from 15st November 2013 to 24st January 2014, respectively. The Christmas period from 20th December to 3rd January was not included. ... 173
Figure 7.8 Air temperatures with acceptable comfort zone for summer and winter clothing for office 4.126 and 4.132 (Air temperature is used instead of operative
xvi temperature, however as it is summer, the radiant temperature is expected to be higher than the air temperature and therefore operative temperature > air temperature). ... 174
Figure 7.9 Indoor air temperature correlated with outdoor air temperatures for two conditioned offices (4.126 and 4.132) and unconditioned ground floor office (4.G34). ... 175
Figure 7.10 Different parts of the building photographed during the walk through: a) west façade with outdoor air-conditioning units, b) split system mounted in front of an extractor fan, c) Office located in the east wing facing north. ... 176
Figure 7.11 Detailed power logging by end use. ... 176
Figure 7.12 Building 4 east wing lighting arrangement. ... 177
Figure 7.13 First Floor monitored spaces coloured as they exceeded 1% of occupied time above a certain temperature during summer. This translated into indoor air temperature above 28 °C for more than 1% of the occupied time (indicated in red). Temperatures above 26°C for more than 1% of the occupied time are shown in yellow, and green indicated no thermal comfort issues with the space. ... 178
Figure 7.14 Lighting levels across different areas of Building 4. ... 179
Figure 7.15 Depressurisation and pressurisation test. ... 180
Figure 7.16 Visual photography and thermographic images of the western façade of Building 4 comparing non-air conditioned versus air conditioned spaces: a) north west and b) south west of Building 4. ... 181
Figure 7.17 Visual and thermal photogrammetry of the interior of Building 4 showing: a) a door to a conditioned room and the corridor, and b) a duct in an uninsulated ceiling void. ... 182
Figure 7.18 POE responses on a) productivity, b) comfort, in summer and c) productivity figure generated by the BUS method. Each dot represents a building in the BUS dataset. The coloured dot shows where Building 4 is situated in respect to other buildings. The dashed lines indicates each quartile in the dataset. ... 183
xvii
Figure 7.19 Correlation between the monitored percentage of time outside the comfort zone against the occupant’s survey answer on their perceived comfort in summer.
... 186
Figure 7.20 Correlation between the monitored percentage of time outside the comfort zone against the occupant’s survey answer on the perceived (a) productivity and (b) health. ... 187
Figure 7.21 Schematic of the modelling method employed... 188
Figure 7.22 Ground and first floor plans of case study building... 189
Figure 7.23 Sketch of the ground floor geometry of the case study building. ... 190
Figure 7.24 Comparison of predicted and experimental cumulative frequency of experimental and predicted temperature in ground floor room 4.G34... 191
Figure 7.25 Annual energy consumption by using different energy conservation scenarios. ... 192
Figure 7.26 Percentage of occupied hours (i.e. from 8am to 6pm weekdays) that internal temperatures are exceeded for different ECM scenarios. ... 193
Figure 7.27 Adaptive comfort zones for ASHRAE 55-2004 with the annual indoor operative temperature for room 4.G34 during occupied hours under the different scenarios. ... 194
Figure 7.28 Adaptive comfort zones for ASHRAE 55-2004 with the annual indoor operative temperature for room 4.129 during occupied hours under the different scenarios. ... 195
Figure 7.29 Adaptive comfort zones for EN 15251b with the annual indoor operative temperature for the ground floor room 4.G34 during occupied hours under the different scenarios. ... 196
Figure 7.30 Adaptive comfort zones for EN 15251 with the annual indoor operative temperature for room 4.129 during occupied hours under the different scenarios. ... 197
Figure 7.31 Adaptive comfort zones for EN 15251 with the annual indoor operative temperature for room 4.129 during occupied hours under the different scenarios. ... 198
xviii
Figure 7.32 Adaptive comfort zones in office 4.129 with all the energy efficiency measures and heaters on for (a) EN15251 and (b) ASHRAE 55-2004 ... 199
Figure 7.33 Annual percentage of energy savings per each measure compared to the base case. ... 199
Figure 8.1 Floor plan of the ground floor (upper) and first floor (lower) of the modelled east wing of Building 4 - coloured according to their functions. ... 204
Figure 8.2 Views of Building 4: a) Plan view of the real Building from Google maps. The trees at the northern face of the east wing were cut due to some landscape upgrades at the end of 2012, b) axonometric view of the building model together with the rest of the building and the adjacent building drawn in DesignBuilder, c) an axonometric view of the first floor of the modelled spaces. ... 204
Figure 8.3 Monitored experimental temperature against modelled temperature for the ground floor office (4.G34). ... 207
Figure 8.4 Monitored experimental temperature against modelled temperature for the office 4.129. ... 207
Figure 8.5 Percentage of utilisation of the power density per hour according to the actual power consumption monitored on Monday 4th of March 2014. ... 208
Figure 8.6 Comparison between actual monitored internal loads power consumption and modelled internal loads power consumption from the 3rd March 2014 to 9th March 2014. This modelled internal loads power consumption profile was used in the model as input. ... 209
Figure 8.7 Experimental monitored air-conditioning power consumption, experimental moving average conditioning power consumption and modelled air-conditioning power consumption. ... 210
Figure 8.8 Experimental monitored air-conditioning power consumption, experimental moving average conditioning power consumption and modelled air-conditioning power consumption. ... 211
Figure 8.9 Floor plans of the ground (left) and first floor (right) of the modelled east wing of Building 4 with the investigated offices for retrofitting highlighted in yellow. ... 211
xix
Figure 8.10 The minimisation of the cost function depicting the values of outputs and inputs for all the simulations (a) Total costs, i.e. productivity loss costs due to productivity loss costs, operational costs and investment costs, (b) cooling capacity, (c) heating capacity values and (d) Lighting power density. ... 220
Figure 8.11 Output costs and inputs decision variables values for all the simulations conducted in the optimisation with Sydney typical weather file. (a) Total costs, i.e. productivity loss costs due to thermal discomfort, operational costs and investment costs. Input values for (b) air-conditioning capacity, (c) heating capacity, (d) cooling temperature set-point, (e) heating temperature set-point, (f) infiltration rate, (g) window U-value, (h) SHGC, (i) computer power density and (j) lighting power density. ... 223
Figure 8.12 Output costs and inputs decision variables values for all the simulations conducted in the optimisation for Canberra typical climate. (a) Total costs, i.e. productivity loss costs due to thermal discomfort, operational costs and investment costs, (b) air-conditioning capacity, (c) heating capacity, (d) cooling temperature set-point, (e) heating temperature set-point, (f) infiltration rate, (g) window U-value, (h) insulation wall R-U-value, (i) SHGC, (j) computer power density and (k) lighting power density. ... 227
Figure 8.13 Comparison of building 4 façade with the two representative offices chosen to assess the effectiveness of the window film. Office with Sterling 20 window film installed (G34 on the left hand side) and another one, G33, without window film. ... 229
Figure 8.14 Experimental temperatures against modelled temperatures for (a) an office without window film (G33) and (b) office with window film (G34). ... 230
Figure 8.15 Experimental temperatures against modelled temperatures for (a) an office without window film (G33) and, (b) office with window film (G34) considering the increase in internal loads. ... 231
Figure 8.16 Cumulative frequency for outdoor dry bulb temperatures during five days in December 2013 and 2014. ... 232
Figure 8.17 Cumulative frequency for internal air temperature during five days in December 2013 and 2014 with very similar outside air temperature. ... 233
xx
Figure 8.18 Cumulative frequency for the internal temperature for 19th of December 2013 to 16th January 2014 and 19th of December 2014 to 16th January 2015 for G34 office with window film, and G33 office without window film. ... 234
Figure 8.19 Comparison of internal temperature cumulative frequency between modelled and monitored results as in reality (with window film) and modelled without window film (how the internal temperatures would have been). ... 235
Figure 8.20 Modelled comparison of the solar heat gains between G34 office with window film (as the existing one) and if no window film had been installed. ... 236
xxi
LIST OF TABLES
Table 2.1 Benefits of conducting a POE (HEFCE & AUDE 2006). ... 48
Table 2.2 Frequent methods to conduct a POE adapted from HEFCE & AUDE (2006). ... 49
Table 2.3 Building sustainability rating systems and main indicators of evaluation for existing builds. ... 51
Table 2.4 Technical improvements and their qualitative assessment of their costs, intervention levels and potential benefits (ARUP 2008). ... 54
Table 3.1 Participants roles, recruitment and characteristics of university were they are employed. ... 72
Table 3.2 Procedure used for analysing the interviews ... 73
Table 4.1 KPI benchmarks utilised in the decision support framework. ... 104
Table 4.2 Nomenclature used in the weighting factor scheme. ... 105
Table 4.3 KPI subjective significance and quantitative scores for subjective weighting factors. ... 107
Table 5.1 Description of University of Wollongong monitored KPIs. ... 112
Table 5.2 Buildings’ cooling coefficient and air-conditioning base load. ... 125
Table 5.3 Statistically significant correlations between KPIs and space typology using Spearman’s correlation... 133
Table 5.4 Statistical significant correlations between KPIs using Spearman’s correlation. ... 134
Table 5.5 Prioritisation list for electricity and peak-to-average demand ratio, where φ is the baseline value, Φ aggregate weight. ... 136
Table 5.6 Prioritisation list for all KPI ... 137
Table 5.7 Building year due for capital investment and type of replacement for the next three years ... 138
Table 6.1 Inputs for the building simulation model construction. ... 149
xxii
Table 6.3 The parameters considered in the local sensitivity analysis. ... 153
Table 6.4 Retrofit options with associated costs for each parameter of interest – data for the Sydney region (Rawlinsons 2012). ... 155
Table 7.1 Overview of the base case university building. ... 163
Table 7.2 Summary of experimental measurements. ... 165
Table 7.3 Monitored mean indoor air temperature and maximum indoor temperature from 1st November 2010 to 28th February 2011 for offices located in the east wing of Building 4. ... 170
Table 7.4 Slope and coefficient of the determination for the linear best fit of the different energy signatures. ... 171
Table 7.5 Slope and coefficient of the determination for the linear best fit of the different energy signatures of the buildings in Figure 7.6. ... 172
Table 7.6 Negative comments provided in the POE grouped by themes, with the key words used to find the complaint, the percentage of occupants complaining about the issue, and the reasons given by the occupants. ... 185
Table 7.7 Energy Conservation Measure (ECM) Scenarios considered ... 189
Table 7.8 Summary of Internal loads before and after the application of the ECMs. .. 190
Table 8.1. Modelled internal loads operation schedules and descriptions. ... 205
Table 8.2. Existing air-conditioning systems monitored from Distribution Board 1A. ... 206
Table 8.3 Sensitivity coefficients for Sydney weather. ... 213
Table 8.4 Sensitivity coefficients for Canberra weather. ... 214
Table 8.5 Building component and retrofit option, investment costs, number of items to be used, lifespan and annual maintenance operation and repair and service factor of the building component ... 217
Table 8.6 Decision variables, constraint and initial base value definition. ... 218
Table 8.7 Decision variables, constraint and initial base value definition. ... 218
Table 8.8 Specifications for the clear glass and window film employed in the model and installed in the building. ... 229
xxiii
List of Publications
Ledo, L., Ma, Z. & Cooper, P. (2012). “Improving thermal comfort in naturally ventilated university buildings.” 12th International Australasian Campuses Towards Sustainability Conference 2012 (pp. 2-12).
My contribution to this paper was mainly all the simulation work, writing, analysis and discussion of the results. This paper has been peer reviewed and it is included in Chapter 7 §7.3.
Ma, Z. J., Daly, D. Cooper, P., Ledo, L. “Existing building retrofits: Methodology and state-of-the-art.” Energy and Buildings 55 (2012): 889-902.
My contribution to this paper was mainly writing the economic analysis section. This paper has been peer reviewed and one figure is shown in Chapter 2 §2.7.
xxiv
GLOSSARY
APPA= Association of Physical Plant Administrators
BEMS=Building Energy Management System
BEIMS=Building and Engineering Information Management System
BUS= Building Use Studies
DASH= Data and Analytics Self-service Hub
DM=Decision Maker
DST= Decision Support Tool
ECM=Energy Conservation Measures
EFTS= Equivalent Full Time Students
ESAP=Energy Savings Action Plan
FM= Facilities Management
GBCA=Green Building Council of Australia
HVAC= Heating Ventilation and Air-Conditioning
iC= Innovation Campus
IEQ= Indoor Environmental Quality
IWEC=International Weather for Energy Calculation
KPI= Key Performance Indicator
PIS= Participant Information Sheet
PMV= Predicted Mean Vote
POE= Post Occupancy Evaluation
PPD= Percentage of People Dissatisfied
ROI=Return On Investment
SAMP= Strategic Asset Management Plan
SGHC= Solar Heat Gain Coefficient
xxv
UFA= Usable Floor Area
WHS= Work, Health and Safety
xxvi
NOMENCLATURE
𝜶 =constant in the EN15251 (2006) defined as 0.8.
βB = best practise benchmark [same units as KPI]
βT= typical practice benchmark [same units as KPI] 𝜹 = declination [°]
= efficiency (or Coefficient of Performance) of the air-conditioning system 𝝋baseline value of KPI [same units as KPI]
f= heat flux
𝜱normalised value of KPI 𝝓 =latitude [°]
subjective weighting factor, which represents the relative importance that decision makers give to the KPIs
= strength of the Spearman’s correlation
a= the density of air [kg/m3]
=remaining life of the building
aggregate weighting factor, which incorporates objective and subjective weights
= overall objective weighting factor 𝝎𝒂 = hour angle [°]
𝝏𝒙/𝝏𝒌 = sensitivity coefficient
𝑨 = area of each exposed surface of the building [m2]
𝑪𝒂,𝒛= annual cost of the retrofit measure for a typical year, including the annual operating, maintenance, and repair costs [$]
𝑪𝑰= initial financial investment cost [$] 𝑪𝒑= heat capacity of the air [kJ/kg K]
CS= cooling slope [W/m2K]
xxvii 𝑬𝒐= heating, ventilation and air-conditioning (HVAC) base load consumption [W/m2] 𝑮𝟎= extra-terrestrial horizontal radiation [W/m2]
𝑮𝒔𝒄 = solar constant [W/m2] 𝑯𝒓= relative humidity
I= global horizontal radiation [W/m2]
𝑰𝟎= hourly extra-terrestrial radiation on a horizontal surface calculated [W/m2]
𝑰𝒃= beam radiation component of hourly radiation [W/m2]
kT= hourly clearness index 𝒌 = input variable
𝒏𝒐𝒄𝒄= number of occupants
𝑷= productivity
𝑷𝑷𝑭= productivity penalty function [$] 𝑹𝒅= discount factor per year
r = real interest rate [%]
𝑺= normalised sensitivity coefficient
𝑺̅𝒐𝒄𝒄= average hourly salary of an occupant [$/h]
𝑻𝒄𝒑= the cooling change-point temperature [°C] 𝑻𝒅𝒑= dew-point temperature [°C]
𝑻𝒆𝒅−𝟐 = daily mean external temperature for the ith-2[°C] 𝑻𝒆𝒅−𝟏= daily mean external temperature for the ith-1 [°C] 𝑻𝒊𝒏 =internal temperature of the space [°C]
𝑻𝒐=outdoor air temperature [°C]
Trm-1 = running mean temperature for the ith-1 day[°C]
TCPF = thermal comfortpenalty function [$]
𝑼𝒋 = overall heat transfer coefficient [W/m2K]
xxviii
V =volume flow rate of air entering the building [m3/s] 𝑽 =residual value of a set of retrofit measures [years]
𝒚𝒋= number of times the retrofit must be renewed in situations where the lifetime of the building component is shorter than the remaining life of building
𝒙 = output variable
29
1.
Introduction
Existing higher education buildings have an important role in the minimisation of greenhouse gas emissions from our built environment and in assisting the mitigation and adaptation of our society to climate change. However, operating and managing the building stock of organisations such as universities is complex because their diverse infrastructure and non-uniform building conditions can make it difficult to prioritise the resources needed to upgrade particular buildings and systems.
Obtaining a clear understanding of how the precincts of higher education buildings perform will enhance the economic, social, environmental, and operational performance of the Australian university building stock. This research seeks to increase our understanding of the performance of tertiary institution buildings and precincts by mapping their characteristics and developing a decision support framework to better facilitate the assessment of building portfolios. This chapter introduces the research background, the justification, aim and objectives, as well as the research questions, scope, and structure of the thesis.
1.1 Background
One of the most critical challenges facing our society is anthropogenic climate change and its consequences for economies and communities (Parkinson et al. 2010). Although the impact of climate change may well prove irreversible according to many authorities, the risks to society may be reduced by embracing adaptation and mitigation strategies; for example, the Intergovernmental Panel on Climate Change (IPCC 2007) urged world leaders to act immediately by reducing greenhouse gas (GHG) emissions.
The uptake of energy efficiency technologies and systems has been identified as one of the most cost-effective ways of reducing GHG emissions (Energy White Paper Task Force 2004), as well as providing energy security, and economic, climate and social benefits (Steuwer 2010). As an example, retrofitting Australia’s existing commercial buildings during the next decade could save $1.4 billion a year (ClimateWorks 2010), reduce building emissions by 30% and generate 27,000 jobs (Group ASBEC Climate Change Task 2007; Langdon 2009).
These benefits also apply when the focus is placed on buildings used for higher education because these improvements can play a major role, not only as described
30 above, but also when the buildings are used as a pedagogical tool to educate and teach students, staff, and the broader community about sustainability (Rohwedder 2004). Rohwedder stated that educational buildings can showcase economic, water and energy savings, reductions in GHG and social responsibility, whilst teaching students that educators care about their future well-being.
Satisfactory and comfortable indoor conditions are essential if we are to improve the health, performance, and learning of university students, and staff (Kats 2006; Corgnati
et al. 2007). However, most of the existing higher education buildings in Australia were generally designed at a time when the sustainability and comfort of the occupants was not prioritised as highly as at the time of writing (GBCA 2013b). This, in turn, results in inefficient operation and frequently fails to provide acceptable thermal comfort for the occupants throughout the year. Furthermore, universities typically operate a diverse portfolio of buildings with wide-ranging performance issues that affect them to different degrees, which is why a holistic approach is likely to be required when assessing the extent to which university building stock can be made more sustainable and comfortable; this means considering the building stock as a whole portfolio when considering any retrofits and upgrades, rather than in isolation and across a range of attributes. On this basis then, the retrofit decision making process is complex.
1.2 Research Aim and Objectives
The primary aim was to understand current approaches to retrofitting and upgrading existing higher education buildings and develop a decision support framework to evaluate and prioritise retrofitting and upgrades of their portfolios.
To achieve this goal, a number of key objectives were targeted:
i) Carry out a comprehensive literature review.
ii) Determine the views of experts and decision makers from Australian and New Zealand University Facilities Management (FM) teams in order to map their approaches and the factors that influence the retrofitting of higher education buildings in Australia.
iii) Develop a set of Key Performance Indicators (KPIs) to represent the desirable characteristics of portfolios of higher education buildings.
31 iv) Develop a comprehensive methodology to evaluate the practical performance of existing university buildings in terms of energy and water consumption, Indoor Environmental Quality (IEQ), envelope performance, and overall occupant satisfaction.
v) Develop a methodology to identify the optimal retrofit strategy for a particular building in order to maximise the cost-effectiveness of upgrades in terms of minimising their implementation and energy costs whilst preserving satisfactory thermal comfort through the life time of the building(s).
vi) Test the effectiveness of the tools developed by analysing the performance of a portfolio of university buildings, and evaluating the theoretical and practical benefits arising from the implementation of various retrofits.
1.3 Research Questions
The main research questions to be answered during the course of this research are presented below.
What are the current perceptions and practices of decision makers and other stakeholders at Australian universities regarding the planning and implementation of refurbishment works, particularly in respect of sustainability outcomes?
How can optimal upgrade strategies for higher education buildings be developed in order to minimise energy consumption whilst improving or maintaining occupant satisfaction regarding issues such as thermal comfort?
What are the most efficient audit techniques that will identify the most appropriate retrofit strategy for a given university building?
1.4 Overview of the methodology
This research focussed on understanding the current practices of decision makers at Australian universities and developing a framework to aid decision making around retrofitting higher education facilities, whilst finding an optimal retrofit strategy for one of the buildings in the portfolio. The methodology developed is as follows:
32 i. Analyse the perceptions, attitudes and current practices of decision makers from Australian higher education facilities management teams via semi structured interviews.
ii. Develop a framework to characterise the building portfolio through KPIs.
iii. Develop a decision framework that includes the normalisation of KPI’s and decision makers’ preferences through a weighting scheme.
At a particular building of the university portfolio:
i. Perform a comprehensive building assessment via:
Conducting a sustainability audit to understand the building performance;
Analysing the occupants’ perceptions and satisfaction with the building through questionnaires.
ii. Find the optimal retrofit strategy for the building undertaking the following steps:
Develop a calibrated building energy model;
Perform a sensitivity analysis of the calibrated model;
Define a cost function involving the more sensitive parameters;
Conduct an optimisation with the defined cost function and the calibrated model.
1.5 Structure of the Thesis
This thesis is structured as follows.
Chapter 1 - Introduction describes the background of the project, and explicates the motivation for conducting this investigation, research objectives, and scope of the work.
Chapter 2 – Literature Review presents a review of retrofitting higher education buildings, types of retrofits, and previous work conducted on the topic. This chapter also indicates the direction of the research.
Chapter 3 –Current Practices, Attitudes and Perceptions of Stakeholders at Higher Institutions explain the methodology used to analyse the interviews conducted to understand stakeholders’ attitudes towards current retrofitting practices in higher education institutions. The analysed responses of decision
33 makers pertaining to different Australian and New Zealander tertiary institutions on the decision making practices used to upgrade and retrofit existing Australian university buildings stock portfolio is also presented.
Chapter 4 –Development of a University Portfolio Characterisation and Decision Support Framework details the methodology used to develop a decision support framework to prioritise university building stocks to be retrofitted.
Chapter 5 – Portfolio Characterisation and Decision Support Framework Case Study exemplifies the methodology developed in Chapter 4 by using UOW as a case study.
Chapter 6 –Development of a Building Retrofit Optimisation Methodology
details the methodology developed to find an optimal sustainable retrofit strategy for a university building.
Chapter 7 - Building Performance Assessment: Case Study analyses the performance of the case study building to set the baseline and identify the underperforming areas.
Chapter 8 – Building Retrofit Optimisation: Case Study demonstrates the optimal retrofit strategy used to reduce energy consumption while improving thermal comfort by applying it to a particular case study.
Chapter 9 - Conclusions and Future work brings together the key findings of this research and suggests possible avenues for future work.
The flow chart describing the content of each Chapter and how they are connected is depicted in Figure 1.1.
34
35
2.
Literature Review
The Facilities Management budget of an organisation typically requires 30 to 40% of its total expenditure, a figure that corresponds to the second highest cost after the payroll (Amaratunga & Baldry 2000a). At higher education institutions, it is estimated that facilities management represents up to 20% of their operating costs (TEFMA 2009). This chapter reviews the performance of Australian higher education facilities in terms of their energy efficiency and the quality of their indoor environment, as well as the methodologies used to assess this performance. It also examines the retrofitting techniques and facilities management methodologies used for decision making around retrofitting.
2.1 Energy Use of Australian Higher Education Facilities
To be managed efficiently, higher education facilities should maximise their resources while optimising the costs of maintenance and operation (Pukka et al. 2012), and since the largest controllable operating expense is energy, understanding their patterns of consumption within the campuses could improve the triple bottom line (Bates 2011).
Australian Universities are one of the fastest growing consumers of energy within the non-domestic building sector (pitt& sherry 2012); they consumed 79% more in energy in 2009 than they consumed in 1999, and by 2020 their total energy consumption is expected to increase by a further 50% compared to the 2009 baseline. Pitt& sherry (2012) investigated energy use in Australian offices, hotels, retail buildings, hospitals, education facilities and public institutions using data collected between 1999 and 2012, and then estimated the energy use for 2020 based on this historical data. The energy intensity, defined as the energy consumption per square metre, of Australian university buildings over time is expected to increase 11% by 2020 compared to the 2009 baseline, while office buildings showed a reduction in energy intensity over time. In 2009, the average annual energy intensity for office buildings was 255 kWh/m2, whereas university buildings consumed 241 kWh/m2 annually. These rankings are expected to be reversed by 2020, when office buildings are expected to have a yearly average consumption of 231 kWh/m2 while university buildings will consume 268 kWh/m2 annually (pitt& sherry 2012). This recent downward trend in energy intensity is attributed to Australian policy settings such as the impact of the Building Energy
36
Efficiency Disclosure Act 2010. This program required that commercial office space equal or larger to 2000m2 for sale or lease to provide energy efficiency information in advertising materials. This, in turn, is thought to have contributed to the weak downward trend in commercial building energy intensity since 2010.
Reducing the energy consumed in Australian universities should therefore be of great importance, as should be decreasing their operating costs while improving student learning experiences and demonstrating a commitment to sustainability.
2.2 Potential Energy Reduction of Australian Higher Education Buildings
Uptake in energy efficiency retrofits has been identified as the most cost-effective solution available for reducing energy consumption in buildings (Energy White Paper Task Force 2004); and this could also provide energy security, and economic, climate and social benefits (OECD 2010). As an example, retrofitting Australia’s existing commercial buildings over the next decade could save $1.4 billion a year (Abdullah et al. 2012), reduce building emissions by 30%, and generate 27,000 jobs (ASBEC 2007; Langdon 2009).
ClimateWorks Australia (2010) investigated the most cost effective ways of reducing Australian GHG emissions to 25% below 2000 levels. It was estimated that the building sector could potentially contribute to an 11% reduction in the total Australian GHG emissions. From this potential abatement, the highest share corresponds to the commercial sector, which represented a possible 77% reduction in GHG emissions. The predicted total percentage of potential reductions in GHG emissions per each sector and type of improvement is shown in Figure 2.1, with the education sector accounting for 11% of this 77% possible reduction. According to ClimateWorks the biggest potential decrease in emissions lies in downsizing and disposing of unnecessary equipment and appliances, whilst upgrading lighting and utilising thermal insulation.
But will this potential abatement be enough to justify retrofitting higher education buildings or does demolishing and rebuilding provide a more cost effective social, economic, and environmental solution?
37
Figure 2.1 2020 emissions reduction opportunity per building sector with different retrofit options (ClimateWorks 2010).
2.3 Demolish and Rebuild or Retrofit Australian Higher Education Buildings
At present two per cent of the total Australian building stock is being built new every year (Department of the Environment Water Heritage and the Arts 2009). Moreover, some of the existing building stock was built without taking sustainability into account (Atkinson et al. 2007). Specifically, many Australian tertiary institutions were constructed to meet the minimum building codes at that time which resulted in buildings that are not necessarily comfortable or productive spaces for teaching, researching, and learning (GBCA 2013b). Furthermore, higher education facilities, as with other material resources, are consumable so over time they are decaying and must be replaced or revitalised (Kowalski 1983). Therefore, to improve the value of the buildings in terms of condition, reducing operation emissions, building resilience and improving the internal environmental quality they must be refurbished or replaced, i.e. demolished and rebuilt.
Demolition and rebuilding almost always has a higher impact on the environment than retrofitting (Baker 2009) due to embodied energy, because demolishing the old building and constructing a new one requires energy, and this generates carbon emissions. It has recently been revealed that the embodied energy of buildings is much larger in proportion than was previously considered (Lawson 2006); typically varying from 10 times the annual operating energy for conventional residential buildings to 30 for commercial buildings (Lawson 2006). Furthermore, demolition and waste disposal also
38 cause emissions, thus demolishing and rebuilding a more energy efficient building will only reduce the overall energy over a longer term rather than immediately, whereas the need to decarbonize the built environment is urgent. The CO2 emissions for new buildings and the refurbishment of an existing building over time are illustrated in Figure 2.2 (Baker 2009).
Figure 2.2. CO2 emissions for newly built and refurbishment over time, adapted from (Baker 2009).
Figure 2.2 shows that during a building’s lifetime, the newly built might have less environmental impact, as indicated by a less steep slope, but the refurbished building is the lowest emitter over a long period until it reaches a break point. This break point depends on the building performance, as indicated by the steepness of the slope, so the break point could be extended further by improving the performance of the existing building, depending on the energy conservation measures applied. To this end, and in the short term, the present stock of new and non-refurbished buildings will lead to large energy debts (Power 2008). Additionally, this building stock is replaced, or added to, at only 1-3% per year so to make a significant impact on GHG emissions the existing stock must be improved.
All buildings and institutions, particularly tertiary institutions, have a privileged opportunity of influencing present society and succeeding generations in reducing GHG emissions by embracing energy efficiency measures. Improving the performance of university buildings can play a major role as a pedagogical tool to educate and teach students, staff, and the broader community about sustainability (Rohwedder 2004).
39 Improving building performance means reducing its energy consumption and enhancing the quality of the internal environment. The importance of reducing the energy consumption has already been explained and now the following section introduces the quality and importance of the indoor environment, particularly in higher education facilities, and then introduces different approaches for measuring building performance.
2.4 Indoor Environmental Quality in Higher Education Facilities
The issues influencing the way we feel in a space are addressed by the Indoor Environmental Quality (IEQ). Having a satisfactory IEQ is crucial for human heath, comfort, and productivity (Spengler et al. 2001). At higher education facilities, an adequate indoor environmental quality has significant health and learning benefits for students and staff (GBCA 2013b). Therefore, ensuring an adequate IEQ for newly built or upgrades not only improves pupils’ achievements and reduces sick leave from staff and students, it also prevent problems such as the formation of moisture, poor outdoor air quality or insufficient ventilation (GBCA 2013b; Persily 2009).
It is often assumed that an improved IEQ results in rising energy usage, but in reality, improving the IEQ while reducing energy usage is possible by implementing energy efficiency measures (Fisk 2000; Burroughs & Hansen 2011).
The importance of the IEQ in educational spaces was illustrated in Kats’ report (2006) where the impact of an adequate IEQ was assessed by reviewing 30 green schools, meaning schools constructed with sustainability awareness. It was noted that educational buildings are typically designed to achieve minimum building code performance, and while this minimises the initial capital costs, it inevitably results in a building that fails to provide a work space that is comfortable and healthy for students and staff. Accordingly, occupant productivity is reduced and absenteeism is increased. The results of 17 independent studies where an overall improvement in health, e.g. colds, respiratory issues or sick building syndrome (SBS) was experienced by improving the IEQ is shown in Figure 2.3.
40
Figure 2.3 Health gains due to an improved indoor air quality (Kats 2006).
Dr inka et al . 1996 Ja akola& Mi ett inen 1995 B runda ge et al . 1988 F isk& R osenf eld 1997 B ourbe au et al . 1997 S unde ll 1996 F isk& R osenf eld 1997 Ka cz a rc zyk et al. 2002 Menz ies 1997 C ox -Ga nser et al . 2005 Husma n et al. 2002 B eij ing R esidenc e Liu et al. 1996 Austra li an R esidenc e Ga rr ett 1996 W argoc ki et al . 199 8 W iesla nde r et al . 1997 Ja akkola et al . 1994 Oslo R esidenc e Ja kkola et al. 1996
41 All the studies reported improvements in health ranging from 13.5% to 87% reductions in adverse health symptoms due to enhanced quality of indoor air.
Frontczak and Wargocki (2011) conducted a literature review to survey how building indoor environment affected human comfort. The overall impact of environmental indoor variables, including air quality, thermal comfort, visual comfort, and acoustic comfort on Indoor Environmental Quality (IEQ) was revealed by ranking each factor according to their influence on human comfort. Those factors unrelated to the indoor environment such as an occupant’s characteristics, i.e. age, gender, country of origin, etc., and building-associated factors such as control over the indoor environment and type of building, and the influence of the outdoor climate on the IEQ were examined. The following conclusions were drawn from Frontczak and Wargocki’s literature survey concerning the effect of the aforementioned factors to indoor environmental conditions:
The type of building and outdoor climate affected the thermal comfort;
The occupant’s ability to control the indoor environment enhanced their thermal and visual comfort, and thereby improved their overall IEQ satisfaction;
The influence of personal characteristics on comfort could not be strongly supported due to the lack of studies in literature. However, connections such as how the occupant’s relationship between superiors and colleagues and their level of education influenced thermal comfort were suggested.
Of all the many environmental factors, having satisfactory thermal comfort was the most important condition for achieving satisfactory IEQ. Acoustic comfort and satisfaction with air quality were not as important, and visual comfort was the least important. Visual comfort and thermal comfort are the IEQ factors that have the strongest influence on energy consumption, and as mentioned previously, thermal comfort is perceived by the building user as the most important parameter influencing their overall comfort. Therefore, thermal comfort is described in detail in the following section.
2.4.1 Thermal Comfort
Thermal comfort is defined as “the conditions of mind that expresses satisfaction with the environment” (ASHRAE Standard 55 2013). A comfortable environment is a subjective state where the individual is neither too hot nor too cold. It occurs when the temperature and humidity of the air immediately adjacent to the body lie in between
42 narrow ranges, where the air movement is “pleasant” and the air quality provides a sensation of freshness (Race 2006). An adequate comfort zone, with temperatures and humidity where 80% of the occupants do not feel dissatisfied, for summer and winter clothing, where the metabolic rate is between 1 to 1.3 met, i.e. during sedentary activity such as sitting in a lecture room or office, and the average air speed is below 0.2 m/s is shown in Figure 2.4 (ASHRAE Standard 55 2013).
Figure 2.4 ASHRAE graphical representation of the comfort zones for summer and winter, during sedentary activity and air speed below 0.2 m/s (ASHRAE Standard 55 2013).
ASHRAE Standard 55 (2013) was based on the Predicted Mean Vote (PMV) and Percentage People Dissatisfied (PPD), introduced by Fanger (1970). The PMV-PPD model was developed through experiments conducted in a controlled laboratory environment, i.e. a climate chamber where people’s responses to their thermal surroundings were investigated. Fanger’s thermal comfort experiments did not enable individuals to interact with the environment, thus building occupants were considered as passive receivers of the thermal environment controlled by HVAC systems (de Dear 2004). This in turn limits the practicality of the static model, being adequate in air
43 conditioned buildings where the climate is kept constant. However, the static model was not thought to be applicable to naturally ventilated buildings (Humphreys 1978).
Furthermore, many authors (Nicol & Humphreys 2002; Brager & De Dear 1998; Yao et al. 2009; de Dear 2004) indicated that thermal comfort models should consider human adaptability, where additional factors such as behavioural adaptation, adaptive opportunity, personal acclimatisation, and psychological adaptation must be considered. This thermal comfort model is known as the ‘adaptive’ thermal model and it was described by Auliciems (1983) as, “When a change occurs causing thermal discomfort, people react in such a way that their thermal comfort is re-established”.
Several field studies cited in the ref. (Brager & De Dear 1998) corroborated the unreliability of the PMV model for naturally ventilated buildings by comparing the static model of comfort (PMV-PPD) with the adaptive comfort model. The results showed that the PMV-PPD predictions agreed with the observed thermal sensations for buildings with HVAC systems, but this scenario was completely different in naturally ventilated buildings because the PMV model failed to predict the thermal sensations. In this case the occupants found a wider range of temperatures more comfortable than temperatures suggested by the PMV. This finding was also supported by Brager et al.
(2004) who studied the effect of personal control on operable windows via surveys and physical monitoring. Their results showed that the greater the adaptive opportunity, i.e. the level of control that the occupant has on their local environment, such as the presence of operable windows, led to a greater tolerance of the temperature range. Wong and Khoo (2003) conducted a study on thermal comfort in Singapore’s naturally ventilated classrooms through objective and subjective measurements. Their results indicated that the conventional thermal comfort criteria failed to predict the occupants’ thermal comfort because temperatures beyond the conventional thermal comfort range, as stated by ASHRAE Standard 55-92, were indicated as comfortable by the occupants.
Therefore, the adaptive thermal model allows for a more relaxed temperature comfort range in natural ventilated buildings than that established by Standard 55-92 (ASHRAE 55 1992). Hence, to get a more consistent evaluation of thermal comfort, the adaptive comfort theory was included in both American, i.e. ASHRAE Standard 55 (ASHRAE 55 2004), and European, EN15251 (2006), Standards (Figure 2.5).