Mass Retrofitting of an Energy
Efficient Low Carbon Zone
A thesis submitted in partial fulfilment of the requirements
of Edinburgh Napier University, for the award of Master by
Research
Tosin Taiye Oye
March 2017
ii
This thesis is dedicated to all the great teachers who instilled in me the joy of learning, my parents, brothers, sisters, and especially Blessing.
iii
Declaration
To the best of my knowledge, this thesis contains no copy or paraphrase of work published by another person, except where duly acknowledged in the text. This thesis contains no material which has been previously presented for a degree at Napier University or any other university.
iv
Abstract
By way of urban morphology, the design, layout and texture of district centres, neighbourhoods and buildings have as much a bearing on levels of energy consumption and rates of carbon emission as either buildings or their occupation: these recent discoveries propose urban morphology matters and both the design, layout and texture of district centres, neighbourhoods and buildings are as significant in setting levels of energy consumption and rates of carbon emission as the occupation and use of such structures. This thesis aims to reinforce this message and demonstrate how urban morphology does make a difference. Not only with respect to the geometry (i.e. surface and volume of the building design typologies), construction systems, or occupational behaviours, that such studies drawn particular attention to, but with regards to a matter which has been previously ignored. That is with regards to the potential which the planning, (re)development, design and layout of district centres and their neighbourhoods as context-specific transformations have, to not only lower levels of energy consumption and rate of carbon emission, but to uncover the significance of and particular contribution renewables makes to the mass retrofit proposals currently underway across Europe.
The approach this thesis presented adopts a key-component-based analysis of renewables in mass retrofit proposals and procedural modelling the geometry of this urban morphology is founded on. As an exercise in procedural modelling, the key component analysis also accounts for the renewables of mass retrofits in relation to the context of the application and with respect to the urban from of the buildings and their integration into the proposal. This in turn allows for the findings of this study to interpret the significance renewables take in the mass retrofit proposal, energy consumption and carbon emissions, it in turn generates as an energy efficient-low carbon zone and able to tackle global warming and combat climate change.
In this way, the thesis uncovers the significance of renewable as a source of clean energy in mass retrofit proposal and particular contribution it makes to levels of energy consumption and carbon emission. It means that for this thesis renewables are the key components of the mass retrofit it promotes to reduce levels of energy
v
consumption and lower carbon emission, vis-à-vis establish energy efficient-low carbon zones as an exercise in the development of sustainable suburbs whose status as city-districts not only tackle global warming but also combat climate change.
vi
Content
Chapter One 1.1 Background Introduction 1 1.2 Research Aim 5 1.3 Research Objectives 5 1.4 Research Question 5 1.5 Research Hypothesis 5 1.6 Dissertation Structure 6 Chapter Two 2.0 Introduction 7 2.1 Hackbridge Suburb 72.1.1 Zero Carbon Hackbridge 8
2.1.2 Sustainability 10
2.1.3 UK Building Emissions 12
2.2 Study of Urban Morphology 13
2.2.1 London Toulouse and Berlin Case Study 16
2.2.2 Factors that Affect Energy Consumption in Buildings 20
2.2.3 The Principal Component of Mass Retrofit 23
2.3 Effect of Urban Morphology on Energy Consumption 25
vii
2.3.2 Global Factors 28
2.3.3 Regional Factors 29
2.3.4 Atmospheric Factors 29
2.3.5 Modelling Solar Radiation Estimates 29
2.3.6 Digital Elevation Model (DEM) 30
2.3.7 3D – Models 31
2.4 Review of Energy Options Appraisal 33
2.4.1 The Environmental Profile 35
2.7.2 Energy Consumption and CO2 Emissions by House Type 41
2.5 Social Baseline 43
2.5.1 Classification of Social Groups 43
2.5.2 Deprivation across the Domains 45
2.8.3 Structure of Tenure within the Housing Market 34
2.6 Area-Based Analysis 48 2.7 Summary 52 Chapter Three 3.0 Methodology 55 3.1 Introduction 55 3.2 Research Approach 55
3.3 Procedural Modelling Approach and Justification 56 3.3.1 Procedural Modelling Basis in Existing Study 57
viii
3.4 Modelling Roofs Structures 60
3.4.1 Hackbridge Roof Structures 61
3.4.2 Roof Geometry 62
3.4.3 Evaluation of Level of Detail 62
3.4.4 Morphological Model 64
3.5 Data Groundwork 66
3.5.1 Building Height Attribute 66
3.5.2 Hackbridge Building Widths 68
3.5.3 Co-ordination Systems 68
5.5.4 Combination of the Datasets 70
3.6 Calculated Roof Pitches 71
3.6.1 The Mean Values for Hackbridge Buildings 71
3.7 Building Hackbridge Structure in CityEngine 74
3.7.2 Implemented 3D City Model 75
3.8 Evaluation of ArcGIS-Based Solar Energy 78
3.8.1 Solar Energy Calculation Process 79
3.8.2 The ArcGIS ModelBuilder 82
3.9 Summary 83
Chapter Four
4.0 Analysis 85
ix
4.2 The Hackbridge Venture 85
4.2.1 Hackbridge Features 86 4.3 Analysis of Solar Energy Calculations 87 4.4 Ascertaining Appropriate Roof Structures 90 4.5 Morphological Examination 91 4.6 Energy Savings and Carbon Reductions 92 4.7 Analysis of the Appropriate Roof Area 95 4.8 Building age 98
4.9 Area-based Analysis 102
Chapter Five 5.0 Conclusion 107
5.1 Limitations and Further Research 110
5.2 Contribution to Knowledge 112
5.3 References 114
List of Figures
Figure 1: Hierarchy of permissible methods to achieve zero carbon developments 9 Figure 2: On-site and off-site compliance 9 Figure 3: Sustainable building life cycle 11 Figure 4: Emissions from buildings in the context of total UK emissions 12 Figure 5: Factors that affect energy consumption in buildings 21x
Figure 6: Factors that affect energy consumption in buildings 23 Figure 7: Factors that affect energy consumption in buildings 24 Figure 8: Segregation of solar radiation by the atmosphere 27 Figure 9: Potential Annual Energy and CO2 Reductions 36 Figure 10: Average cost of DIY and professional measures 38
Figure 11: Hackbridge by House Type 39
Figure 12: Hackbridge by house type location – images 40 Figure 13: Average annual energy consumption & CO2 emissions per house type 41 Figure 14: Energy consumption by house type (kWh) 42
Figure 15: CO2 emissions by house type 42
Figure 16 44
Figure 17 44
Figure 18 44
Figure 19: Hackbridge sub-sections by number 44
Figure 20: The overall deprivation ranking 44
Figure 21: Multiple deprivation 45
Figure 22: Housing Tenure in Hackbridge 47
Figure 23: Profile of housing, energy consumption and tenure within the most
deprived area of Hackbridge (LSOA 1) 49
Figure 24: Profile of housing, energy consumption and tenure within the least
deprived area of Hackbridge (LSOA 5) 49
Figure 25: The relationship between deprivation and energy consumption in LSOA 1
xi
Figure 26: The relationship between deprivation and energy consumption in the social and owner occupier (including private rental) sectors 51 Figure 27: Satellite images of characteristic eyebrow dormers (left) and shed
dormers (right) in Hackbridge 61
Figure 28: Visualisation of roof geometry terms 62
Figure 29: Level of detail for residential buildings 63 Figure 30: Practical connections between the Level of Details 63
Figure 31: Morphological model 65
Figure 32: Illustration of a building overlapped by a tree 67 Figure 33: OSMM building footprint overlaid by division lines and satellite image of
corresponding building in Bing Maps 68
Figure 34: Single OSM footprint overlaid by multiple OSMM footprints 69
Figure 35: Satellite image of building additions 70
Figure 36: The OSM footprints 70
Figure 37: Illustration of calculated variable roof pitches 71 Figure 38: Imported building footprints in CityEngine and attributes for a selected
shape 74
Figure 39: Axonometric view on modelled buildings in Meadow Walk 75 Figure 40: Axonometric view on the three modelled roof types 76 Figure 41: Axonometric view on the 3D model of Hackbridge 77 Figure 42: Raster representation of a multipatch feature in ArcScene 79 Figure 43: Extract of the solar energy raster displaying the calculated yearly solar
xii
Figure 44: Yearly radiation values assigned to multipatch roof features 82
Figure 45: Processing steps shown in ArcGIS ModelBuilder 83
Figure 46: Calculations implemented in the FieldCalculator 87
Figure 47: Carbon emission (kg/p.a.) with and without solar power 93
Figure 48: Energy saving by type of retrofit 94 Figure 49: CO2 reduction by type of retrofit 95 Figure 50: Suitable roof area per building 96 Figure 51: Suitable roof area ratio by building age 97 Figure 52: Suitable roof area ratio compared to building ages and the contribution of solar power 98
Figure 53: Present energy consumption and energy savings per household by building age 100
Figure 54: Present CO2 emissions &CO2 reduction per household by building-age 101
Figure 55: Current energy consumption and CO2 emissions per capita 104
Figure 56: Energy savings and CO2 reduction per capita 104
Figure 57: Available roof area per capita and suitable roof ratio per LSOA 105
Figure 58: Contribution of solar energy by structure of tenure 105
List of Tables
Table 1: Data for London, Toulouse and Berlin 16 Table 2: Summary of solar modelling software and its characteristics 32xiii
Table 3: Cost of basic measures 36
Table 4: Cost of more complex measures 37
Table 5: Average cost per household 38
Table 6: Hackbridge by House Type 39
Table 7: Modelling patterns for 3D city models in LoD 2 60 Table 8: The calculated mean values for Hackbridge venture 72 Table 9: Energy output for different thresholds - yearly solar radiation 91 Table 10: Energy consumption, CO2 emissions and the contribution of solar power by
LSOA 93
Table 11: Energy savings and carbon reductions by building age p.a. 99 Table 12: Energy savings and carbon reductions for LSOA 1 and LSOA 5 p.a. 102
1
Chapter One
1.1 Background Introduction
Mass-retrofitting can be defined as the process of improving energy performance through adaptation and renovation at a community scale. It often involves modifications to existing commercial buildings that may improve energy efficiency or decrease energy demand (Deakin et al., 2012a, 2012b). Also, mass retrofitting can be referred to the addition of new technology or features to older systems by improving efficiency, increasing output, reducing emissions and refining existing buildings with energy efficiency equipment at a community measure. In addition, retrofits are often used as opportune time to modify existing equipment or structures with additional or new components or members and provides the opportunity to achieve significant carbon savings (Deakin et al., 2012, 2014; Richard P. 2016). Research suggests that 40% of the UK’s energy consumption and carbon emissions are caused by buildings energy use. Reducing emissions from buildings, by making them more energy efficient, is an important goal of urban planning. The energy consumption of buildings is dependent on a variety of parameters which are partly correlated (Edwards, 2009; Hetherington et al., 2010; DECC, 2013). Ratti et al.,
(2005) outline four main parameters which affect building energy performance: urban geometry, building design, systems efficiency, and occupant behavior. There are many energy performance software and models, which allow the analysis and simulation of buildings’ behavior. However, most of them focus on single buildings and therefore are unable to analyze urban areas as a whole. Also, Ratti et al.,
(2005) suggests these models are insufficient calibrated to study the energy performance of buildings, because they disregard the effect that urban geometry has on energy performance.
The analysis of Bourdic and Salat (2012), who compare different approaches to the measurement of energy performance show that morphologic models achieve the most accurate results, because they take all scales (city, district, single building) into account. According to Bourdic and Salat (2012), energy performance analysis must
2
cover the design, construction, use and occupation, for single buildings as well as for whole districts.
Research studies by (Ratti, Baker and Steemers 2005) offers an account of why urban morphology, design, layout and texture matters by way of and through what might be best described as a coded critique of how the “building scientist” approaches on the matter of energy performance. By way of and through a coded critique of the approach which assigns buildings a set of values to be read-off by type of design, system of construction and occupant behavior independent of their environment. This is because for (Ratti, et al., 2005) such a scientific reading of the subject offers too narrow a perspective on the design of buildings, their construction systems and occupational behaviors as determinants of energy performance and for the simple reason it fails to explain the high degree of variance between the values assigned to them and those experienced in the field. For them putting this right (i.e. explaining this variance in energy performance in terms of the gap between theory and practice) means that this study needs to transcend the all too narrow perspective of energy performance offered by the building scientist and broaden it out so as to begin accounting for the significance of renewable processes at play in such determinations (Deakin et al., 2014).
Ultimately, this means understanding the relationship that buildings have to their environment both by way of urban morphology and through the context-specific form which building design, construction systems, occupational behavior and renewable energy technologies takes on. This is because previous studies of this kind provide critical insight into the context-specific form of the building designs, construction systems and occupational behavior that is currently missing and which limits what is known about energy performance (Deakin et al., 2012, 2014). Focusing on the design, construction and occupational performances within the cities of London, Toulouse and Berlin, they find that variation in the consumption of energy by building, system and behavior, is something which cannot be explained by way of surface to building volume ratios alone, but through the relationship the passive to non-passive areas of their district centers also have to one another as neighborhoods. Together they propose these geometries account for up to 10% of the variance in energy performance previously left unexplained (Deakin et al., 2015).
3
As such, recent studies serve to confirm the maxim that urban morphology does matter and should be seen as an integral component of any energy performance assessment, because knowledge of their context-specific form can account for up to 10% of the variance between the assigned values of building designs, construction systems and occupational behavior. While this reaffirmation of urban morphology in terms of context-specific form offers a critical insight of some magnitude, it says little about how such knowledge of building design, construction systems, occupational behavior and renewable energy technology should be drawn on to start transforming either the neighborhoods, or district centers of cities of which they form an integral part (Deakin et at., 2014). The urban morphology and context-specific forms this takes on should not be ignored and ought to be integrated into the design of buildings, construction systems and occupational behavior, so any further investigation of the topic are left none the wiser as to how this broadening out of the subject can achieve this. While (Salat 2009) and Bourdic et al., (2012) have recently sought to develop the surface-to-building volumes and passive-to-non-passive area, more recent studies suggest they tend to be represented in strictly technical terms, distinct from either the social, environmental, or economic relationships. This is despite both authors clearly acknowledging the criticality of such measures.
Subsequently, several studies have clearly revealed that existing retrofitting have no morphological basis, geometry or physics for transforming urban districts, targeting energy consumption, carbon emissions and combatting global warming as part of a climate change adaptation. These studies go some way to highlight a serious fault in the line of reasoning building physics adopts to tackle global warming and combat climate change and need to ground mass retrofit proposals in the case-based reasoning, so as to found it on a more stable and secure procedural modelling approach.
According to Ratti et al., (2005), the first step in improving the energy performance of buildings is to study and simulate their behavior. However, many energy models and techniques have been developed for this purpose in recent years. These models usually adopt the perspective of the building designer: they tend to consider buildings as self-defined entities, neglecting the importance of phenomena that occur
4
at the urban scale. In particular, the effect of urban geometry on energy consumption still remains understudied and controversial.
Hetherington et al., (2010) make known that the Governments around the world are setting targets and legislating to reduce the carbon emissions related to the built environment. However, challenges presented by increasingly rigorous standards for construction projects will mean a paradigm shift in how new buildings are designed and managed.
Deakin et al., (2012a) suggests that retrofitting goes well beyond energy consumption, because retrofitting’s greater potential goes lies in incremental adaptation, reuse and renovation. For in [master]-planning suburban properties, more significant reductions in carbon emissions can be achieved with a systematic mix of house types.
This tends to suggest the literature currently available on retrofitting is selective, offering only a partial knowledge of the subject and is insufficiently comprehensive to offer an integrated solution. The purpose for this being that it either focuses exclusively on new development, or because the publications currently available on the renewal and redevelopment of the existing stock concentrate on reductions in energy consumption and not carbon emissions. For this study, the significance of renewables are the key components of the mass retrofit exploration: it promotes to reduce levels of energy consumption and carbon emission, vis-à-vis establish energy efficient-low carbon zones as an exercise in the development sustainable suburbs. In achieving such an integration and systematically demonstrating how urban morphology does matter, not as a process of new build, but incremental change and adaptation in the design and construction of city-districts; this study draws from networks of innovation across Europe and goes on to examine renewables as a clean source of mass retrofit proposal, contextualized and built-out as the fabric of an energy efficient-low carbon zone.
5
1.2 Research Aim
The aim of this study is to unfold the significance of renewable energy source in the retrofit and uncover the key contribution it makes to the levels of energy consumption and carbon emission.
1.3 Research Objectives
i. To review the literature on mass retrofits
ii. To use the findings of this literature review as a basis to augment and supplement the procedural modelling currently available to render roof structures a principal component of mass retrofit proposals
iii. To calculate the solar-power these roof structures generate as sources of renewable energy, by supplementing building footprint data with height and slope information.
iv. To reveal what these renewable energies contribute to the development of energy-efficient low carbon zones as sustainable suburbs.
1.4 Research Question
i. What do renewables contribute to the mass retrofitting of an energy efficient-low carbon zone as “sustainable suburbs”?
ii. In what way do the neighbourhood district-centres of these “sustainable suburbs” impact on the post-carbon economy and how does this in turn combat global warming as part of climate change adaptation?
1.5 Research Hypothesis
The renewable energy of an energy efficient-low carbon zone is a key driver in the urban planning and development of “sustainable suburbs” and geometry of an urban
6
morphology that not only tackles global warming but which also combats climate change.
1.6 Dissertation Structure
The following dissertation report will be structured as follows:
Chapter 1 – Introduction: This chapter will include a clear introduction to the
background of the chosen topic, the logic behind the proposed research, the purpose of the research, the hypothesis of the research, the aims of the research, the objectives of the research and the structure of the research.
Chapter 2 – Literature Review: This chapter will consist of a critical appraisal of
previous research and publications carried out in mass retrofits, energy efficiency of buildings, EU case studies, low carbon zones and renewable energy technologies. Variations in options and gaps in the research area will also be examined and are used as the basis for the approach of the research dissertation.
Chapter 3 – Methodology: The methodology consists of a justification of the
research methods used to investigate the areas where varied options and gaps were previously highlighted including a description of reasoning for the research approach and method of analysis.
Chapter 4 – Analysis of result and findings: A clear presentation of results with
analysis and interpretation of findings, exclusively in relation to the findings of the literature review.
7
Chapter Two
2.0 Introduction
2.1 Hackbridge Suburb
In 2009, the London Borough of Sutton, its partners and the community made Sutton the first ‘One Planet Borough’ by launching a One Planet Action Plan and committing to live within a fair share of the earth’s resources by 2025. Some of the most challenging environmental targets in the UK were set, and good progress is being made. ‘One Planet Living’ is a framework developed by BioRegional (a social enterprise and environmental charity located in Hackbridge). It incorporates ten principles of sustainability encompassing individuals, the community, businesses and the public sector (Deakin et al., 2012, 2013, 2014).
The Hackbridge project has been chosen because it is identified as Sutton’s flagship sustainable community development. Thus, Hackbridge displays some major strengths but at the same time is an ordinary suburb. The development proposed in the area also offers an opportunity to ‘try out’ certain initiatives. Hackbridge contains the world renowned ‘BedZED’ (Beddington Zero [Fossil Fuel] Energy Development) where BioRegional are based (London Borough of Sutton 2008a).
Significant levels of regeneration are occurring within Hackbridge. A masterplan has been developed to create the UK's first ‘truly sustainable suburb'. Detailed plans include 1,100 new sustainable homes, more shops, leisure and community facilities, new jobs, sustainable transport including pedestrian/ cycle initiatives and improved networks and open spaces (Deakin et al., 2013). The Council’s Core Strategy for
planning was adopted in December 2009. The strategy contains a commitment for all new buildings constructed in Hackbridge from 2011 onwards to be zero carbon. The Hackbridge community are currently working on their Neighbourhood Plan as part of CLG’s Neighbourhood Planning Front Runners Scheme (London Borough of Sutton 2008b).
8
2.1.1 Zero Carbon Hackbridge
The London Borough of Sutton has committed to a 100% reduction in carbon dioxide emissions from buildings by 2025, with additional ambitious carbon targets for construction materials, transport, food and consumer goods. Hackbridge is the best place to pilot this zero carbon buildings target. In fact, research suggests that the following initiatives are already taking place in the area (London Borough of Sutton 2008a):
Sustainability visits: Eco-auditors visited around 70 homes in Hackbridge in 2008 to advise them about sustainable living, focussing on energy efficiency. Hackbridge Low Carbon Zone: Part of Hackbridge is the location for one of
the Greater London Authority’s Low Carbon Zones. Residents are being provided with free energy audits, easy energy efficiency measures and are eligible for discounted insulation measures.
Greening businesses in Hackbridge: The London Borough of Sutton secured ERDF funding to deliver a programme of sustainability support for the businesses in and around Hackbridge. BioRegional are delivering this work. Businesses are given one to one support on reducing energy, water and waste. So far 39 businesses in and around Hackbridge have had an energy audit undertaken. Organisation-specific environmental policies have been formulated for 18 of these businesses.
A district heating network has been proposed and encouraged by the Local Authority and is being procured by the developer of the largest development site in Hackbridge. This may be supplied by waste heat from a nearby landfill site.
Subsequently, the UK Government set out a definition for ‘zero carbon homes’; they must have zero net emissions from all energy use in the home over the course of a year. Similarly, consultation to add further detail on the definition of zero carbon and to extend it to non-domestic buildings was initiated at the beginning of 2010
9
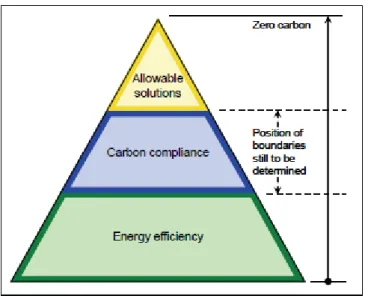
(Hetherington et al., 2010). Given the contribution from solar is limited to 6-7% approximately if we add the deep retrofit and solar components then the rest must come from offsite developments. However, a three-tiered approach for reaching net zero emissions is adapted by the Government, illustrated as a hierarchical triangle in Figure 1.
Figure 1: Hierarchy of permissible methods to achieve zero carbon developments.
Source: Zero and low carbon buildings - A driver for change in working practices and the use of computer modelling and visualization.
10
The position of the boundaries between the areas of the triangle in Figure 1, that is for example, the percentage allocated for ‘Allowable solutions’, are still being debated.
In the light of this, Deakin et al., (2012a, 2012b, 2013, 2014) developed the approach for such a base-lining exercise and applied it to Hackbridge where it was found that the task relates to environmental profile which this adaption strategy is based on. It is discovered wanting for the simple reason the Energy Options Appraisal is not clear as to whether the energy savings and carbon reductions generated from the forecast rates of consumption and emission will be spread equally amongst all occupants. Previous studies by Deakin et al., (2012a) also took the opportunity to undertake an extensive appraisal of mass retrofit methodology, to establish the nature and extent of current ‘state-of-the-art’ applications. In adopting Hackbridge as an innovative case study, Deakin et al., (2012a, 2012b, 2013) analyzed not only the potential impact of the project in terms of reducing energy consumption and carbon emissions, but also considered the ‘institutional arrangement’ underpinning the mass-retrofit proposals. In developing a comprehensive profile of Hackbridge, Deakin et al., (2013, 2014) raised questions as to the equitable distribution of benefits arising from the venture. In particular, concerns raised as to the potential divisiveness of the projects participation criteria which, at present, excludes the social rented sector from involvement in the venture. Deakin et al., (2014) have identified this discriminatory approach undermines the project’s mandate of promoting environmental sustainability, in that it only serves to accentuate socio-economic discrepancies between resident groups.
2.1.2 Sustainability
Several studies illustrated that zero-carbon legislation does not specifically mention sustainability. It is, however, included in the BREEAM [BRE Environmental Assessment Method] assessments and the Code for Sustainable Homes, which whilst not a legal requirement, can be a condition of public funding (Hetherington et al., 2010). However, sustainability is concerned with many more issues in addition to
11
the reduction of fossil fuels. The Brundtland definition of sustainability is “meeting the
needs of the present without compromising the ability of future generations to meet
their own needs” (World Commission on Environment and Development, 1987). This
is now considered over simplistic. Elkington (1998) suggests that the triple bottom line of economic, ecological and social sustainability is considered better criteria for measuring organizational (and societal) success. In this instance, the BRE [Building research Establishment] further describes it as “a complex web of systems and cycles in science, economics, politics, ethics and engineering” (Atkinson, 2009). In addition to the energy required to light, heat or cool, and run appliances within buildings in Hackbridge, Hetherington et al., (2010) suggests there is energy to construct, refit and demolish it. This energy is embodied within the building. A sustainable approach, ‘cradle to cradle’, would have the buildings in Hackbridge reprocessed into another building, as shown in Figure 3.
Figure 3: Sustainable building life cycle (Hetherington et al., 2010).
Energy use is one important consideration of sustainable construction; there are many other life cycle considerations such as water resources, pollution, biodiversity, habitat, ecosystems. (Hetherington et al., 2010). Whilst this research deals with
12
mass retrofitting of an energy efficient low as a driver for transformation in Hackbridge, the larger picture should be borne in mind.
2.1.3 UK Building Emissions
Consequently, emissions from buildings accounted for 37% of total UK greenhouse gas emissions in 2012 (Figure 4). Residential emissions account for 66% of buildings emissions, with commercial and public sector emissions accounting for 26% and 8% respectively. They comprise 45% direct CO2 emissions (i.e. from burning fossil fuels) and 55% indirect (grid electricity-related) emissions (DECC, 2013).
Figure 4: Emissions from buildings in the context of total UK emissions. Source:
NAEI (2015), DECC (2013), Energy Trends, March 2013, DECC (2012) DUKES; CCC calculations.
Between 2003 and 2008, buildings CO2 emissions fell by 3%, mainly due to improved energy efficiency. Since 2008, buildings emissions have fallen by 8% but have shown year-to-year fluctuations due to economic and temperature effects, i.e.
13
while in 2009, emissions dropped 10% due to rising fuel prices and the recession, they increased by 7% in 2010 due to cold weather, but fell again (by 14%) in 2011 due to warmer winter months and rising fuel prices (NAEI, 2015). However, as part of the ambition of Sutton for buildings to be zero carbon by 2016 for residential buildings and 2019 for non-residential buildings, CO2 emissions per square metre from 2013 will be at least 40% below the Notional Building emissions as defined by Building Regulations Part L 2010 NCM software; for this development, the figure has been set to 25% reduction in CO2 emissions as defined in the Local Authority’s decision notice. In the light of this, it is proposed that (DECC, 2013; NAEI, 2015).
2.2 The Study of Urban Morphology
Several studies define urban morphology as the study of the form of human settlements and the process of their formation and transformation. Also, it seeks to understand the spatial structure and character of a metropolitan area, city, town or village by examining the patterns of its component parts and the process of its development. This means understanding the relationship that buildings have to their environment both by way of urban morphology and through the context-specific form which building design, construction systems and occupational behavior takes on. This is because for Ratti et al., (2005), urban morphology provides a critical insight into the context-specific form of the building designs, construction systems and occupational behavior that is currently missing and which overlooked what is known about renewables as a clean source of energy. Focusing on the design, construction and occupation of buildings within the cities of Berlin, Toulouse and London, Ratti et al., (2005) find that variation in the consumption of energy by system and behavior of the occupiers, is something which cannot be explained by way of surface-to-building volume ratios alone, but through the relationship the passive to non-passive areas of their district centers and neighborhoods also have to one another. Together they propose these geometries account for up to 20% of the energy performance, with building designs, construction systems and occupational behavior making up the other 80%.
14
Nevertheless, the background research to the study of urban morphology by Ratti et al., (2005) is based on March’s (1972) analysis of building heat loss, Owens’ (1986)
extension of this across house types and the augmentation of this by Steadman et al., (2000) to cover the non-domestic sectors. All of this is in turn captured and represented in Steemer’s (2003) study of energy consumption within cities and in relation to the density of buildings alongside their associated mobility and transportation networks.
Against this backdrop, Ratti et al., (2005) explore the effects of urban texture on building energy consumption. Their work is based on the analysis of Digital Elevation Models (DEM) in Paris, London and Toulouse. In these studies, the DEMs are stored in a 2D-Matrix with height values and processing tasks constructed by means of MatLab software. Building energy consumption in general is dependent on many parameters which are partly correlated with each other. Ratti et al., (2005) outline four main parameters which impacts upon energy performance. Highlighting urban geometry, building design, construction systems and occupants’ behavior as the “four parameters of energy performance”, their study aims to loosen the grip buildings have on energy performance by way of and through analysis of the geometric form they take. In loosing this grip and highlighting all four parameters of energy performance, Ratti et al., (2005) draw attention to two ratios whose geometric form set the parameters for the other three (buildings, construction systems and occupational behavior).
The first ratio draws on the earlier research of March (1972) which arose from the question: “which shape should a building have to minimize heat loss?” For his building design model March (1972) assumes that its shape is perfectly rectangular, that thermal transmittance is equal through all external walls and there is no heat transfer from the building to the ground. This is referred to as the surface-to-volume ratio (STVR) and value which is calculated by dividing the overall building envelope area (without ground area) by the volume. However, Ratti et al., (2005) suggest the STVR is not a very good indicator of energy performance, because only heat lost through the exposed building envelope is measured, while any gains from the use of natural ventilation and sunlight for heating and lighting purposes is ignored.
15
Taking the limitations of the STVR into account, Ratti et al., (2005) advance another ratio that sub-divides buildings into passive and non-passive areas. Here passive-areas measure the parameters of buildings lying within six meters of the façade or within twice the ceiling height. These passive-areas gain from natural ventilation and sunlight, whereas non-passive areas do not. The ability buildings should use natural ventilation and sunlight is referred to as the passive-volume-to-total-volume ratio
(PVTVR). This ratio is another attempt to analyze the geometry of a building’s energy performance and its limitations are also drawn attention to. This is because passive areas can still be wasteful, as mechanically lit their ventilation and glazing ratios may be very low, allowing heat loss through external walls and roof spaces to be greater than gains from sunlight.
Seeing that only an integrated energy model can overcome such limitations in the measurement of energy performance, Ratti et al., (2005) make use of the LT-method (light and thermal method) to calculate the annual heating, lighting, ventilating and cooling of buildings in terms of use/m². This model considers a variety of factors, including solar gains, shading of a neighbor’s house (indicated by the obstruction sky view) and degree of daylight that is either reflected from opposite facades (information about the orientation of facades is needed to calculate this) or which is directly received from the sun. The LT-method is applied by Ratti et al., (2005) to analyze the energy performance of blocks, neighborhoods and districts in the cities of London, Toulouse and Paris. The findings of these studies are held up as examples of how urban morphology has a bearing on energy performance when analyzed in terms of both the STVR and PVTVR values for the “blocks, neighborhoods and districts” of the building designs, construction systems and occupational behaviors under investigation.
Consequently, Deakin et al., (2013) demonstrates how urban morphology does matter in the perspective of reaching beyond the geometry of building design, construction systems and occupational behaviors and towards broader context-specific transformations. Similarly, Deakin et al., (2014) go on to demonstrate how urban morphology matters, by way of and through what might be best described as a coded critique of how the “building scientist” approaches the matter of energy performance. More importantly, by way of and through a coded critique of the
16
approach which assigns buildings a set of values to be read-off by type of design, system of construction and occupant behavior independent of their environment. However, while the aforesaid successfully extends urban morphology into the fields of carbon emission, global warming and climate change adaptation, it fails to highlight the role which renewables play in this transformation to sustainable development. This oversight is important to correct because it clearly fails to recognize the contribution renewables make to sustainable development, and solar power as a clean source of energy with zero carbon emission.
2.2.1 London, Toulouse and Berlin Case Study
The data presented in Table 1 were collected in three DEMs that represent central areas in London, Toulouse and Berlin. Berlin has the minimum surface-to-volume ratio and therefore minimizes heat losses; London and Toulouse follow. The increase can be as large as 45%, a figure that suggests a potentially significant energy impact. However, a question arises: is it correct to aim to minimize the exposed surface of buildings? If this principle were accepted, the best shape to accommodate all the volume of the London case study site would be a March halfcube (or a full cube if ground losses are taken in to account).
Table 1: Data for London, Toulouse and Berlin (Ratti et al., 2005).
London Toulouse Berlin
Ground floor area (m²) 89,663 64,368 55,978
Un-built area (m²) 70,377 95,632 104,022
Built volume (m²) 1,221,499 966,768 1,042,199
Vertical surface (m²) 174,757 174,888 119,698
Surface to built volume ratio (mˉ¹) 0.216 0.248 0.169 Average energy consumption in passive &
non-passive zones (KWhm/p.a.)
0.0683 0.0668 0.0731
Average energy consumption in passive zones (KWhm/ p.a.)
0.0590 0.0599 0.0585
Average energy consumption in passive zones with optimum glazing ratio
17 (KWhm/p.a.)
In another case study, Salat (2009) compares the urban morphology of Paris with the energy consumption of building designs. This analyses the impacts which the types of urban morphology factors listed below have on building designs, construction systems and occupier behaviors in terms of energy consumption and CO2 emission.
• Mean and standard deviation of building height • Mean and standard deviation of vegetation height • Building height histograms
• Area-weighted mean building height • Area-weighted mean vegetation height • Surface area of walls
• Plan area fraction as a function of height above the ground surface • Frontal area index also as a function of height above the ground surface • Height-to width ratio
• Sky view factor • Roughness length • Displacement height
• Surface fraction of vegetation, roads, and rooftops • Mean orientation of streets
In this case study, 96,000 residential buildings are analyzed and five key components of energy consumption are calculated in accordance with the contribution they make to levels of CO2 emission. The key components, derived from this case study, along with their factor contributions are set out below:
Efficiency of urban morphology (e.g. density) (1.8) Building design performance (e.g. shape, envelope area) (2.5) Efficiency of construction systems (e.g. age of boiler) (1.8)
18
Under this factor-component model, the city is represented as a homogenous entity where urban morphologic values, such as density, mobility-networks and accessibility are related to one another. Like Ratti et al., (2005), Salat (2009) sees the ultimate value of this model lying in the ability it must isolate the contribution urban morphology makes to energy performance when measured in terms of either the STVR or PVTVR. For in the case of Paris, the ratios calculated and drawn upon as measures of energy performance, suggest the traditional, dense-built courtyards of this city have a good STVR and PVTVR. Good in the sense that unlike their modern counterparts, which are characterized as dispersed low-density developments and found in the suburbs of Paris, these offer building designs, construction systems and occupational behaviors which illustrate poor STVR and PVTVRs. However, the following statement from Bourdic et al., (2011: 483) goes some way to clarify the position adopted. As is stated: “our [position] is embedded in the factor approach to reducing resource consumption traduced by Ernst von Weizeacker in his book: Factor Four: Doubling Wealth, halving Resource use. He starts from the principle that reducing our energy footprint can be facilitated by breaking down into factors, each which can examined separately as a lever for action. Ratti et al., (2005), adopted this concept specifically to the urban environment in the factor breakdown shown. Urban morphology can contribute to halving energy consumption and greenhouse gas emissions. In this system of indicators, attention is focused upon the morphological aspects that follow from the principles developed and which will take up building technology to a certain extent, being that it is sometimes hard to separate the latter from the former, and that the latter is essential when it comes to measuring the energy consumption of a district and city”.
Having made this statement, Salat (2009) goes on to highlight the significance of this “focus on morphological aspects” further by characterizing it as distinct from and as opposed to matters of “building technology”, while configuring the former as to “take-up” aspects of the latter. This process, whereby the former takes up the latter and this is then singled out as an “essential”, component of any such factor analysis, especially when it comes to measuring energy consumption and carbon emissions”. The model illustrated in Figure 5 serves to indicate how this is possible. As can be seen it represents morphology as the extreme boundary of the energy performance
19
model. An energy performance model whose boundaries which in turn are seen to capture the thermodynamic and constructed tendencies, ecology, exergy, entropy and fractal geometry that make up the complex (invariant) structures (in this instance, highly structured, resilient and adaptive systems) subsequently advanced as the area-based, vis-a-vis spatial “scales of analysis” illustrated in what is referred to as a “Pareto distribution” of this configuration. This in turn gives rise to the morphology of large scale assessments that cover cities, their districts, neighbourhoods and blocks and which in turn capture smaller scale equivalents rendered in terms of buildings, systems and behaviours. However, Salat (2011: 484) goes on to further bestow the virtues of this model by suggesting it: “responds simultaneously to social needs – by improving the day-to-day quality of life of residents – to environmental objectives – by reducing resource and energy consumption – and to economic considerations – by valorizing places, fostering activities and saving money through the reduction of resource and energy use.”
In view of the potential which exists to save energy and reduce carbon emission by as much as 50%, Bourdic et al., (2012) stress that to capitalize on such virtues, save energy, reduce carbon emissions and sustain development, stakeholders need robust methods capable of assessing such possibilities. As they point out: many tools and assessment methods have been developed to improve energy performance. However, as Bourdic et al., (2012) also goes on to stress: most of these methods are still based on the building envelope and given stakeholders are now convinced the so-called “building scientist” approach is too narrow to capture the role urban form plays in the determination of energy performance, these assessments now need to be extended so they can cover the buildings, systems and occupants of both the blocks, neighborhoods and districts of cities.
The reason Bourdic et al., (2012) reiterate this message is not immediately clear, but is important because it throws much-needed light on what the calculation of the STVR and PVTVRs for Berlin, Toulouse, Paris and London offer in terms of energy performance. For what they offer is ‘proof of concept’ and evidence as to the significance of urban morphology as a key component of energy performance. That is as a key component of energy performance that not just matters, but which should
20
also be considered alongside the building design, construction systems and occupational behaviors of any such determinations. Alongside and therefore in conjunction with the buildings, systems and occupancy components which determine energy performance. For only in this way is it possible to account for the 20% of energy performance which relates to urban morphology, but other factor weightings that make up the remaining 80% of the total measure (Deakin et al., 2015).
This is perhaps why Bourdic et al., (2012) go on to review the potential there is to integrate their urban morphology model of energy performance with those adopted to assess buildings, systems and occupant determinations. For this purpose, the nested configuration of urban morphology is set aside and the “common six-step analytical grid” first developed by Ratti et al., (2005) is then augmented by Bourdic et al., (2012) so this model of energy performance can be used as an assessment system.
2.2.2 Factors that Affect Energy Consumption in Buildings
Figure 5 sets out the six-step analytical grid first developed by Ratti et al., (2005). This analytical grid in subsequently augmented by Baourdic et al., (2012) to classify the types of ‘calculation tools’ such models and assessment systems should adopt. This ‘grid of calculation tools’ is then applied to review the strengths and weaknesses of these assessments. Bottom-up, agent-based models are under-determined at anything more than the building scale (i.e. block, neighborhood, or district), whereas the economic models are too top-down and therefore over-deterministic. Likewise, energy-environment models are being too aggregated, overly analytical and stuck in the diagnostic stage of development. For this suggests it unable to provide any information on the intervention mechanisms which are available to improve buildings energy efficiency and cut carbon emissions.
21
Figure 5: Factors that affect energy consumption in buildings (Ratti et al., 2005).
Turning to the morphologic models, Bourdic et al., (2012: 522) state these models: “significantly differ from the three other types described above. While morphological approaches to quantify energy consumption and carbon emissions for the building sectors remain rare, two are analyzed here: one is limited to the residential sector, the other to commercial buildings (Yamaguchi, 2003). Both are based on a scale that is larger than the individual building and aim to account for the interactions between buildings. These are the only methods that explicitly consider the district or city as a whole, as opposed to the sum of the individual buildings”.
As they go on to say: “these models provide aggregations which consider all the scales that constitute the urban fabric of buildings, blocks, neighborhoods and districts. By using intermediate scales of aggregation, the loss of information in the process is structurally lower than with other models. They provide them an undeniable operationality to monitor the impact of energy performances on several scales.”
The only downside of these models is seen by Bourdic et al., (2012) to lie in the fact they are restricted to the context of buildings and do not extend into either the energy systems, or occupation components of energy performance. Taking this form, the review from Bourdic et al., (2012) serves to capture the state-of-the-art on the types of building energy models drawn attention to by the likes of Ratti et al., (2005) and urban morphology approach to the fabric of buildings, blocks, neighborhoods and districts highlighted by Salat (2009) and Bourdic et al., (2012). However, it also serves to highlight the fact that current state-of-the developments still leaves the four main components of energy performance only loosely coupled in these models and lacking the systematic integration which is needed for this requirement to be fully accounted for.
22
Reflecting on this development, Bourdic et al., (2012: 529) go on to state: “it is
probable that no single model or calculation tool will succeed in considering these four factors at the same time. Therefore, research efforts should focus on the inter-actions and relationships between existing models. Transversal approaches based on existing models and tools may lead to a more systematic and comprehensive understanding of urban efficiency, making good – or at least better – use of all of the intervention opportunities”.
In responding to this challenge, they go on to advance an innovative system of indicators that in their opinion meet the call for multi-scalar and cross-cutting indicators which encompasses the intrinsic complexity of the situation. Based on this morphologic approach, new mathematical formulas are used to generate urban sustainability indicators. They suggest these indicators can assist with the comparison of urban projects by structuring them into techniques of analysis capable of assessing energy efficiency, alongside and in conjunction with the social and environmental components of urban development.
Figure 5 provides an extract sample of indicators, by type and triptych (sustainable urban development as the environmental, social and economic pillars of climate change) adopted to capture the morphology of city-districts. The urban morphology, typology and grids they present are said to be ‘exceptional’ and of particular value because: “while some governments are committing themselves to reducing energy consumption and carbon emissions, they need tools to measure the current performance of their cities, to find the levers to reduce it and to assess the efficiency of the actions engaged. Therefore, assessment systems play such a key role. However, cities are incredibly complex systems, made of components that can be identified using different point of views. Assessments based on single or simple metrics such as energy flows are insufficient to address the wider socio-ecological aspects of cities.” (Bourdic et al., 2012).
23
2.2.3 The Principal Component of Mass Retrofit
Figure 6 sets out the standard morphologic model first advanced by Ratti et al.,
(2005) and serves to reaffirm the relationship between climate and what are referred to as the four structural (context, buildings, systems and occupational) components of urban energy performance. It does this by overlaying the model with the components Bourdic et al., (2012) offer. For here the application of the Digital Elevation Model (DEM) to analyze the context is represented, along with the tools for analyzing the buildings found within the respective forms, shapes and envelopes. This in turn draws attention to the themes that make up the systems and triptych (sustainable development) of their use and occupation.
Figure 6: Factors that affect energy consumption in buildings (Deakin et al., 2014).
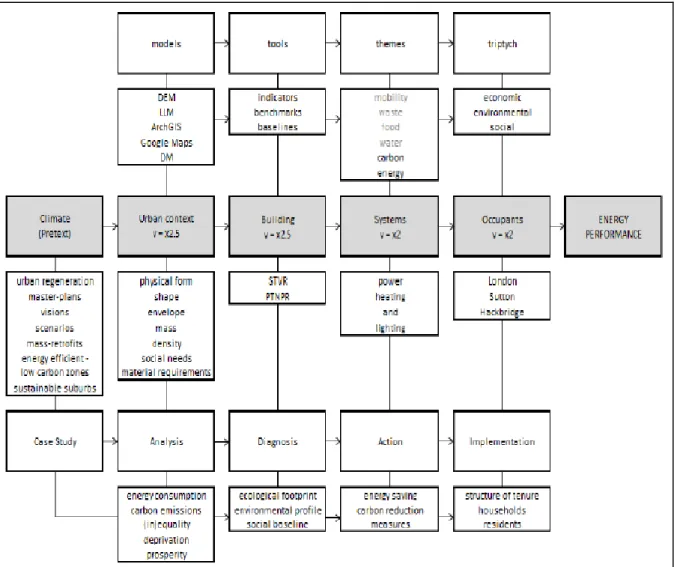
Figure 7 develops this representation further. This begins by setting out the pretext to the interest in climate change and application of the morphologic models set out here as part of an adaptation strategy. Here particular attention is drawn to the mass retrofitting of an energy efficient-low carbon zone as a sustainable suburb both by way of an urban regeneration strategy and through the visions, master-plans and development scenarios such a transformation is based on (Deakin et al., 2014). Moving from top-to-bottom, this in turn indicates the Lighting and Thermal Method (LTM) is supplemented with a 3D rendering of the context grounded in ArchGIS technologies and Google maps. Also, Deakin et al., (2015) suggests this represents a context that is underpinned by an analysis of the social needs and material requirements which such a demographic imparts on an information system. On an information system, whose ecological, exegetic and entropic qualities supports the physical form, shape and envelope of both the densities and mass of geometries which are placed under examination (Deakin et al., 2015).
24
Figure 7: Factors that affect energy consumption in buildings (Deakin et al., 2014).
According to Deakin et al., (2014), the next column in this representation draws attention to the tools available to indicate, benchmark and baseline the STVR and
25
PVTVR of the blocks, neighborhoods and districts under examination. This in turn leads to the themes (energy, carbon, water and mobility issues) linked to the power, heating and lighting systems central to mass retrofit proposal. Likewise, Deakin et al., (2015) suggest the final column highlights the triptych in terms of the social, environmental and economic sustainability of those occupying this energy efficient-low carbon zone.
Under this rendering of the material lies a further level of case-study analysis. This focuses attention on the diagnosis, action and intervention of urban planners, architects, designers and building contractors in Hackbridge and those promoted in the interests of securing the transformation of Sutton into a sustainable suburb (Deakin et al., 2015).
2.3 Effect of Urban Morphology on Energy Consumption
Several studies suggest that impact of urban morphology on the energy consumption of buildings mainly relates to the availability of sunlight and daylight on buildings. Albeit solar energy as a major source of renewable energy can be used to make buildings more energy efficient and reduce carbon emission. In this essence, solar energy can be used in terms of passive solar gains or converted into renewable energies. Cities offer a huge solar resource which is mostly unexploited.
Upon other factors influencing energy consumption, such as occupant behavior, sun patterns and energy received from the sun are predictable. Thus, question arises in several studies about how the availability of sunlight is affected by urban forms. However, it is established that the energy performance of denser cities is better, regarding morphological indicators. On the other hand, how does for instance density of buildings affect the solar potential? In this logic, the calculation of solar radiation as part of the morphological analysis of 3D city models at urban scale can provide a deeper general understanding of the energy performance of cities.
Previous studies by Carneiro et al., (2009) examined morphological indicators that provide information about how different urban models behave in terms of solar
26
energy. As a matter of fact, their investigation offers the estimated solar radiation for two pilot zones in Geneva. Albeit the first is an historical district with a dense fabric and few open spaces while the second is a modern district that has a lower density, smaller buildings (two stories high) and more open spaces. Also, Carneiro et al.,
(2009) analyzed built volume, mean built height, theoretical population, urban built density and ground coverage as morphological indicators. For these measures asses, the SVTR to quantify the compactness of a district. While the first district is more compact than the second district, the results in terms of irradiance are similar for both urban morphologies. In this essence, Carneiro et al., (2009) states that “nevertheless the production of solar energy on low density areas is easier due to less urban obstructions and a lower population density. The lower population density combined with the building typology results in more potential solar roof area per person”.
2.3.1 Solar Radiation
The sun is the primary source of energy for life on Earth. However, solar energy is the result of a nuclear fusion at the core of the sun. This results in a surface temperature of around 5,800 Kelvin. The spectrum of emitted electromagnetic radiation from the sun is like that of a 5,776 K blackbody, whereby around 50% lies in the infrared region, around 40% in the visible region and approximately 10% in the UV region (Sun et al., 2003). The total amount of radiation released is approximately 63,000,000 Watts per square meter (W/m²) (Pfidwirny, 2006).
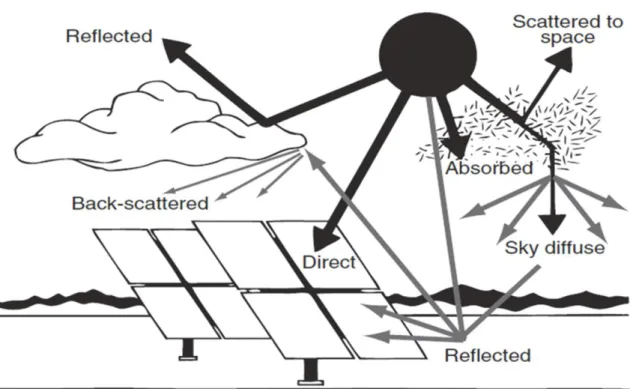
According to Muneer (2004), solar radiation data is usually given as the amount of energy received on a horizontal surface. However, Sun et al., (2003) suggests that the amount of extra-terrestrial irradiation reaching the earth’s atmosphere, at the mean earth sun distance of 149,597,890 km, is called the solar constant. It is calculated from long-term measurements to be around 1366 W/m². By means of entering the Earth’s atmosphere, solar radiation is absorbed and scattered as shown in Figure 8. The radiation reaching the surface unobstructed is called direct (beam) radiation. However, it is responsible for casting shadows as the rays are still collimated and can be blocked by an object. For radiation scattered by atmospheric
27
gases, aerosols, clouds and the Earth’s surface is called diffuse radiation. (Sun et al., 2003).
Muneer (2004) suggests that diffuse and direct radiation combined result in the global radiation on a surface but tilted surfaces in contrast to horizontal surfaces receive a combination of direct, diffuse and additional reflected radiation from surfaces. In urban areas, this component can be quite significant.
Figure 8: Segregation of solar radiation by the atmosphere (Badescu, 2008).
According to Badescu (2008), the difference between global solar radiation at the Earth’s surface and the corresponding value at the top of the atmosphere is, what has been absorbed or reflected away. Also, this difference is referred to as the Earth’s albedo and about 29% of the incident solar radiation. However, the total amount of solar radiation incident on a given surface during a specified period is called insolation or solar irradiation. For each site on the Earth surface, the received insolation differs as a function of the Earth’s geometry and geographical conditions. Studies suggests these factors can be grouped in three categories (Suri and Hofierka, 2004):
28 2. Regional - Terrain
3. Atmospheric attenuation
2.3.2 Global Factors
On a global scale, the relative position of the Earth to the sun strongly influences the amount of radiation the Earth’s surface receives. By means of using astronomical formulas, the available radiation can be precisely calculated (Suri and Hofierka, 2004).
Thus, the Earth rotates around its own axis, causing daily cycles of day and night. Also, the Earth’s rotation axis is tilted at 23.5°, known as declination. On its orbit around the sun the relative position of the Earth’s axis to the sun changes. The tilt is toward the sun (June +23.5°) or away from the sun (December -23.5°) (Grondzik, 2010). This variation is responsible for the annually changing height of the sun above the horizon and controls the length of the radiations path through atmosphere, which are determining the duration and intensity of solar radiation received on the Earth’s surface. Therefore, the tilt causes the seasons, with the altitude of the sun being the highest in summer and lowest in winter.
For any point on the Earth’s surface, the position of the Sun is defined by its altitude angle and azimuth angle. The altitude angle specifies the height of the sun in the sky above the horizon. At sunrise and sunset, the altitude is 0°. It reaches its daily maximum at solar noon. The altitude at solar noon varies throughout the year, reaching a yearly maximum on June 21 and its minimum at December 21. It depends on the latitude of the position and the tilt of the Earth and can be expressed by following equation (Grondzik, 2010):
Altitude angle at solar noon = 90° - latitude +- declination.
The azimuth angle, which is also affected by the seasons, is the angle between the position of the Sun and true south (Grondzik, 2010).
29
2.3.3 Regional Factors
At regional scale, the amount of available solar radiation incident on a surface is modified by the terrain, which causes high spatial and temporal differences in local values (Suri and Hofierka, 2004). Although modifying features have variations in elevation, the slope inclination and orientation, as well as shadows casted from neighbouring terrain features. More importantly, these circumstances can be modelled with a high accuracy, e.g. with a digital elevation model (DEM).
2.3.4 Atmospheric Factors
Previous studies suggest that the third factor is the above-mentioned absorption and scattering of solar radiation in the atmosphere. Albeit extra-terrestrial radiation passing the Earth’s atmosphere is attenuated by atmospheric gases, aerosols and clouds, whereby clouds are the most important regulator of solar radiation with regularly 65% of the earth covered by clouds (Sun et al., 2003).
In addition, maximum insolation is obtained when the sky is clean and dry. However, the influence of atmospheric attenuation can be calculated. Real-sky (overcast) radiation values consider all three factors, clear-sky radiation values (cloudless) omit the cloud attenuation (Suri and Hofierka, 2004).
2.3.5 Modelling Solar Radiation Estimates
While the understanding of solar energy incident on the building envelope is essential to improve the sustainability of urban settlements. Previous examination suggests that estimates of the spatiotemporal solar radiation distribution, and thereby information of solar radiation and its components at a location, allow to assess the potential of renewable energies. Also, the amount of solar energy incident on a surface is strongly determined by the surrounding terrain and features. However, varying elevations, aspects and shadows create strong local gradients in