R E S E A R C H A R T I C L E
Open Access
Factors affecting the accuracy of a class
prediction model in gene expression data
Putri W. Novianti
1*, Victor L. Jong
1,2, Kit C. B. Roes
1and Marinus J. C. Eijkemans
1Abstract
Background:Class prediction models have been shown to have varying performances in clinical gene expression datasets. Previous evaluation studies, mostly done in the field of cancer, showed that the accuracy of class prediction models differs from dataset to dataset and depends on the type of classification function. While a substantial amount of information is known about the characteristics of classification functions, little has been done to determine which characteristics of gene expression data have impact on the performance of a classifier. This study aims to empirically identify data characteristics that affect the predictive accuracy of classification models, outside of the field of cancer.
Results:Datasets from twenty five studies meeting predefined inclusion and exclusion criteria were downloaded. Nine classification functions were chosen, falling within the categories: discriminant analyses or Bayes classifiers, tree based, regularization and shrinkage and nearest neighbors methods. Consequently, nine class prediction models were built for each dataset using the same procedure and their performances were evaluated by calculating their accuracies. The characteristics of each experiment were recorded, (i.e., observed disease, medical question, tissue/ cell types and sample size) together with characteristics of the gene expression data, namely the number of differentially expressed genes, the fold changes and the within-class correlations. Their effects on the accuracy of a class prediction model were statistically assessed by random effects logistic regression. The number of differentially expressed genes and the average fold change had significant impact on the accuracy of a classification model and gave individual explained-variation in prediction accuracy of up to 72% and 57%, respectively. Multivariable random effects logistic regression with forward selection yielded the two aforementioned study factors and the within class correlation as factors affecting the accuracy of classification functions, explaining 91.5% of the between study variation.
Conclusions:We evaluated study- and data-related factors that might explain the varying performances of classification functions in non-cancerous datasets. Our results showed that the number of differentially expressed genes, the fold change, and the correlation in gene expression data significantly affect the accuracy of class prediction models.
Background
As one of the major types of analyses for gene expres-sion studies, supervised learning or classification has re-ceived high attention. Studies vary from the application of supervised methods to real-life problems like in [1–3], methods comparisons [4, 5] and methods development [6, 7]. Methods to build predictive models are widely
available in the literature and it had been shown that the performance of a classification method varies, depending on the dataset to which the method is applied [8]. The characteristics of a dataset that naturally could be han-dled by a classification function might be one of the underlying reasons accounting for this variability. A clas-sical method like linear discriminant analysis works under an assumption of the equality of covariance matri-ces between classes; while penalized logistic regression could handle a dataset with strongly correlated variables. Other specific study factors had also been shown to de-termine the predictive ability of a classification model,
* Correspondence:[email protected]
1Biostatistics & Research Support, Julius Center for Health Sciences and
Primary Care, University Medical Center Utrecht, 3508GA, Utrecht, The Netherlands
Full list of author information is available at the end of the article
© 2015 Novianti et al. This is an Open Access article distributed under the terms of the Creative Commons Attribution License (http://creativecommons.org/licenses/by/4.0), which permits unrestricted use, distribution, and reproduction in any medium, provided the original work is properly credited. The Creative Commons Public Domain Dedication waiver (http:// creativecommons.org/publicdomain/zero/1.0/) applies to the data made available in this article, unless otherwise stated.
such as model building technique, array platform, clin-ical problem and sample size [9, 10]. Most of these char-acteristics are related to the technology or procedure and not to the specific data at hand. The characteristics of a gene expression dataset together with the nature of a classification function may play a key role in yielding a good class prediction model for gene expression data.
Evaluation studies on the aforementioned factors were based on classification models within the field of cancer. The effect of these factors might differ on datasets from non-cancerous diseases. This is because most cancerous diseases are often tissue specific unlike non-cancerous dis-eases that might involve the entire system and hence have different complexities. As one of gene expression data characteristics that has been proven by [11] to have an ef-fect on the performance of probabilistic classifiers when calibration and refinement scores were used as model evaluation measurements, correlation structures have been shown to differ significantly between datasets from both cancerous and non-cancerous diseases [12]. These findings had led to the question, what factors do affect the performance of class prediction models on datasets from non-cancerous diseases. As such, a literature review study to quantify the association between study factors and the performance of classification methods outside the field of cancer was initiated [13]. The study, however, was limited to the characteristics of the microarray experiment, with-out investigating the effect of gene expression data charac-teristics such as the correlation between genes.
In this study, we outline potential study and data specific factors and assess their contribution to the accuracy of clas-sification functions using real life gene expression data. The factors were chosen from both the experimental settings of the studies (i.e., disease, medical questions, tissue/cell types and sample size) and the characteristics of the gene expres-sion data (i.e., the number of differentially expressed genes, the fold changes and the within-class correlations).
Results
On average, most classification methods performed better on hereditary disease. Meanwhile, the highest
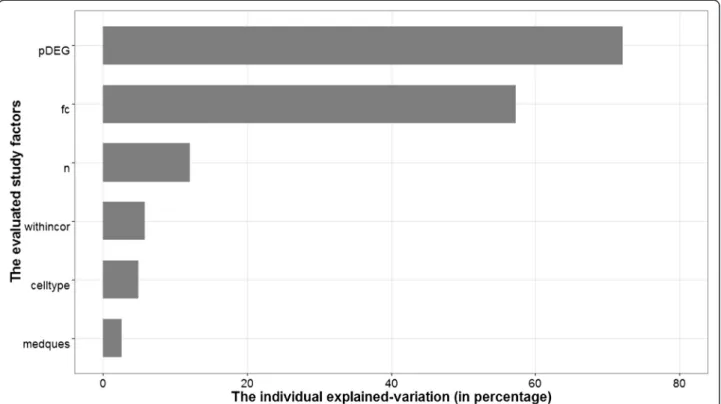
variability of the classification performance was ob-served on infectious disease (Additional file 4: Figure S1). Of the 25 experiments selected, 19 experiments addressed a diagnostic study. Diagnostic studies tend to be easily classified and hence yield higher accuracies than other (prognostic or response to a treatment) studies, as experienced by [14]. Despite this, the factor medical question is not significantly associated to ac-curacy (Additional file 5: Figure S2). A similar insignifi-cant effect is also shown by cell type used in the experiment (Additional file 6: Figure S3). A more for-mal individual evaluation of the effect of each study factor to the predictive ability of a classification method was assessed by a random effects regression model as described in the Method section. The results of the individual evaluations are summarized in Table 1 and the individual explained-variation is depicted on Fig. 1.
The fc and pDEG study factor were positively associ-ated to accuracy in their respective univariate random effects models. This intuitive finding confirms that a classification model could possibly achieve a good per-formance as the genes’fold change or the number of dif-ferentially expressed genes increases (Additional file 7: Figure S4 and Additional file 8: S5). We transformed the
pDEG to the log2-scale to deal with the high variability of the number of differentially expressed genes among studies, which ranged from 0 to 14,488.
Further,pDEGand fchad a relatively high individually explained-variation, i.e., 72% and 57%, respectively. Given its highest individual effect on the performance of classification model, we then usedpDEGas the first fac-tor entering the multiple regression model that was con-structed by the forward selection approach. We stopped the modeling process when there was no additional study factor that improved the multiple regression model, conditional on the previously selected study fac-tors in the model. The forward selection procedure yieldedpDEG,fcand the within class average correlation (withincor) as the factors that simultaneously associated to the classification models accuracy. We referred this
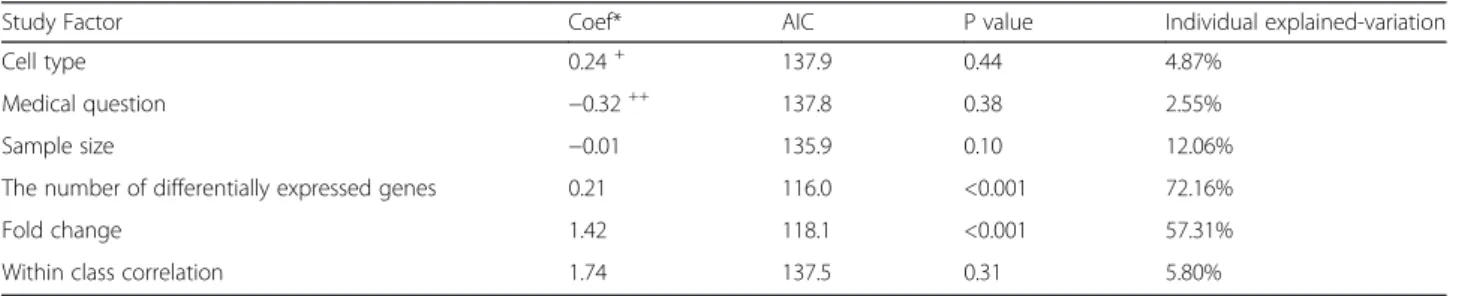
Table 1Individual random effect meta-regression
Study Factor Coef* AIC P value Individual explained-variation
Cell type 0.24+ 137.9 0.44 4.87%
Medical question −0.32++ 137.8 0.38 2.55%
Sample size −0.01 135.9 0.10 12.06%
The number of differentially expressed genes 0.21 116.0 <0.001 72.16%
Fold change 1.42 118.1 <0.001 57.31%
Within class correlation 1.74 137.5 0.31 5.80%
* Coefficient of the corresponding study factor in the random effects logistic regression
+
Coefficient for thenon-bloodcategory in the Cell Type study factor
++
model as the final model of the multiple random effects logistic regression. The three study factors in the final model explained 91.5% of the random between study variation relative to the null model. As in the univariable case,pDEG andfc have positive effects on the accuracy of classification methods. Interestingly,withincor turned out to be one of the study factors that significantly im-proved the multiple regression model, although it was not significant univariately.
Despite a relatively small number of studies, the ran-dom effects logistic regression model was stable, as shown by the high agreement of the random effects lo-gistic regression models in the Jackknife resampling ana-lyses. The Jackknife analysis was done by leaving out one study at a time and rebuilding the random effects regres-sion model in the remaining studies. In the univariable evaluation of Jacknife resampling, thefcandpDEGstudy factors were always found to be significant in the ran-dom effects models. The sample size, however, came as one of significant study factors five times, i.e., whenuc4,
uc5,hiv3, kd andhfstudies were left out from the ran-dom effect models (Additional file 2: Table S1). In the multivariable evaluation, the significant study factors in the final model were selected 19 times out of 25 Jackknife samples yielding a robustness of 76%. The
pDEG, withincor,and fcwere in the model for 25 times (100 %), 24 times (96 %) and 19 times (76 %), respect-ively (Additional file 3: Table S2).
Discussion
We enumerated possible characteristics of gene expres-sion data and investigated their impact on the predictive accuracy of nine chosen classification methods using twenty-five downloaded gene expression datasets. While a substantial amount of information is known about the characteristics of classification methods, little has been done to determine which characteristics of gene expression data affect the performance of a classifier. Classification methods have been shown to have varying performances in gene expression datasets. The classification methods, on average, performed differently across the different disease types (Additional file 4: Figure S1), but the random effects logistic regression model failed to show a significant rela-tionship between disease type and the accuracy of classifi-cation models. This might be as a result of the limited number of samples available to evaluate such a factor with five categories.
In general, we might have an issue of statistical power and model over-fitting when considering this variable. A solution could be to increase the number of studies by adding cancer studies to increase the statistical power and possibly lead to a comparison in different behavior of the study factors between cancerous and non-cancer-ous diseases. However, supervised learning on gene ex-pression studies in the field of cancer have been studied extensively by [9, 10, 15]. As such, we chose to focus on microarray gene expression experiments outside the field Fig. 1The individual explained-variation of study factors. Abbreviations: the number of differentially expressed genes on the log scale (pDEG), the fold change (fc), the sample size (n), the average within-class correlation coefficient (withincor), the cell type (celltype), and the medical question (medques)
of cancer. We assessed the stability of the results from both univariable and multivariable random effects logis-tic regression via Jackknife resampling. We excluded one dataset for each sampling and repeated the random ef-fects modeling process. We then recorded P values of each study factor in univariable models and the study factors that were included in the model in multivariable evaluation. Large number of datasets needs to be in-cluded in order to yield more generalizable results and also to avoid underpowered findings, particularly in an evaluation or comparison study [16]. Nevertheless, the evaluation of our results by Jackknife resampling shows high stability of our results and high agreement as com-pared to the findings by using full datasets
A similar study that was based on a quantitative re-view was conducted to evaluate study factors that were associated with the performance of classification models in the non-cancer field [13]. That study had found that the cross-validation technique considerably affected the predictive ability of classification models, in line with the finding of MAQC II consortium study [9]. In the current study, we then controlled for the effect of cross-valid-ation technique to observe the effect of other study fac-tors that could not be observed earlier in [13]. The same predictive modeling technique, including cross-valid-ation, feature selection and classification functions, was applied to the preprocessed gene expression datasets. The performance of the optimum classification models were measured by calculating the proportion of correctly classified samples and total sample size. Random effects logistic regression models showed that gene expression data characteristics such as fold changes, the number of differentially expressed genes and the correlation be-tween genes, contribute to the performance of classifica-tion models.
We used classification accuracy as the outcome of ana-lysis. Although it is well-known to be a rough measure for the performance of a classification model, accuracy is widely used in practice due to its straightforward interpretation. In highly imbalanced datasets, accuracy may yield overopti-mistic results, because a classification model might easily send all samples to the majority class. The class imbalance should therefore be taken into account when interpreting prediction accuracy [15]. A meaningful classification model necessarily should have higher accuracy than the proportion of the majority class. To deal with the problem of class imbalance when using accuracy, we corrected our random effects models for the class imbalance level.
We showed that the number of the differentially expressed genes, genes’ fold changes and the average within-class pairwise correlations significantly affected the accuracy of classification models. The positive coeffi-cient of the number of differentially expressed genes (pDEG) both in the simple and multiple random effects
models shows that the classification models performed better if the number of differentially expressed genes present in a dataset is increased. Similarly, fold change (fc) was significant in both univariable and multivariable evaluations with positive effects. These intuitive findings were mentioned earlier by the MAQC II consortium study [9], where the number of informative genes had relatively high degree of explained variability of the clas-sification model performance in cancer studies.
The within-class correlation (withincor) has a positive effect on the accuracy of classification models together with pDEG and fc in the final random effect model. The positive effect of thewithincor study factor to the classification model performance, is in contrast to knowledge from linear models that correlated variables bring no additional information to the model and therefore tend to reduce the predictive ability of the model. Our results show that the relationship between
withincor and model accuracy is confounded by the
pDEGandfc.To explain this finding, let’s first consider
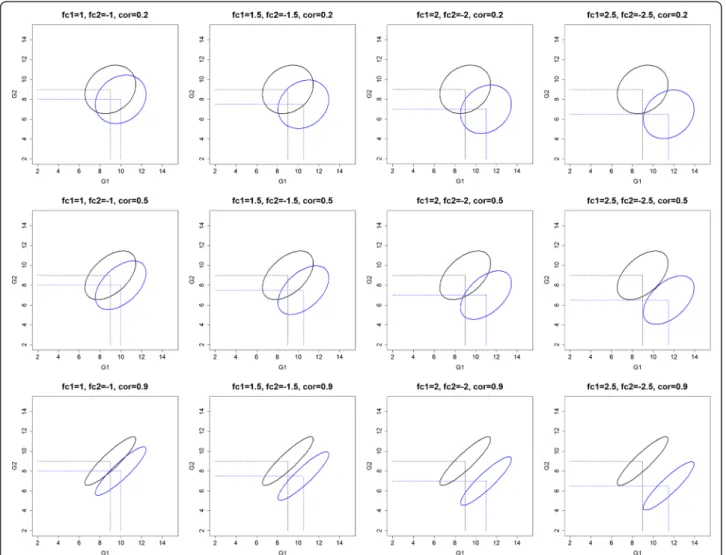
the within class correlation between two genes, both with a certain fold change. The two classes are more separable when the pairwise within class correlation be-tween two genes becomes stronger (Fig. 2: one gene up- and the other down regulated and positive within class correlation and S7: both genes up regulated and negative within class correlation). Meanwhile, we hardly observe an effect of the within class correlation in the other possible scenarios (Additional file 9: Figure S8: one gene up- and the other down regulated and nega-tive within class correlation and S9: both genes up reg-ulated and positive within class correlation). Thus, there are two possible effects of the within class correl-ation to the classificcorrel-ation model‘s performance, i.e., ei-ther positive or no effect, which might be the reason for an overall significant positive coefficient of the with-incorstudy factor.
The theoretical examples given above concern probe-sets with relatively high fold changes, reflecting the probesets that were involved in the classification models. In our classification approach, we ranked pro-besets based on the limma feature selection methods and used top-K probesets to feed the classifiers, as commonly done in practice, e.g., by [2, 3, 17–20] in non-cancer and [14] in the cancerous diseases. By using this approach, we ensured that the probesets involved in the classification models had considerable fold changes. Thus, it supports the confounding effect of thefcstudy factor to thewithincor in the multivariable random effect regression model.
The correlation structure in gene expression data had been proven to have a negative impact on the per-formance of probabilistic classifiers [11]. This could possibly be due to the measure of evaluation and/or
the fact that all genes were used and not a top number from a ranked list. In the non-probabilistic classifier, its ef-fect has not been studied yet. The result of this study could be a preliminary proof of the effect of correlation between genes (or probesets) to the performance of gen-eral classification models (for both probabilistic and non-probabilistic classifiers). Given our results, a similar simu-lation study as [11] by considering broad range of combin-ation values of fold changes, the number of informative genes and correlation structure of a gene expression data-set, is worth initiating by applying both probabilistic and non-probabilistic functions.
Conclusions
We evaluated factors that possibly had an impact on the performance of classification models in gene expression ex-periments outside the field of cancer. The factors were cate-gorized into two main groups: the study- and the
data-related factors. Our study showed that the data-data-related fac-tors‘number of differentially expressed genes’,‘fold change’, and ‘within-class correlation’significantly affect the accur-acy of classification functions.
Methods
Data extraction
We downloaded microarray gene expression datasets from the ArrayExpress data repository. The criteria for selecting the datasets were that the experiments 1) had been con-ducted in humans; 2) outside the field of cancer; 3) had samples with class labels in at least two classes; 4) were published after 2005; and 5) provided raw cell files. To reduce the source of variability of classification model per-formances because of the array used in the experiments, we retained studies conducted with the only Affymetrix array. This additional exclusion criterion was also motivated by the widely used of Affymetrix array by studies that were Fig. 2Visualization of the generated gene expression datasets with the scenario of fc1 = +,fc2 =−,cc1 = cc2 = +. Abbreviations: fc1(2): fold change of gene 1 (2); cc1(2): correlation coefficient of gene 1 (2)
recorded in the ArrayExpress repository. Out of 54169 re-corded studies in the ArrayExpress, 21284 (39.2%), 4436 (8.2%) and 3896 (7.2 %) studies used Affymetrix, Illumina and Agilent array, respectively (last checked in November 18, 2014). We took only two disease classes or dichoto-mized the outcomes if there were more than two classes in a study. In total, we downloaded twenty five gene expres-sion datasets [2, 17, 21–34] briefly described in the Sup-plementary Material (Additional file 1) and summarized in Table 2. In addition to the extracted datasets, the fol-lowing study characteristics were recorded: medical ques-tion addressed, disease type, tissue/cell type, microarray platform, paper availability, year of publication and sample size. The twenty five gene expression datasets came from microarray studies that were conducted in thirteen differ-ent diseases. We grouped the diseases based on etiology resulting in five major types namely; inflammatory (10), infectious (4), immune (4), degenerative (4), and heredi-tary (3) diseases. The disease grouping was aimed to evaluate the potential effect of the disease complexity to the performance of the classification methods.
Preprocessing
The raw datasets were normalized using quantile normalization, background correction performed ac-cording to manufacturer’s platform recommended cor-rection and log base two transformed [28]. Median polish was used as a summarization method to quan-tify expression values because of its ability to deal with outlying probes [29]. For each dataset, we filtered out non-informative probesets using two filtering criteria. First, we retained probesets that had expression values greater than five in at least ten percent (10%) of the total samples. Secondly, we filtered the retained pro-besets whose standard deviations were greater than 0.5 (sd > 0.5). We refer to the retained list as the actual expression data.
Classifier building
We built and evaluated in each dataset class predic-tion models with the set of nine classifiers described in the classification functions subsection. Since we are only equipped with a finite sample and the underlying distribution is unknown, the empirical counterpart to the generalization accuracy of a classification function
fis estimated as Remp½ ¼f 1 n Xn i¼1 L yð i;f xð Þi Þ; ð1Þ
wherenis the number of available samples andL(.,.) is a loss function withL(u,v) = 1 ifu=v, L(u,v) = 0 otherwise [35].
Though this empirical counterpart to the generalization accuracy can be used to evaluate classifiers, it usually overfits the sample S. A general practice is to split the samples into a learning set ℒ and a testing set T . Pre-dicted value from a classification function f̂ð Þ: is con-structed from a learning setℒonly and evaluated using a testing set T [35]. In case sample sizes are very small, a good practice is to generate several learning and testing sets from the available sample, construct a classifier with each learning set and using the corresponding testing set, estimate the empirical generalization accuracy. The final empirical generalization accuracy is the average across the testing sets. Suppose B learning sets ℒb (b= 1,…B) are generated from sample S and the corresponding testing sets T ¼ Sjℒbwith f̂bð Þ: obtained from ℒb (b= 1,…B) then an estimate of the accuracy is calculated by
acc¼ 1 B XB b¼1 1 Tb j j X iTb L yifb̂ ð Þxi ; ð2Þ
where |⋅| is the cardinality of the considered set [35]. As such, each dataset was split into two-thirds for the learning set and one-third for the testing set taking into account the number of samples per class (i.e., stratified sampling), using Monte Carlo cross-validation (MCCV) [35] and the probesets were ranked using the moderated t-statistic [36] on the learning set. The learning set was further split into an learning set and an inner-testing set using leave one out cross-validation (LOOCV). The parameter(s) of the classification func-tions (if any) were tuned by ranking the probesets on the moderated t-statistic and building the classifier with different values of the parameter(s) using the learning set and evaluated with the out of bag inner-testing set as proposed by [37]. The number of top pro-besets to be included in the classification function was also determined amongp= 5, 10, 15, 20, 25, 50, 55 for non-discriminant andp= 2, 3, 4, 5 (except for the GAU dataset, p= 2, 3) for linear discriminant analysis (LDA) and diagonal linear discriminant analysis (DLDA) using the corresponding inner-learning and inner-testing sets. The restriction of the top probesets for the discriminant functions is due to the inability of these functions to ac-commodate a number of probesets greater than the number of samples. With the optimal probeset(s) and number of top probesets (p) for each classification func-tion, the class prediction model was built for each classi-fication function using the learning set and then evaluated within the testing set. The process was re-peated B= 100 times. The numbers of correctly-classified and miscorrectly-classified samples in both learning and testing sets were then recorded.
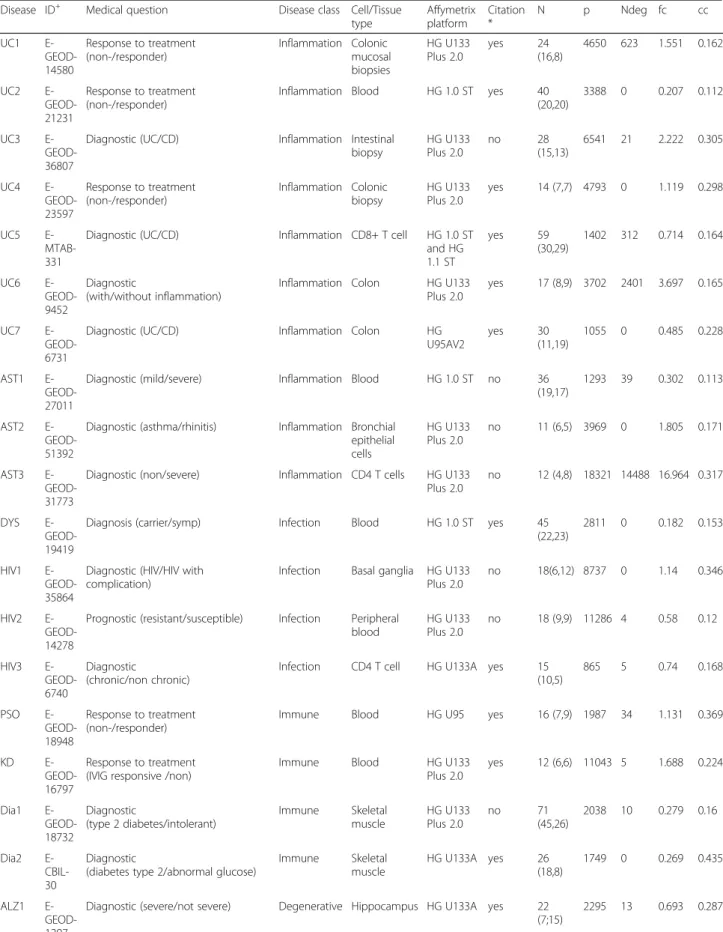
Table 2Characteristic of the gene expression experiments
Disease ID+ Medical question Disease class Cell/Tissue type Affymetrix platform Citation * N p Ndeg fc cc UC1 E- GEOD-14580 Response to treatment (non-/responder) Inflammation Colonic mucosal biopsies HG U133 Plus 2.0 yes 24 (16,8) 4650 623 1.551 0.162 UC2 E- GEOD-21231 Response to treatment (non-/responder)
Inflammation Blood HG 1.0 ST yes 40 (20,20)
3388 0 0.207 0.112
UC3 E- GEOD-36807
Diagnostic (UC/CD) Inflammation Intestinal biopsy HG U133 Plus 2.0 no 28 (15,13) 6541 21 2.222 0.305 UC4 E- GEOD-23597 Response to treatment (non-/responder) Inflammation Colonic biopsy HG U133 Plus 2.0 yes 14 (7,7) 4793 0 1.119 0.298 UC5 E- MTAB-331
Diagnostic (UC/CD) Inflammation CD8+ T cell HG 1.0 ST and HG 1.1 ST yes 59 (30,29) 1402 312 0.714 0.164 UC6 E- GEOD-9452 Diagnostic (with/without inflammation)
Inflammation Colon HG U133 Plus 2.0
yes 17 (8,9) 3702 2401 3.697 0.165
UC7 E- GEOD-6731
Diagnostic (UC/CD) Inflammation Colon HG U95AV2 yes 30 (11,19) 1055 0 0.485 0.228 AST1 E- GEOD-27011
Diagnostic (mild/severe) Inflammation Blood HG 1.0 ST no 36 (19,17)
1293 39 0.302 0.113
AST2 E- GEOD-51392
Diagnostic (asthma/rhinitis) Inflammation Bronchial epithelial cells HG U133 Plus 2.0 no 11 (6,5) 3969 0 1.805 0.171 AST3 E- GEOD-31773
Diagnostic (non/severe) Inflammation CD4 T cells HG U133 Plus 2.0
no 12 (4,8) 18321 14488 16.964 0.317
DYS E- GEOD-19419
Diagnosis (carrier/symp) Infection Blood HG 1.0 ST yes 45 (22,23)
2811 0 0.182 0.153
HIV1 E- GEOD-35864
Diagnostic (HIV/HIV with complication)
Infection Basal ganglia HG U133 Plus 2.0
no 18(6,12) 8737 0 1.14 0.346
HIV2 E- GEOD-14278
Prognostic (resistant/susceptible) Infection Peripheral blood HG U133 Plus 2.0 no 18 (9,9) 11286 4 0.58 0.12 HIV3 E- GEOD-6740 Diagnostic (chronic/non chronic)
Infection CD4 T cell HG U133A yes 15 (10,5) 865 5 0.74 0.168 PSO E- GEOD-18948 Response to treatment (non-/responder)
Immune Blood HG U95 yes 16 (7,9) 1987 34 1.131 0.369
KD E- GEOD-16797
Response to treatment (IVIG responsive /non)
Immune Blood HG U133 Plus 2.0 yes 12 (6,6) 11043 5 1.688 0.224 Dia1 E- GEOD-18732 Diagnostic (type 2 diabetes/intolerant) Immune Skeletal muscle HG U133 Plus 2.0 no 71 (45,26) 2038 10 0.279 0.16 Dia2 E- CBIL-30 Diagnostic
(diabetes type 2/abnormal glucose)
Immune Skeletal muscle HG U133A yes 26 (18,8) 1749 0 0.269 0.435 ALZ1 E- GEOD-1297
Diagnostic (severe/not severe) Degenerative Hippocampus HG U133A yes 22 (7;15)
Classification functions
The nine classification functions were chosen to represent the broad list in the literature that falls within the categories: discriminant analyses or Bayesian (linear discriminant ana-lysis (LDA), diagonal linear discriminant anaana-lysis (DLDA), and shrunken centroid discriminant analysis (SCDA)), tree base (random forest (RF) and tree-based boosting (TBB)), regularization and shrinkage (RIDGE, LASSO and support vector machines (SVM)), and k-nearest neighbors (kNN) methodsK-nearest neighbour (KNN).
Linear discriminant analysis (LDA)
Discriminant analyses are Bayes optimal classifiers, which assume that the conditional distributions of pre-dictors given the classes are multivariate normally dis-tributed and the within-class covariance matrices are equal for all classes [35]. In order to get an optimum LDA classifier, we optimized the number of probesets to be included in the model.
Diagonal linear discriminant analysis (DLDA)
As LDA, DLDA also works under the assumption of multivariate normality of class densities and a diagonal within-class covariance matrix for each class [35]. The optimum number of probesets was tuned by cross-validation.
Shrunken centroid discriminant analysis (SCDA)
It is also well-known as the prediction analysis of micro-array (PAM) and it is specially developed to handle the high-dimensionality of gene expression microarray data.
The method works by shrinking the class centroids to the overall centroid. For binary classification, the mean for each probesestj in each classk is calculated, and is called the class centroid. The class centroids are first normalized by overall mean, pooled standard deviation and sample sizeThis normalized class centroid is de-noted bydjk. The goal of this method is to shrinkdjk to-wards zero by reducingdjkby an amount ofΛ. A largeΛ value implicitly means excluding more probesets, which lead to a reduction in the model complexity. On the other hand, less number of probesets in a model would increase the risk of excluding informative probesets [38]. To balance this trade-off, parameter Λ was optimized amongst the following values: 0.1, 0.25, 0.5, 1, 2, and 5. SCDA is categorized as an embedded filtering method because of its ability to do filtering and model building simultaneously [39].
Random forest (RF)
Random forest is a classification method designed for decision tree classifiers. It combines the predictions made by multiple decision trees to yield the final predic-tion of a test sample. Supposed the sample size of the training set isN, each tree is constructed by: (i) sampling with replacement a random sample of cases of size 2
3N
and (ii) at each node, a random sample of predictor vari-ables m sampled from all predictor variables is selected and the predictor variable with the best split based on a given objective function is used. Step (ii) above is re-peated until the tree is grown to terminal nodes with minimum size k. The out-of-bag (oob) samples are used
Table 2Characteristic of the gene expression experiments(Continued)
ALZ2 E- MEXP-2280
Diagnostic (Alz/Pick's disease) Degenerative Medial temporal lobe HG U133 Plus 2.0 yes 19 (7,12) 6899 1592 1.086 0.231 PARKI E- GEOD-6613 Diagnostic (Parkinson/non-Parkinson)
Degenerative Blood HG U133A yes 83 (50,33)
638 0 0.192 0.361
HF E- GEOD-26887
Diagnostic (with/-out Diabetes) Degenerative Left ventricle cardiac biopsies HG 1.0 ST yes 19 (7,12) 2068 0 0.374 0.131 GAU E- GEOD-21899
Diagnostic (type 1/ 3) Hereditary Skin HG U133A 2.0
no 10 (5,5) 2017 4 1.807 0.143
CS E- MEXP-2236
Diagnostic (Apert/Muenke) Hereditary Skin HG U133 Plus 2.0 yes 20 (10;10) 5422 21 0.59 0.255 CF E- GEOD-10406 Diagnostic
(Chronic rhinosinusitis/+Cystic fibrosis)
Hereditary Sinus mucosa HG U133 Plus 2.0
no 15 (9,6) 7604 0 0.786 0.206
+ : The ArrayExpress accessing ID * : Paper availability
Ndeg : The number of differentially expressed probesets fc : The average fold change from all probesets
to evaluate the constructed tree. Randomization helps to reduce the correlations among decision trees so that the generalization accuracy of the classifier can be improved. A higher value for the minimum terminal node size k
would possibly lead to smaller grown trees. Once mul-tiple trees have been built, they are then combined by voting; that is each tree cast a vote at its terminal nodes [40]. The parametersmand kare often optimized using cross-validation. In this study, we fixed the number of trees in a forest at 500 and the number of random probesets at each splitmand the minimum terminal nodes sizekwere tuned within the valuesð0:1; 0:25; 0:5; 1; 2Þ pffiffiffipand (1, 2, 3), respectively. Where p is the total number of probesets.
Tree-based boosting (TBB)
Boosting is a classification method that combines the out-put of several “weak” classifiers to produce a powerful “committee”[41]. It is an iterative procedure used to adap-tively change the distribution of the training samples so that the base classifiers focus on samples that are hard to classify. Boosting assigns a weight to each learning sample and may adaptively change the weight at the end of each boosting round. These weights are then used either as a sampling distribution or can be used by the base classifier to learn a model that is biased toward higher-weight sam-ples. The idea is to give all observations the same weights at the start, draw a bootstrap sample and build a classifier, which in this case is a classification tree (hence tree-based boosting) then test the classifier with all the subjects. The weights of misclassified subjects are increased in the next bootstrap sample thereby given them higher chances to be sampled. We optimized the number of trees (bootstrap samples) that falls within these following values: 50, 100, 200, 500 and 1000.
Ridge regression (RIDGE)
The L2-penalization is used in logistic regression to shrink the less significant coefficients toward zero. The amount of shrinkage is controlled by a parameter λ, where larger λimplies a larger degree of shrinkage [41]. The parameter λ of the penalization is a tuning param-eter obtained by cross-validation (λ= 0.0625, 0.125, 0.25, 0.5, 1, 2, 4, 8, and 16).
LASSO
As in ridge regression, LASSO uses a penalization par-ameter (λ) to estimate the coefficients of logistic regres-sion, this time using L1-penalization.λ is interpreted as truncating the less significant coefficients, so that LASSO also works as a method for variable selection. We selected the optimumλ parameter within the range 0.1:0.9 by 0.1 using cross-validation [41].
Support vector machines (SVM)
SVM classification is a binary classification method that fits an optimal hyperplane between two classes by maxi-mizing the margin between the classes' closest points. The points lying on the boundaries are called support vectors, and the middle of the margin is the optimal sep-arating hyperplane. Data points on the “wrong” side of the discriminant margin are weighted down to reduce their influence and it is controlled by the cost parameter
C. For the nonlinear case, SVM uses a nonlinear map-ping (via kernels) to transform the original training data into a higher dimension. Within this new dimension, it searches for the linear optimal separating hyperplane that is, a “decision boundary” separating the tuples of one class from another. The SVM finds this hyperplane using the support vectors (“essential” training tuples) and margins are defined by the support vectors [42]. We used a linear kernel and the optimal cost parameter was obtained from 0.1, 1, 5, 10, 50, 100, 500 using cross-validation.
K-nearest neighbor (KNN)
For a sampleS, theKNN algorithm classifies this sample S based on a measure of distance between S and other learning samples. It finds the Ksamples in the learning set closest to S and then predicts the class of . by ma-jority votes. The valueKis usually specified by the user. It should be noted that if K is too small, then the nearest-neighbor classifier may be susceptible to over-fitting. On the other hand, if Kis too large, the nearest-neighbor classifier may misclassify the test instance, be-cause its list of nearest neighbors may include data that are located far away from its neighborhood [43]. The op-timal value of K is chosen by cross-validating amongst
K= 1 : 10 by 1.
Predictive factors
The study characteristics (referred to as “study factors”) were evaluated for their effect on the performance of the classification methods. The factors were chosen from both the experimental settings of the studies and the characteristics of the gene expression data. We selected study factors that have been proven in the literature or intuitively have association with the performance of clas-sification models. To represent the experimental setting, we chose study factors like medical question, sample size and cell/tissue type used in the experiment. The gene expression data were explored further to find the charac-teristics that might contribute to the performance of clas-sification methods, namely the number of differentially expressed genes, fold changes and within-class pairwise correlations. The study factors are described as follows:
Medical question
The medical questions were of different types: diagnos-tic, prognostic and response to treatment related studies. Diagnostic studies tend to have higher classification model performance than prognostic or response to a treatment studies, as experienced by e.g., [14]. This factor also came out as one of the factors that was as-sociated with classification model performance outside the field of cancer [13]. We classified the medical questions of the experiments as either diagnostic or non-diagnostic.
Sample size
Microarray datasets suffer from a severe curse of dimen-sionality. The impact of the number of samples used in the analysis was therefore investigated, particularly in the field of cancer by [10] . The class imbalance is an-other point of consideration when building a classifica-tion model. It may introduce bias towards the majority class in a prediction model and the classification per-formance will be overestimated, especially when the ac-curacy is used to evaluate the model [44]. The class imbalance factor is calculated as the number of samples in the majority class divided by the total sample size.
Cell type
The tissue or cell type used in the experiment is likely to be dissimilar between studies and may impact the resolution of information and also the performance of classifiers. In a specific cancer case, like in acute mye-loid leukemia (AML), the findings could be greatly af-fected by the cell type used in the experiment (e.g., in [E-GEOD-12662, E-GEOD-14924, E-GEOD-35010]). We therefore considered the cell type as one of the factors. We used a broad categorization of blood ver-sus non-blood cell types.
The number of differentially expressed genes (pDEG)
For each dataset, we performed a differential expression analysis by fitting a linear model for microarray data (well-known as limma) [45] and controlling the false dis-covery rate (FDR at 5%) defined as expected proportion of false rejection among the rejected hypotheses using the Benjamini and Hochberg (BH) procedure [46].
The within-class correlation level (withincor)
We constructed the within-class correlation matrices for each dataset. A shrinkage approach was applied to esti-mate the correlation matrix to deal with the high dimen-sionality and sparsity [47]. We took the average of absolute pairwise correlations within each class and av-eraged those values over the two classes to represent the level of the within-class correlation coefficient for a dataset.
The fold change (fc)
We calculated the fold change for each actual probeset as the absolute difference of the mean of log2 expres-sions between samples in two groups, divided by the pooled standard deviation. We summarized the fold changes in each dataset as the mean fold changes from all probesets.
Random effects logistic regression
The nine classification models were built in the twenty five gene expression microarray datasets. We considered these datasets as clustered data, where the selected stud-ies and the classification methods act as clusters. Fur-ther, in each study, we treated the accuracy as a grouped binomial variable, for which we had the number of sam-ples that were correctly and incorrectly classified. We therefore evaluated the six aforementioned predictive factors for classification accuracy by a logistic random intercept regression model [48]. The logistic random ef-fects model is the generalization of the linear mixed model to binomial outcomes. In this case, the sigmoid logistic link function is applied to the common linear mixed model and the error distribution is binomial in-stead of normal.
As the accuracy is well known to be biased towards the majority class, the random intercept logistic model was corrected by the class imbalance level, which was al-ways included in the regression model. For thelth study factor, the random effects model is written as
log πðxiSMÞ 1−πðxiSMÞ ¼ β0þϑ0sþϑ0M þβ1classimbalanceS þβ2predictivefactorlS;
where π(xisM) is the probability of a samplei in study
S to be correctly classified with the classification model
M; ϑ0S and ϑ0M are the random intercepts with respect to study S(ϑ0S~N(0,σ02S)); and classification methodM (ϑ0M~N(0,σ02M)). All the aforementioned study factors were evaluated by simple and multiple logistic random intercept regression models. Multiple regression evalu-ation was done by a forward selection approach. In each step, two nested models, with and without a particular study factor, were compared by Akaike’s information cri-terion (AIC). Each factor l was also evaluated by its explained-variation of the random intercept variance term, varl¼σ 2 null−σ2l σ2 null ; ð3Þ
where σnull2 is the random intercept variance from a model with “class imbalance” only (referred to as null
model). Since the logistic models have two random ef-fects variables, σnull2 is the combined variance of the study (σ02S) and the classification method (σ02M) random effect from a null model. Meanwhile,σl2is the combined variance from a random effects model with thelthfactor. The explained variation of all significant factors in the model (we refer to as “final model”) was also evaluated. It was calculated by replacing the σl2 in Eq.3 with the combined variance in the final model.
We evaluated the stability of the simple and multiple random effect logistic regression models by performing Jackknife resampling analysis. In each iteration, one study was left out and the model building process was repeated using the retained studies.
Software
All statistical analyses were performed in R software by using these following packages: affy for preprocessing procedures [49], CMA for predictive modeling [35],
limmafor fitting a linear model for microarray data [45],
lme4 for random effects linear model [50] and ggplot2
for data visualization [51]. The R scripts are available in the Supplementary Material (Additional File 10).
Additional file
Additional file 1:A brief description of the selected microarray gene expression experiments.
Additional file 2:Table S1.Stability analysis of univariable random effects logistic regression models via Jackknife resampling. Additional file 3:Table S2.Study factors that were included in the multivariable random effect logistic regression models via Jackknife resampling.
Additional file 4:Figure S1.Boxplot of Disease type against the classification model accuracy.
Additional file 5:Figure S2.Boxplot of Medical question against the classification model accuracy.
Additional file 6:Figure S3.Boxplot of Cell Type against the classification model accuracy.
Additional file 7:Figure S4.Plot of the Fold Change against the classification model accuracy.
Additional file 8:Figure S5.Plot of the Number of Differentially Expressed Genes (in the log scale) against the classification model accuracy.
Additional file 9:Figure S6.The visualization of the generated gene expression datasets with the scenario of fc1 = +,fc2 = +,cc1 = cc2 =−. Abbreviations: fc1(2): fold change of gene 1 (2); cc1(2): correlation coefficient of gene 1 (2).
Additional file 10:R script.
Competing interests
The authors declare that they have no competing interests. Authors' contributions
PWN designed the study, did systematic search, performed statistical analyses, drafted and wrote the article. VLJ wrote R scripts for preprocessing raw gene expression data and part of classification model building, as well as wrote the article. KCBR critically reviewed the article. MJCE designed the study, performed statistical analysis, drafted and reviewed the article.
Acknowledgements
This study was financially supported by the VIRGO consortium, which is funded by the Netherlands Genomics Initiative and by the Dutch Government (FES0908). The funding agencies in no way influenced the outcome or conclusions of the study.
The authors would like to thank T Debray (Epidemiology, Julius Center for Health Sciences and Primary Care, UMC Utrecht) and M Marinus (HPC-team, UMC Utrecht) who assisted the Authors in running the statistical analysis on the high performance computing cluster owned by the UMC Utrecht, the Netherlands. The Authors would also like to thank the anonymous Reviewers for their critical comments and constructive suggestions to the article. Author details
1
Biostatistics & Research Support, Julius Center for Health Sciences and Primary Care, University Medical Center Utrecht, 3508GA, Utrecht, The Netherlands.2Viroscience Lab, Erasmus Medical Center Rotterdam, 3015CE, Rotterdam, The Netherlands.
Received: 8 January 2015 Accepted: 30 April 2015
References
1. Bansard C, Lequerre T, Derambure C, Vittecoq O, Hiron M, Daragon A, Pouplin S, Daveau M, Boyer O, Tron Fet al.: Gene profiling predicts rheumatoid arthritis responsiveness to IL-1Ra (anakinra).Rheumatology (Oxford)2011, 50(2):283–292.
2. Kabakchiev B, Turner D, Hyams J, Mack D, Leleiko N, Crandall W, Markowitz J, Otley AR, Xu W, Hu Pet al.: Gene expression changes associated with resistance to intravenous corticosteroid therapy in children with severe ulcerative colitis.PLoSOne2010, 5(9).
3. Scian MJ, Maluf DG, Archer KJ, Suh JL, Massey D, Fassnacht RC, et al. Gene expression changes are associated with loss of kidney graft function and interstitial fibrosis and tubular atrophy: diagnosis versus prediction. Transplantation. 2011;91(6):657–65.
4. Dudoit S, Fridlyand J, Speed TP. Comparison of discrimination methods for the classification of tumors using gene expression data. Journal of the American Statistical Association. 2002;97(457):77–87.
5. Statnikov A, Aliferis CF, Tsamardinos I, Hardin D, Levy S. A comprehensive evaluation of multicategory classification methods for microarray gene expression cancer diagnosis. Bioinformatics. 2005;21(5):631–43. 6. Guyon I, Weston J, Barnhill S, Vapnik V. Gene selection for cancer
classification using support vector machines. Machine Learning. 2002;46(1–3):389–422.
7. Friedman J, Hastie T, Tibshirani R. Regularization paths for generalized linear models via coordinate descent. JStatSoftw. 2010;33(1):1–22.
8. Lee JW, Lee JB, Park M, Song SH. An extensive comparison of recent classification tools applied to microarray data. Computational Statistics & Data Analysis. 2005;48(4):869–85.
9. Shi L, Campbell G, Jones WD, Campagne F, Wen Z, Walker SJ, et al. The MicroArray quality control (MAQC)-II study of common practices for the development and validation of microarray-based predictive models. NatBiotechnol. 2010;28(8):827–38.
10. Ntzani EE, Ioannidis JP. Predictive ability of DNA microarrays for cancer outcomes and correlates: an empirical assessment. Lancet.
2003;362(9394):1439–44.
11. Kim KI, Simon R. Probabilistic classifiers with high-dimensional data. Biostatistics. 2011;12(3):399–412.
12. Jong VL, Novianti PW, Roes KC, Eijkemans MJ. Exploring homogeneity of correlation structures of gene expression datasets within and between etiological disease categories. Statistical applications in genetics and molecular biology. 2014;13(6):717–32.
13. Novianti PW, Roes KC, Eijkemans MJ. Evaluation of gene expression classification studies: factors associated with classification performance. PLoS One. 2014;9(4), e96063.
14. Willenbrock H, Juncker AS, Schmiegelow K, Knudsen S, Ryder LP. Prediction of immunophenotype, treatment response, and relapse in childhood acute lymphoblastic leukemia using DNA microarrays. Leukemia. 2004;18(7):1270–7. 15. Dupuy A, Simon RM. Critical review of published microarray studies for
cancer outcome and guidelines on statistical analysis and reporting. JNatlCancer Inst. 2007;99(2):147–57.
16. Boulesteix AL: On representative and illustrative comparisons with real data in bioinformatics: response to the letter to the editor by Smith et al. Bioinformatics (Oxford, England)2013, 29(20):2664–2666.
17. Arijs I, Li K, Toedter G, Quintens R, Van LL, Van SK, et al. Mucosal gene signatures to predict response to infliximab in patients with ulcerative colitis. Gut. 2009;58(12):1612–9.
18. Menke A, Arloth J, Putz B, Weber P, Klengel T, Mehta D, et al. Dexamethasone stimulated gene expression in peripheral blood is a sensitive marker for glucocorticoid receptor resistance in depressed patients.
Neuropsychopharmacology. 2012;37(6):1455–64.
19. Rasimas J, Katsounas A, Raza H, Murphy AA, Yang J, Lempicki RA, et al. Gene expression profiles predict emergence of psychiatric adverse events in HIV/HCV-coinfected patients on interferon-based HCV therapy. JAcquirImmuneDeficSyndr. 2012;60(3):273–81.
20. Lunnon K, Sattlecker M, Furney SJ, Coppola G, Simmons A, Proitsi P, et al. A blood gene expression marker of early Alzheimer's disease.
JAlzheimersDis. 2013;33(3):737–53.
21. Toedter G, Li K, Marano C, Ma K, Sague S, Huang CC, et al. Gene expression profiling and response signatures associated with differential responses to infliximab treatment in ulcerative colitis. AmJGastroenterol.
2011;106(7):1272–80.
22. Lee JC, Lyons PA, McKinney EF, Sowerby JM, Carr EJ, Bredin F, et al. Gene expression profiling of CD8+ T cells predicts prognosis in patients with Crohn disease and ulcerative colitis. JClinInvest. 2011;121(10):4170–9. 23. Olsen J, Gerds TA, Seidelin JB, Csillag C, Bjerrum JT, Troelsen JT, et al.
Diagnosis of ulcerative colitis before onset of inflammation by multivariate modeling of genome-wide gene expression data. InflammBowelDis. 2009;15(7):1032–8.
24. Wu F, Dassopoulos T, Cope L, Maitra A, Brant SR, Harris ML, et al. Genome-wide gene expression differences in Crohn's disease and ulcerative colitis from endoscopic pinch biopsies: insights into distinctive pathogenesis. InflammBowelDis. 2007;13(7):807–21.
25. Walter M, Bonin M, Pullman RS, Valente EM, Loi M, Gambarin M, et al. Expression profiling in peripheral blood reveals signature for penetrance in DYT1 dystonia. NeurobiolDis. 2010;38(2):192–200.
26. Hyrcza MD, Kovacs C, Loutfy M, Halpenny R, Heisler L, Yang S, et al. Distinct transcriptional profiles in ex vivo CD4+ and CD8+ T cells are established early in human immunodeficiency virus type 1 infection and are characterized by a chronic interferon response as well as extensive transcriptional changes in CD8+ T cells. JVirol. 2007;81(7):3477–86. 27. Suarez-Farinas M, Shah KR, Haider AS, Krueger JG, Lowes MA. Personalized
medicine in psoriasis: developing a genomic classifier to predict histological response to Alefacept. BMCDermatol. 2010;10:1.
28. Ogata S, Ogihara Y, Nomoto K, Akiyama K, Nakahata Y, Sato K, et al. Clinical score and transcript abundance patterns identify Kawasaki disease patients who may benefit from addition of methylprednisolone. PediatrRes. 2009;66(5):577–84.
29. Mootha VK, Lindgren CM, Eriksson KF, Subramanian A, Sihag S, Lehar J, et al. PGC-1alpha-responsive genes involved in oxidative phosphorylation are coordinately downregulated in human diabetes. NatGenet. 2003;34(3):267–73.
30. Blalock EM, Geddes JW, Chen KC, Porter NM, Markesbery WR, Landfield PW. Incipient Alzheimer's disease: microarray correlation analyses reveal major transcriptional and tumor suppressor responses. ProcNatlAcadSciUSA. 2004;101(7):2173–8.
31. Bronner IF, Bochdanovits Z, Rizzu P, Kamphorst W, Ravid R, van Swieten JC, et al. Comprehensive mRNA expression profiling distinguishes tauopathies and identifies shared molecular pathways. PLoS ONE. 2009;4(8), e6826. 32. Scherzer CR, Eklund AC, Morse LJ, Liao Z, Locascio JJ, Fefer D, et al. Molecular
markers of early Parkinson's disease based on gene expression in blood. Proceedings of the National Academy of Sciences of the United States of America. 2007;104(3):955–60.
33. Greco S, Fasanaro P, Castelvecchio S, D'Alessandra Y, Arcelli D, Di DM, et al. MicroRNA dysregulation in diabetic ischemic heart failure patients. Diabetes. 2012;61(6):1633–41.
34. Bochukova EG, Soneji S, Wall SA, Wilkie AO. Scalp fibroblasts have a shared expression profile in monogenic craniosynostosis. JMedGenet.
2010;47(12):803–8.
35. Slawski M, Daumer M, Boulesteix AL. CMA: a comprehensive Bioconductor package for supervised classification with high dimensional data. BMCBioinformatics. 2008;9:439.
36. Smyth GK: Linear models and empirical bayes methods for assessing differential expression in microarray experiments.StatApplGenetMolBiol2004, 3:Article3.
37. Wessels LF, Reinders MJ, Hart AA, Veenman CJ, Dai H, He YD, et al. A protocol for building and evaluating predictors of disease state based on microarray data. Bioinformatics. 2005;21(19):3755–62.
38. Tibshirani R, Hastie T, Narasimhan B, Chu G. Class prediction by nearest shrunken centroids, with applications to DNA microarrays. Statistical Science. 2003;18(1):104–17.
39. Saeys Y, Inza I, Larranaga P. A review of feature selection techniques in bioinformatics. Bioinformatics. 2007;23(19):2507–17.
40. Breiman L. Random forests. Machine Learning. 2001;45(1):5–32. 41. Hastie T, Tibshirani R, Friedman J. The elements of statistical learning: data
mining, inference, and prediction: springer. 2003.
42. Han J, Kamber M. Data Mining: Concepts and Techniques: Morgan Kaufmann. 2006.
43. Tan FK, Hildebrand BA, Lester MS, Stivers DN, Pounds S, Zhou X, et al. Classification analysis of the transcriptosome of nonlesional cultured dermal fibroblasts from systemic sclerosis patients with early disease. Arthritis Rheum. 2005;52(3):865–76. 44. Blagus R, Lusa L. Class prediction for high-dimensional class-imbalanced
data. BMCBioinformatics. 2010;11:523.
45. Smyth GK: limma: Linear Models for Microarray Data Bioinformatics and Computational Biology Solutions Using R and Bioconductor. In: Bioinformatics and Computational Biology Solutions Using R and
Bioconductor.Edited by Gentleman R, Carey V, Huber W, Irizarry R, Dudoit S: Springer New York; 2005: 397–420.
46. Benjamini Y, Hochberg Y. Controlling the false discovery rate: a practical and powerful approach to multiple testing. Journal of the Royal Statistical SocietySeries B (Methodological). 1995;57(1):289–300.
47. Schafer J, Strimmer K: A shrinkage approach to large-scale covariance matrix estimation and implications for functional genomics.StatApplGenetMolBiol 2005, 4:Article32.
48. Stijnen T, Hamza TH, Ozdemir P. Random effects meta-analysis of event outcome in the framework of the generalized linear mixed model with applications in sparse data. StatMed. 2010;29(29):3046–67.
49. Gautier L, Cope L, Bolstad BM, Irizarry RA. affy–analysis of Affymetrix GeneChip data at the probe level. Bioinformatics. 2004;20(3):307–15. 50. Bates D, Maechler M: lme4: Linear mixed-effects models using {S4} classes.{R}
package version 0.999375-32. In.; 2009.
51. Wickham H: ggplot2: Elegant Graphics for Data Analysis: Springer Publishing Company, Incorporated; 2009.
Submit your next manuscript to BioMed Central and take full advantage of:
• Convenient online submission • Thorough peer review
• No space constraints or color figure charges • Immediate publication on acceptance
• Inclusion in PubMed, CAS, Scopus and Google Scholar • Research which is freely available for redistribution
Submit your manuscript at www.biomedcentral.com/submit