Sma3s: A Three-Step Modular Annotator for Large Sequence Datasets
ANTONIOMun˜oz-Me´rida1, ENRIQUEViguera2, M. GONZALOClaros3, OSWALDOTrelles1,4, and ANTONIOJ. Pe´rez-Pulido5,*
Integrated Bioinformatics, National Institute for Bioinformatics, University of Ma´laga, Campus de Teatinos, Spain1; Cellular Biology, Genetics and Physiology Department, University of Ma´laga, Campus de Teatinos, Spain2; Molecular Biology and Biochemistry Department, University of Ma´laga, Campus de Teatinos, Spain3; Computer Architecture Department, University of Ma´laga, Campus de Teatinos, Spain4and Centro Andaluz de Biologı´a del Desarrollo (CABD, UPO-CSIC-JA), Facultad de Ciencias Experimentales (A´rea de Gene´tica), Universidad Pablo de Olavide, Sevilla 41013, Spain5
*To whom correspondence should be addressed. Tel.þ34 954-348-652. Fax.þ34 954-349-376. E-mail: [email protected]
Edited by Prof. Kenta Nakai
(Received 29 October 2013; accepted 6 January 2014)
Abstract
Automatic sequence annotation is an essential component of modern ‘omics’ studies, which aim to extract information from large collections of sequence data. Most existing tools use sequence homology to establish evolutionary relationships and assign putative functions to sequences. However, it can be difficult to define a similarity threshold that achieves sufficient coverage without sacrificing annotation quality. Defining the correct configuration is critical and can be challenging for non-specialist users. Thus, the development of robust automatic annotation techniques that generate high-quality annotations without needing expert knowledge would be very valuable for the research community. We present Sma3s, a tool for automatically annotating very large collections of biological sequences from any kind of gene library or genome. Sma3s is composed of three modules that progressively annotate query sequences using either: (i) very similar homologues, (ii) orthologous sequences or (iii) terms enriched in groups of homologous sequences. We trained the system using several random sets of known sequences, demonstrating average sensitivity and spe-cificity values of∼85%. In conclusion, Sma3s is a versatile tool for high-throughput annotation of a wide variety of sequence datasets that outperforms the accuracy of other well-established annotation algorithms, and it can enrich existing database annotations and uncover previously hidden features. Importantly, Sma3s has already been used in the functional annotation of two published transcriptomes.
Key words: functional annotation; genome annotation; transcriptome annotation; bioinformatic tool
1. Introduction
Sequence annotation is the process of associating bio-logical information to sequences of interest. Annotations can include the potential function, cellular localization, biological process or protein structure of a given se-quence.1Some sequences are annotated using direct ex-perimental evidence, but most annotations are inferred from sequence similarities or conserved patterns asso-ciated with known characteristics.2–5 Large publically accessible databases of annotated sequences make it possible to automatically annotate large collections of
unknown sequences. This is especially valuable for the interpretation of large sequence datasets generated by genome and expressed sequence tag (EST) sequencing projects as well as gene and protein expression experi-ments, such as DNA microarrays, and many other emer-ging research areas.6
Sequence annotation is also important in transcrip-tomic experiments that aim to identify gene clusters with similar expression patterns that are linked to a par-ticular biological process or experimental condition. Biological function can then be inferred from annota-tions shared within these clusters.7
#The Author 2014. Published by Oxford University Press on behalf of Kazusa DNA Research Institute.
This is an Open Access article distributed under the terms of the Creative Commons Attribution License (http://creativecommons.org/licenses/by-nc/
.0/), which permits non-commercial use, distribution, and reproduction in any medium, provided the original work is properly cited. For commercial re-use, please contact [email protected].
Advance Access publication on 5 February 2014
Several methods have been developed for the anno-tation of the large datasets generated by sequencing projects. These methods typically perform homology-based searches and infer annotations from sequences with high levels of homology to the query sequence. To detect sequence similarity, most methods use BLAST, a fast heuristic algorithm for identifying hom-ology between sequences based on local sequence alignments.8
Blast2GO is one of the most widely used tools for genomic annotation.9It performs three steps: a BLAST search, a step that maps similar sequences to existing annotation associations, and finally term annotation. As its name suggests, Blast2GO mainly uses terms from the Gene Ontology (GO) controlled vocabulary for annotation,10although it also includes other anno-tation classes. However, Blast2GO is most commonly run online, which can make it more difficult to analyse large collections of sequences. Other methods can be installed locally, and so avoid problems asso-ciated with remote execution, such as sequence number limitations or resource thresholds. Blast2GO is also available in an offline form, but installation requires knowledge of relational databases that make it less suitable for routine use and difficult for non-spe-cialist users. AutoFact11can perform several types of BLAST search using locally downloaded domain and motif databases. However, it uses databases with de-scriptive non-standard annotation entries rather than controlled vocabularies such as GO. The resulting lack of homogeneity in terms of vocabulary or syntax can make it much more difficult to automatically assign annotations or evaluate annotation quality.
The above methods can be applied to a wide range of different sequence types and organisms. Many other tools are specialized for specific applications. Some tools only deal with single annotation classes, as is the case for Gotcha, which only uses GO terms.12Others are specialized for the annotation of specific sequence types, such as the EST-specific ESTAnnotator13 and EST-PAC.14In addition, some tools are designed espe-cially for the annotation of specific organisms. For example, BLANNANOTATOR assigns non-standard annotations to bacterial sequences.15
Some platforms allow diverse data sources to be inte-grated for the purposes of sequence annotation and an-notation analysis. For example, the Babelomics suite,16 of which Blast2GO is part, contains tools for assigning interactions, pathways or even regulatory annotations to analysed sequences. Another widely used platform is DAVID,17 which extracts functional annotations from a variety of public genome resources, and allows subsequent analysis by biological enrichment. One of the richest annotation sources is BioMart,18 which retrieves sequence annotations from Ensembl and other databases.
All of these annotation methods use BLAST to detect and evaluate the similarity between a query sequence and putative homologues.8 For each query sequence, BLAST attempts to create alignments with database sequences and uses these alignments to judge se-quence similarity. Most annotation methods select the database sequence with the highest overall similar-ity score for each query sequence as the donor of anno-tation information. In addition, a minimum similarity threshold sets the limit below which sequences will be rejected even if they are the most similar sequence in the database. Defining the similarity threshold is not an easy task, as it must balance annotation quality and sequence coverage (SC). Moreover, it has been shown that the optimal similarity threshold can vary between different sequence types.19 Several other BLAST variables, such as how it scores alignment gaps, can also result in significantly different results. These factors can be difficult to configure, particularly for non-specialist users.
We have developed Sma3s, a fast, accurate and flex-ible annotation tool specifically designed for the anno-tation of large collections of sequences obtained from diverse gene libraries or coding sequence datasets. It is comprised of three modules that solve the annotation process with progressively less-stringent sequence simi-larity requirements, combined with methods to opti-mize specificity. Each module uses an initial exhaustive BLAST search as its starting point. The third Sma3s module enhances annotation quality using term enrichment to identify annotations shared by groups of similar sequences. We have defined optimal default Sma3s parameter values to minimize user inter-vention for most applications, thus aiding consistency and comparability. We show that Sma3s can rapidly produce high levels of prediction accuracy with minimal human supervision and modest computation-al resources.
2. Materials and methods
2.1. Implementation
Sma3s was written in Perl using modules of the BioPerl 1.6 project (http://www.bioperl.org) and is freely accessible from the Sma3s website (http://www. bioinfocabd.upo.es/sma3s/). Sma3s uses two pro-grammes from the Blast package: blastp for amino acid sequences and blastx for nucleotide sequences, using anE-value threshold of 1026, and blastclust for sequence clustering procedures. A Perl biological en-richment module, based on hypergeometric distribu-tion, was used to calculate probability values (http:// www.cse.huji.ac.il/course/2006/bioskill/Ex2/HyGe.pm). Sma3s uses the UniProt database in plain-text format files (file.dat), corresponding to the taxonomic division
of the organism under study, as its main data source. More details about programme requirements and op-eration are available on the website.
Running on a dual-processor Intel Pentium 4 CPU 3.00 GHz with 4 Gb of RAM, the programme takes an average of 0.7 s to annotate each sequence (mean length¼400 amino acids) against a division of the Swiss-Prot database (45 000 sequences), using the three modules. In fact, the most time-consuming process (90%) is the initial exhaustive BLAST (blastp or blastx), whose results are then reused in subsequent parameter tuning and annotation refinement steps.
2.2. Annotation types
UniProt20is arguably the most complete publically available protein database. Human-based curation ensures high-quality annotations, which is particularly evident in the Swiss-Prot section, compared with the automatically annotated TrEMBL section (also part of UniProt). Sma3s uses Swiss-Prot as its main source for extracting annotations. The UniProt fields used by Sma3s are:
Gene ontology GO10provides a controlled vocabu-lary to describe genes and gene product attributes. It is organized into three biological ontologies: molecular function, biological process and cellular component. Standardized GO term annotations are included in the cross-reference (DR) field of UniProt.
Interpro InterPro21is an integrated documentation resource of protein families, domains and sites. It com-bines complementary sequence pattern information from several databases. UniProt provides InterPro iden-tifiers also from the DR field.
Swiss-Prot keywords TheSwiss-Prot keywords consti-tute a well-defined and controlled vocabulary of terms used to annotate a UniProt protein entry. These keywords (the KW field in UniProt) describe functions, biological processes, structure, cellular localization and other protein characteristics.
Pathway annotation This annotation provides a de-scription of the metabolic pathway(s) in which a protein is involved. It is obtained from the comment (CC) field containing generic and specific metabolic pathway descriptors (e.g.: -!- PATHWAY: Nucleotide metabolism; purine metabolism). Sma3s gathers anno-tations of the most generic level (‘Nucleotide metabol-ism’ in the previous example). This type of annotation is particularly useful for identifying co-expressed genes that are active in the same metabolic pathway.
New annotation types can be incorporated into Sma3s with only minor changes to its algorithms.
2.3. Threshold calculation for the selection of multiple homologous sequences
Module 3 uses a modified version of Sander’s formula,22later updated by Rost23to select alignments based on both identity and alignment length. The ori-ginal formulas describe the relationship between se-quence identity and alignment length observed in sequences sharing structural similarities as a curve. In the Rost equation, the identity threshold ( p) for an alignment of lengthLis defined as:
plðnÞ ¼nþ480L0:32ð1þeL=100Þ; ð1Þ wherendescribes the distance in percentage from the original curve. This value allows curve adjustment to in-crease stringency and to ensure at least 40% identity (n¼20) at any alignment length in accordance with the 40% threshold for functional conservation described by Wilson et al.24 and will be the default value used for Module 3 annotation.
2.4. Statistical significance analysis of annotations Each term assigned by Sma3s’ prediction algorithm is assigned a P-value to indicate annotation quality. Annotations from Module 3 takeP-values from a biologic-al enrichment cbiologic-alculation, while those from Modules 1 and 2 are derived from the highest rated BLAST hit.
The biological enrichment algorithm (see below) is based on hypergeometric distribution as follows: from Msequences in the database,Kcontains annotationX; withmsequences in the annotated cluster, the prob-abilityP(x¼k) thatksequences will have annotation Xis: Pðx¼kÞ ¼ K k MK mk M m ð2Þ
Assuming thatlsequences were found with annotation X, the probabilityPthat lcan be adjusted to the null hypothesis is:
P¼ X
minfK;mg k¼1
Pðx¼kÞ; ð3Þ The cut-offP-value was determined experimentally to be0.1 (see the Results section).
2.5. Accuracy estimation
Sma3s assesses three different ratios to evaluate method accuracy taking into account test sets of previ-ously annotated sequences. These ratios are based on TP (true positives: predicted terms corresponding to the real annotation), FP (false positives: predicted
terms not corresponding to the real annotation) and FN (false negatives: non-predicted real terms).
It is worth pointing out that (TPþFN) corresponds to the number of real annotations and (TPþFP) repre-sents the number of predicted annotations. In this way, we can calculate both sensitivity and specificity indices. We can also calculate the Relative Error Quotient (REQ), which evaluates the overall prediction quality by considering both the sensitivity and specifi-city measurements as described in the GOtcha method.12REQ is calculated as:
REQ = FNW+ FP
TP ð1þWÞ; ð4Þ
whereWis a weighting factor that moderates the influ-ence of FN and FP. In this work,Whas been set to 1 to make results comparable with the literature. Low REQ values indicate a low annotation error rate, whereas a high REQ indicates a higher proportion of errors. This measure of accuracy has the advantage that it encom-passes TP, FP and FN, thus combining sensitivity and se-lectivity in a single value.
To evaluate prediction coverage percentages, two more values were calculated: the SC (the number of sequences with predicted annotations with respect to sequences with known annotations) and term coverage (TC, the number of predicted annotations with respect to known annotations).
2.6. Test datasets
2.6.1. Random sequence datasets All the databases used in this work belong to the UniProt Knowledgebase Release 2011_08, which were obtained from the EBI ftp-site: ftp://ftp.ebi.ac.uk/pub/databases/uniprot/current_ release/knowledgebase/taxonomic_divisions/.
We downloaded four taxonomic divisions (bacteria, plants, invertebrates and mammals) and built five inde-pendent random datasets of 1000 sequences (5000 in total) for each taxonomic division. These datasets were processed with Sma3s. Query sequences were removed from the database before each run to avoid self-annotation.
2.6.2. Sequence sets from DNA arrays We extracted two independent DNA arrays from the GEO database:25 Affymetrix Murine 11K SubB Array (AC:GPL76) and the Affymetrix Arabidopsis ATH1 Genome Array (AC:GPL198). The nucleotide sequences from these arrays were downloaded, and sequences shorter than 150 were removed (to ensure a minimum amino acid sequence length of 50). Reference annotations were taken from both Affymetrix-assigned GO terms and GO terms extracted from the Swiss-Prot entries referred to in the Affymetrix annotation.
2.7. Blast2GO and Top-BLAST tests
We opened Blast2GO as a Java application (http:// www.blast2go.com/b2ghome), selecting the 2Gb memory version, as would be typical for non-expert users performing a search with default parameters. The test did not include graphical data mining or en-richment analysis Blast2GO options. For Top-BLAST an-notation, the best hit from a default BLAST search was used to annotate every sequence in the dataset. Self-prediction in Blast2GO (annotation based on annota-tions from the query sequence) was unavoidable, since dataset sequences cannot be removed from the database.
3. Results
3.1. Sma3s algorithm overview
With Sma3s, we set out to develop a tool that can in-telligently assign annotations to query sequences in a way that maximizes accuracy without sacrificing cover-age, and works in a way that is robust enough to gener-ate high-quality results without having to adjust the parameters.
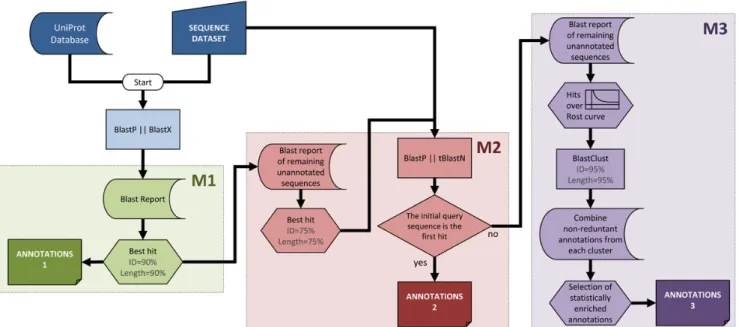
To achieve these aims, we designed Sma3s as a modular system that processes query sequences in a series of discrete steps. The method starts with a BLAST similarity search, followed by a three-step annotation process which sequentially tests different degrees of simi-larity between query and database sequences (Fig. 1). The first module annotates query sequences using database homologues with very high levels of similarity (Fig.1, M1). The second module performs a reciprocal BLAST on sequences unannotated in the first step to generate annotations from orthologous database sequences (Fig.1, M2). The third module uses a novel strategy (Fig. 1, M3) that looks for more distantly related sequences and analyses these data for statistic-ally significant sequence annotations.
Module 1: The first annotator uses a Top-BLAST strat-egy to check whether the query sequence (or one very similar to it) already exists in the UniProt database, and then directly assigns database annotations to the query sequence. We established a minimum sequence identity of 90% and a sequence overlap of at least 90% of the database sequence, although these parameters are customizable. In all cases, Sma3s uses annotations from Swiss-Prot in preference to TrEMBL when identical amino acid sequences are found in both databases (Table1, see the next section for details).
Module 2: This module annotates using information from putative orthologues with lower similarity. The second module of Sma3s is based on reciprocal BLAST searches. It detects lower similarity sequences with at least 75% of per-residue identity, covering at least 75% of database sequence length. The best hit is then
used as an input seed in a blastp or tblastn search against the initial set of query sequences. If this second BLAST identifies the starting query sequence as the best hit, then an orthology relationship is estab-lished, and consequently, the annotation recovered. As in the previous step, Sma3s uses Swiss-Prot annota-tions in preference to TrEMBL (Table 1, see the next section for details).
Module 3: Module 3 recovers annotation informa-tion from multiple homologous sequences using a novel multi-step approach. The first step is to determine which homologues have sufficient similarity to the query sequence. Work by Sander22and Rost23found that minimum alignment length was a better criterion than overall percentage sequence identity for estimat-ing sequence and structural homology, especially when comparing pairs of structurally matched proteins with lower levels of similarity. Intuitively, for short se-quence alignments, a high percentage identity is
needed to establish statistically significant relation-ships. Conversely, long pairwise alignments require lower identity to be qualified as significant. In the context of protein structure, a minimum threshold of 20% was found to be a good predictor of protein struc-ture, provided that the alignment had a length of at least 150 residues. Function is less well conserved than struc-ture, but further studies have reported that biological function is typically conserved when two sequences exhibit 40% sequence identity.24Thus, based on the hypothesis that function conservation is also related to sequence alignment length, we have used a modified form of Rost’s equation (see Materials and Methods for details) that only selects sequences whose alignments have at least 40% identity at any alignment length.
Although the sequences selected by this method can have significantly lower similarities to those identified by Modules 1 and 2, the combined analyses of multiple sequences can be used to increase annotation reliabil-ity. This is based on the hypothesis that annotations shared by several homologous sequences are more likely to reflect functions shared by the query sequence. Module 3 uses biological enrichment to only select those terms which appear more frequently in the iden-tified homologues than would be expected by chance in the source database (see ‘Statistical significance assess-ment of annotations’ in the Materials and Methods section for details).
The presence of several redundant sequences in the search results could bias the term enrichment
Figure 1. Sma3s workflow. The first M1 module derives annotations from highly similar sequences stored in the database, choosing sequences using the Top-BLAST method, which selected the highest similarity homologue from each BLAST search that meets the minimum similarity criteria. The remaining sequences are passed to the second module (M2), which performs reciprocal BLAST searches to identify orthologous sequences as annotation sources, also using the Top-BLAST method. Finally, the M3 module obtains annotations from a set of related sequences whose similarity is supported by statistically significant concentrations of similar annotations, filtered by clustering techniques to avoid over-representation from duplicated gene families. This figure appears in colour in the online version ofDNA Research.
Table 1. Sma3s results with different source databases
Sn Sp REQ SC Swiss-Prot 0.83+0.13 0.87+0.07 0.19+0.15 0.87+0.13 TrEMBL 0.61+0.15 0.86+0.08 0.45+0.25 0.94+0.06 UniProt 0.68+0.09 0.87+0.07 0.32+0.14 0.94+0.05
Sequence coverage (SC), specificity (Sp), sensitivity (Sn) and REQ values are shown together with the corresponding stand-ard deviation.
algorithm. To reduce this possibility, very similar sequences are first combined by ‘clustering’. Redundant sequences are identified using blastclust ( part of the Blast package), using 95% identity and alignment length as search criteria. Thus, when evaluat-ing the frequency of annotation terms, each cluster counts only once, regardless of the number of sequences it contains.
In summary, Module 3 processes each query as follows (also see Fig. 1, M3): (i) the BLAST report is scanned for statistically significant alignments accord-ing to Rost’s equation; (ii) identification and groupaccord-ing of clusters containing very similar members of the same family; (iii) a preliminary annotation set is formed by combining individual non-redundant anno-tations from each cluster and finally, (iv) biological term enrichment is used to select significantly overrepre-sented annotations in each group of homologous sequences. Owing to the modular implementation of the algorithm, each module can be run independently, allowing the user to easily customize annotation criteria.
3.2. Sma3s annotates random Swiss-Prot sequence collections with high accuracy
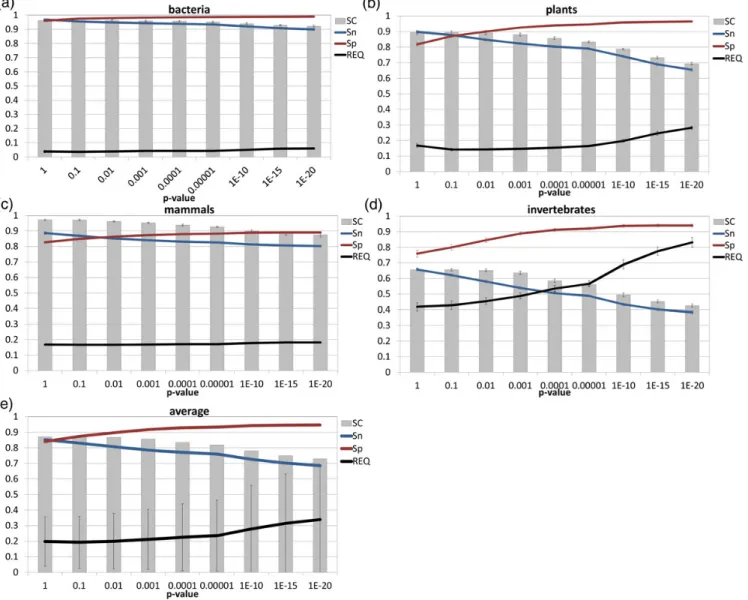
We trained Sma3s using random datasets extracted from the four Swiss-Prot taxonomic divisions. Five inde-pendent random sets of 1000 sequences (5000 in total) were extracted for each division. These sequences were then annotated using the corresponding division from Swiss-Prot, and each query sequence removed from the database at each step to avoid self-annotation. We evaluated the annotation of each random set of sequences for SC, specificity, sensitivity and REQ values (an accuracy measurement which combines both spe-cificity and sensitivity, with 0 being the best possible value). The results obtained varied significantly between taxonomic divisions, but not between differ-ent datasets from the same division (Fig.2).
To identify the optimal default cut-off value, we tested Sma3s with different P-values using our random datasets as query sequences and the corre-sponding taxonomic divisions of the Swiss-Prot data-base as annotation sources. As can be seen in Fig. 2, more restrictiveP-values generated consistent results with low REQ values and higher specificity (Sp) but at the cost of reduced sensitivity (Sn). The highest accur-acy, as defined by the lowest REQ values, was obtained when specificity and sensitivity had equal or similar values. With the exception of the invertebrate dataset, aP-value of 0.1 resulted in average sensitivity and spe-cificity values.0.8. These values compare favourably with those of other tools, such as Blast2GO9 or Gotcha,12 whose accuracy typically ranges between 0.65 and 0.7. On this basis, we established a default P-value of 0.1 for Sma3s.
When the same test datasets were annotated using the uncurated TrEMBL database or the complete UniProt database instead of Swiss-Prot, the average ac-curacy was reduced despite the high coverage obtained (Table 1). This can be explained by the fact that the unreviewed TrEMBL sequence collection is much larger than the manually annotated Swiss-Prot set. Thus, a large proportion of annotations assigned from the UniProt database are derived from TrEMBL, even though UniProt also contains Swiss-Prot sequences.
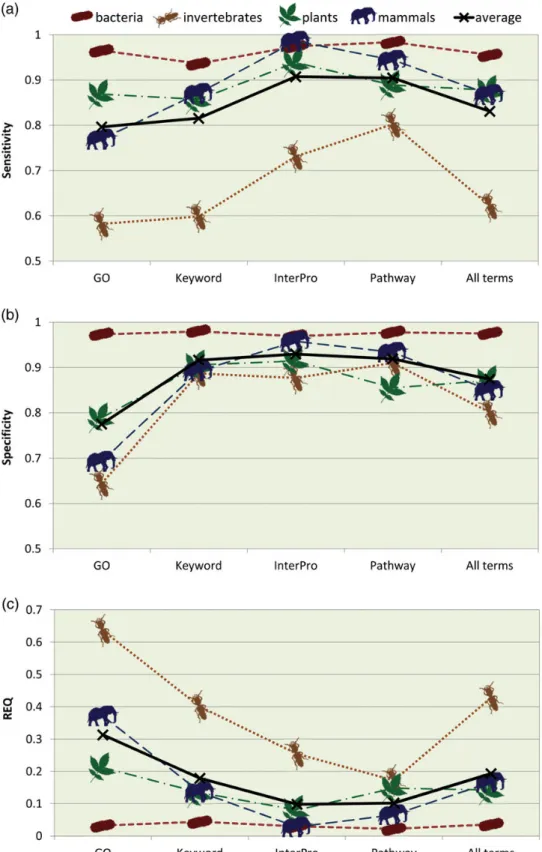
Accuracy was also calculated separately for each of the four annotation types recovered by Sma3s: GO terms, SW-Keywords, InterPro and Pathways (Fig. 3). Best results were obtained for Pathway and InterPro annotations, which had REQ values0.2 for all except the invertebrate dataset. Keyword and GO annotations had poorer REQ values, but still achieved average sensi-tivity and specificity values of 0.8 (and as high as 0.97 for bacteria). The exception, again, was the invertebrate dataset for which Sma3s generated higher REQ values, associated with significantly lower sensitivity. The rela-tively poor results for the invertebrate dataset are prob-ably due to the relatively small number of sequences present in the corresponding invertebrate database. Sequence length is also important. In fact, this dataset is the group with the highest proportion of very short sequences (10-40 amino acids), which are usually annotated with difficulty (Supplementary Fig. S1a).
3.3. The M3 module can enrich the annotation of previously analysed sequences
As described above, each dataset sequence is anno-tated by one of the three different modules in the Sma3s algorithm, which sequentially run from M1 to M3. To determine the effectiveness of each module, we calculated the percentage of random dataset sequences annotated by each module. On average, the M1 module annotated 53.76% of sequences (Table2) with M2 and M3 annotating the remainder (19.70 and 26.54%, respectively). As modules M2 and M3 only annotate query sequences that were not anno-tated by the previous module(s), the 26% of sequences annotated by M3 suggests that it significant-ly increases Sma3s annotation coverage.
M1 and M2 modules provide highly accurate results since annotations are obtained from verified ortholo-gues with high degrees of identity between query and donor sequences. However, as both modules employ the traditional Top-BLAST approach, each query se-quence is annotated from only one putative orthologue. In contrast, the M3 module typically extracts annota-tions from several homologous sequences identified in the BLAST report. To better compare the relative ben-efits of the different approaches used by Sma3s, we compared the annotation of our random datasets
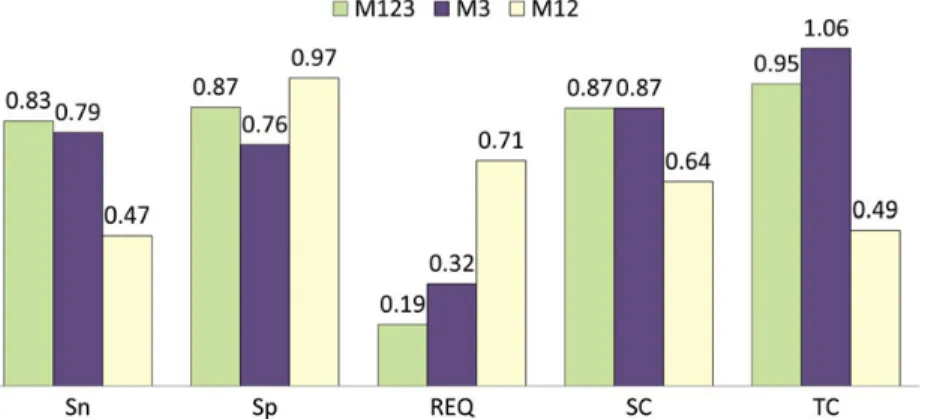
using the three modules as described above (M123) against annotation using Module 3 alone (M3). In the latter case, all sequences are annotated by Module 3, not just the sequences unannotated by Modules 1 and 2. Figure4shows that the mean specificity and sen-sitivity of the M3 module were slightly lower than the full Sma3s analysis, with the REQ value increasing from 0.19 to 0.32. However, M3 obtained more anno-tations (Fig.4, column TC) due to its ability to extract annotations from multiple homologues. M3 accuracy was also compared with combined M1 and M2 modules (M12), which represent more conventional annotation algorithms. M12 obtained higher specifi-city (0.97) since it annotates only using very similar sequences (Fig. 4). However, sensitivity is rather less (0.47) with only 64% of dataset sequences annotated. This results in an REQ value of 0.71 for M12 versus
the 0.32 for M3. Several examples illustrate this add-itional advantage of Sma3s M3 as a standalone annota-tion tool.
The best BLAST hit of the pig Qil1 protein (QIL1_PIG) in the mammalian dataset is the primate homologue (QIL1_MACFA). Because this protein entry does not contain any of the four annotation types used by Sma3s, pig Qil1 was not annotated by M1. However, the M3 module was able to annotate pig Qil1 localiza-tion using the GO term ‘Mitochondrion’, obtained from a more distant Qil1 mouse homologue (QIL1_MOUSE). The Sma3s M3 module could be used even in cases where incomplete annotations are present in Swiss-Prot. For example, when M1 or M2 Sma3s modules are used with invertebrate datasets, the U3-lycotoxin-Ls1a protein from the wolf spider (TX308_LYCSI) only generates the GO term ‘extracellular region’. In contrast,
Figure 2. Sma3s annotation of random Swiss-Prot test datasets. The sequence coverage (SC), specificity (Sp), sensitivity (Sn) and REQ values obtained by Sma3s are shown for (a) bacteria, (b) plants, (c) mammals, (d) invertebrates, (e) and average values, with standard deviation for all four datasets. This figure appears in colour in the online version ofDNA Research.
the M3 module annotates the sequence with two add-itional GO terms: ‘pathogenesis’ and ‘calcium channel inhibitor activity’. Since this protein belongs to the
spider toxin CSTX superfamily, which blocks mamma-lian neuronal calcium channels,26these terms should be present in the annotation of this protein.
Figure 3. Sensitivity, specificity and REQ index for different annotation types. (a) Sensitivity, (b) specificity and (c) REQ index calculated from the results obtained by Sma3s with the random datasets from different taxonomic divisions are shown, separated by the different annotation types under study. This figure appears in colour in the online version ofDNA Research.
Another example is the SfsA protein (SFSA_PSEF5) from Pseudomonas fluorescens. SfsA was annotated in bacterial datasets with the Swiss-Prot keyword ‘Complete proteome’ and no GO terms. However, M3 predicted the following Keywords and GO terms: DNA binding and carbohydrate metabolic process. These terms seem valid because the bacterial SfsA family includes sugar fermentation stimulation proteins that contain a helix-turn-helix motif that probably binds DNA at its C-terminus.27
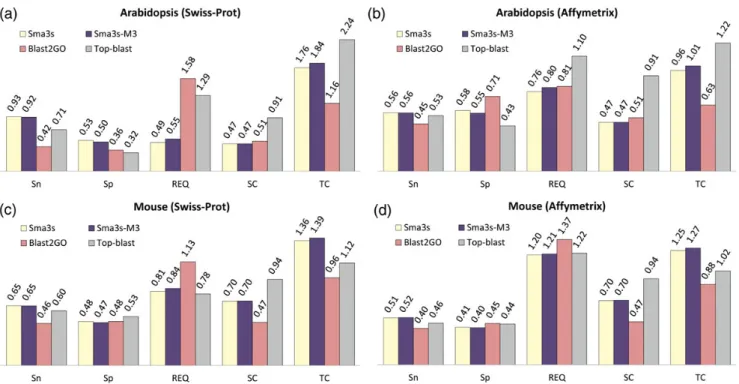
3.4. Accurate annotation of DNA array sequence sets To test Sma3s with an experimental set of sequences, we chose collections belonging to two different Affymetrix DNA arrays (one mouse and oneArabidopsis). The real annotations for these datasets were extracted from the Affymetrix web server (March, 2012) as GO terms linked to the sequences, or as GO terms extracted from Swiss-Prot IDs linked to the sequences. Sma3s was used to annotate these arrays using default para-meters, and accuracy measured using the reference annotations. We compared these results with the trad-itional Top-BLAST method, and the widely used Blast2GO tool with default annotation settings (Fig.5).
Arabidopsis and mouse array analyses were per-formed with either the Swiss-Prot (Fig. 5a) or Affymetrix (Fig.5b) annotations as references. In the case ofArabidopsis, Sma3s showed the best accuracy (as measured by REQ, sensitivity and specificity), al-though Top-BLAST provided a better sequence and TC. However, there were striking differences between the Swiss-Prot and Affymetrix annotation sources. We observed a much bigger difference in REQ values between Sma3s (M123 and M3 alone) and the other methods with Swiss-Prot annotations.
In the case of the mouse dataset, Sma3s provided sig-nificantly better sensitivity albeit with slightly poorer specificity than Top-BLAST when using Swiss-Prot as an annotation source (Fig. 5c). A similar pattern oc-curred when using Affymetrix sources (Fig. 5d), but the differences were more marginal. In contrast to the Arabidopsis collection, Sma3s generated the highest TC values for mouse sequences with both annotation sources. Our results suggest that both the full and M3-only implementations of Sma3s analysis compare favourably with commonly used annotation tools, with equal or better REQ values in almost all cases. However, it is clear that the annotation results obtained were very sensitive to both the query dataset and the choice of annotation source.
3.5. Sma3s is fast and has low-memory usage
In the post-genomic era, it is critical to have annota-tion tools that can be easily integrated into sequence analysis pipelines and applied quickly to large datasets. Therefore, it is important that annotation analyses run efficiently without excessive resource demands or se-quence limitations. To this end, we estimated the speed of Sma3s analysis using the modest computer hardware (see Materials and Methods for details). We tested run times and memory usage using three datasets with progressively increasing sizes (Fig.6). Measurements were taken separately for the BLAST search and sequence annotation steps. Sma3s processing times increased in
Table 2.Number of annotations assigned by each Sma3s module
Dataset Module Number of annotations %
Random M1 468.45+164.25 53.76 M2 171.70+45.12 19.70 M3 231.30+80.72 26.54 DNA arrays M1 386.5+369.82 5.23 M2 462.5+556.49 6.26 M3 6536.5+4531.85 88.50
The average number of annotations identified by Sma3s is shown for the random and DNA arrays datasets, together with the corresponding standard deviation. Note that the percentages for each dataset group sum 100%, since Sma3s has applied its three modules consecutively (default configuration).
Figure 4. Comparison of Sma3s performance using all modules (M123) or the M3 module alone. Corresponding sensitivity (Sn), specificity (Sp), sequence coverage (SC) and term coverage (TC) values appear above the bars. This figure appears in colour in the online version of
proportion to the numberof sequences analysed (Fig.6a). Times were highly dependent on the initial BLAST step which increased in proportion to the sequence number. However, Sma3s annotation times were much lower and barely affected by increasing dataset sizes. Significantly, Sma3s run times were two orders of magni-tude shorter than those of the Blast2GO method.
Memory usage was also measured using the same datasets and methods (Fig.6b). Sma3s had an essen-tially constant memory usage in its two steps despite the sequence number increase, in contrast to the Blast2Go method. Our results show that Sma3s is able to efficiently annotate large sequence datasets using modest computational resources.
4. Discussion
Sequencing projects produce hundreds of thousands of new biological sequences that need to be quickly and accurately annotated since this information constitutes the basis for subsequent analysis, such as pathway design or genomics and transcriptomics studies. Therefore, fast and user friendly methods are needed to support sequence annotation at this stage.
Sma3s uses three consecutive modules: M1 (which searches for very similar sequences in the database), M2 (which searches for orthologues) and M3 (which extracts information from several homologous sequences). The novel approach used by the M3 module selects several
homologues for each query sequence, using a modified Rost equation, which takes into account both alignment length and percentage identity. Annotations from all the non-redundant sequences are pooled, but only annota-tions that are significantly enriched versus the expected background frequencyare assigned to the querysequence. This has the advantage that useful annotation information present in several homologues can be extracted, rather than only from the sequence with the highest homology.
Our tests have shown that Sma3s is a fast annotation method requiring minimal human supervision and computational resources. Mean Sma3s accuracy using different annotation types (GO, Swiss-Prot keywords and pathways, and InterPro) was higher than 0.8 (except for the invertebrate dataset), and was even higher (0.9) for specific datasets such as bacteria. In add-ition, REQ values were consistently very low. InterPro an-notation was highly specific and sensitive (see Fig. 3), which can be explained by the fact that current InterPro annotation is strongly focused on sequence similarity, which has been shown to be effective for protein function prediction 26. On the other hand, it is difficult to judge Sma3s Swiss-Prot Pathway annotation given the limited coverage of this category in the UniProt database. Importantly, both InterPro and Pathway use short and controlled vocabularies with low term diversification.
Some annotation methods can assign sentences derived from the database description line 15. Sma3s can also assign this descriptor (data not shown). However, the accuracyof these non-standard annotations
Figure 5. Annotation of two DNA arrays using Sma3s, Blast2GO and Top-BLAST. The annotation prediction results of mouse and Arabidopsis sequences are shown from Sma3s with all modules, Sma3s with the M3 module only, Blast2GO and Top-BLAST. The corresponding values appear above the bars. Sn, sensitivity; Sp, specificity; SC, sequence coverage; TC, term coverage. This figure appears in colour in the online version ofDNA Research.
is difficult to measure, whereas controlled terms such as GO or Keywords are more useful for experiments using massive datasets. Sma3s can be easily adapted to use dif-ferent annotation classes, and each term predicted by Sma3s can be assigned a corresponding probability value. For example, Sma3s also includes annotations for the most probable gene names for each annotated se-quence (data not shown), which can be useful for non-specialized users who only want to rapidly identify their sequences. Furthermore, Sma3s could be used with other annotation sources since the annotation assign-ment step can easily be disengaged from the main algo-rithm and used with other databases. For example, the annotation component could be extended to use data from the BioMart project, which links annotations from heterogeneous databases to UniProt identifiers. If Sma3s was converted to a web service,28it could be direc-ted to use BioMart public web services as an annotation source. This would also make Sma3s more versatile by div-iding Blast and annotation steps into separate services.
4.1. The reference dataset and the BLAST results influence annotation accuracy
We demonstrated the accuracy of Sma3s with tests using different random datasets (Fig. 2). Moreover, Sma3s outperformed other widely used annotation methods when annotating DNA array datasets (Fig.5). The only exception was the mouse dataset using Swiss-Prot as a reference. The annotation accuracy of this dataset is strongly dependent on reference annotations, which in this case came from Affymetrix. These annota-tions are assigned using NetAffx, which is based on homology transfer from heterogeneous databases, in-cluding Swiss-Prot, but also Unigene and LocusLink 27. Furthermore, these annotations depend on the external database entries associated with individual Affymetrix sequences, which have been shown to contain frequent in-accuracies 28. Thus, selection of a suitably high-quality ref-erence annotation set seems to be an important factor for testing this oranyother method. Nevertheless, Sma3s pro-duced the best results in virtually all cases.
Further evidence for the idea that database annota-tion influences annotaannota-tion accuracy is presented in Table1, where the well-annotated Swiss-Prot division of UniProt provided the best accuracy (including speci-ficity and sensitivity), while TrEMBL provided the lowest values. UniProt is the most widely used protein database since it contains rich information on each sequence. UniProt is comprised of Swiss-Prot, a curated section reviewed by skilled annotators and TrEMBL, an unre-viewed section containing additional sequences that can be moved to Swiss-Prot once they have been manu-ally reviewed. We have found that the best annotation accuracy is obtained when Swiss-Prot is used as the sole reference database (Table1). Conversely, accuracy was reduced when using either TrEMBL or the complete UniProt database, mainly due to lower sensitivity. These lower values are expected partly because the test data-sets were extracted from Swiss-Prot, and partly because TrEMBL is a much larger database. Thus, when UniProt or TrEMBL are used as reference sources, a higher pro-portion of Sma3s annotations are TrEMBL-derived, which consequently lowers the average annotation accuracy.
Similarly, it is important to highlight that results were also dependent on the quality of annotated reference sequences for each taxonomic group. For example, Sma3s annotation of random invertebrate sequences was of a much lower quality than those of bacterial sequences. The main difference between the two Uniprot datasets is in the number of sequences they contain: 24 050 invertebrate sequences versus 326 570 bacterial sequences. In order for Module 3 to assign an annotation, it has to be statistically enriched within the homologous sequences. The prob-ability of finding enriched annotations is more likely
Figure 6. Run times and memory usage of Sma3s versus Blast2GO. Tests were performed using datasets with different numbers of sequences (500, 1000 and 2000). The different steps in both tools are shown as separate bars. Blast2GO did not report results with datasets.1000 sequences due to memory problems. (a) Sma3s and Blast2GO run times are shown in the first and second bars, respectively. (b) Sma3s and Blast2GO memory usage are shown in the first and second bars, respectively. Sma3s includes Blast and annotation (term assignment to query sequences) steps, and Blast2GO additionally includes the mapping step (term extraction from the obtained hits). This figure appears in colour in the online version ofDNA Research.
with the higher numbers of candidate sequences avail-able in the bacterial dataset. In fact, we have found that a combination of TrEMBL and SWISS-PROT databases increases sensitivity when annotating weakly con-served genomes (unpublished observation). However, this approach results in a higher rate of false positives.
Sequence length may be an important factor for suc-cessful annotation. For example, short sequences occur most frequently in invertebrates and to a lesser extent in plants (Supplementary Fig. S1a). These sequences are rarely annotated due to the low alignment scores they produce. The M1 module, which requires very high levels of similarity, is typically the most effective Sma3s component for annotation of these sequences (Supplementary Fig. S1b). This effect is likely to be enhanced by the higher diversity of the invertebrate dataset versus the bacterial one.
Another key factor for successful annotation is the initial BLAST search. In order for a sequence to be anno-tated by any of the three Sma3s modules, the initial BLAST must identify sequence alignments. For example, of the 30% of mouse array sequences which were not annotated by Sma3s (SC¼0.7 in Fig.5), 86% lacked BLAST results, making annotation impossible. In the case of Arabidopsis array sequences, 40% lacked BLAST results thus limiting annotation coverage to a maximum of 60%. This dependency on BLAST results is shared with most annotation methods, including AutoFact 11, Blast2GO 9 and GOtcha 12. In the case of Sma3s, the effect of the BLAST search is especially im-portant given that Sma3s was able to annotate 90% of array sequences with BLAST alignments, largely due to the novel M3 module (Table2).
4.2. The combined use of the three Sma3s modules generates accurate annotation, with enhanced coverage from the M3 module
We have shown that Sma3s can annotate different dataset types using its three module structure. Modules M1 and M2 are able to identify closely related database sequences and extract specific annotations, albeit with low overall coverage (TC in Figs 4 and 5). Thus, modules M1 and M2 provide high-quality annotations (with lower REQ values), increasing the overall sensitivity and specificity of Sma3s (Sn and Sp in Fig.4).
Our findings suggest that the M3 module can in-crease SC in some cases, especially where close ortholo-gues lack database annotation. The initial BLAST result can be reused by the M3 module to obtain new annota-tions for sequences previously annotated by M1 or M2. M3 annotation is broader, allowing new terms to be found (Fig.4) but with lower specificity, thus increasing the chance of generating false positives. For most appli-cations, using the three Sma3s modules sequentially balance the higher accuracy of Modules 1 and 2 with
the identification of useful annotations from Module 3 for otherwise unannotated sequences.
Our results demonstrate that the Sma3s M3 module is able to generate new annotations for sequences that were unannotated in their original databases. Thus, the M3 module may be valuable as a database curation tool, adding new annotations to existing public data-bases. However, it is important to take into account that this module is likely to generate annotations with lower specificity (Sp in Figs 4 and 5). Ideally, users would be able to choose between high sensitivity and high specificity according to the goal of the experiment. 4.3. Sma3s has low computing requirements
The Sma3s algorithm comprises two different basic steps: similarity searching by BLAST and annotation by different strategies in each of the three modules. For high-throughput analyses, the BLAST itself accounts for most of the calculation time. Result execution times (Fig.6) demonstrate that parallel BLAST searches could accelerate the process without affecting the rest of the algorithm. In fact, both Sma3s and Blast2GO can use separately generated BLAST reports, which may allow accelerated analysis if the user was to execute similarity searches in parallel. However, the speed advantage of Sma3s over Blast2GO is due to more than the speed of the BLAST search. Another reason for the speed of Sma3s is that it uses Swiss-Prot, a relatively small high-quality database, which itself increases annotation accuracy (Figs2,3and5). These results together allow for a faster and more accur-ate annotation process when analysing large datasets. Thus, Sma3s can annotate a set of 20 000 sequences in3 h, without human intervention. Finally, memory usage is low (Fig.6b), alleviating the need for high per-formance computing facilities.
In conclusion, Sma3s is a fast and accurate method for annotating massive nucleotide or amino acid datasets in a way that is readily accessible for non-expert users. In fact, Sma3s has already been used in the functional an-notation of both the olive29and the maritime pine30 transcriptomes, and is now being used for the annota-tion of both a new bacterial genome and an EST database of almost 300 plant datasets containing a total of 8.6 million sequences (data not published yet).
Authors’ contributions
A.M.M. significantly helped in the design computa-tional implementation, and testing of Sma3s algorithm. E.V. and M.G.C. contributed to computational design and rationale. O.T. managed and coordinated the initial stages, including the training. A.J.P.P. conceived the study, carried out the design, the tests and trainings, and wrote the computer program and the manuscript.
Acknowledgement: We thank John Pearson for his critical reading of the manuscript.
Supplementary data: Supplementary data are available at www.dnaresearch.oxfordjournals.org.
Funding
This work has been partially financed by the National Institute for Bioinformatics (www.inab.org), a platform of Genoma Espan˜a and the EC project ‘Advancing Clinico-Genomic Trials on Cancer’ (contract no. 026996).
References
1. Rost, B., Liu, J., Nair, R., Wrzeszczynski, K.O. and Ofran, Y. 2003, Automatic prediction of protein function, Cell. Mol. Life Sci.,60, 2637 –50.
2. Loewenstein, Y., Raimondo, D., Redfern, O.C., et al. 2009, Protein function annotation by homology-based infer-ence,Genome Biol.,10, 207.
3. Abascal, F. and Valencia, A. 2003, Automatic annotation of protein function based on family identification,
Proteins,53, 683 –92.
4. Juncker, A.S., Jensen, L.J., Pierleoni, A., et al. 2009, Sequence-based feature prediction and annotation of proteins,Genome Biol.,10, 206.
5. Moller, S., Leser, U., Fleischmann, W. and Apweiler, R. 1999, EDITtoTrEMBL: a distributed approach to high-quality automated protein sequence annotation,
Bioinformatics,15, 219–27.
6. Carmona-Saez, P., Chagoyen, M., Tirado, F., Carazo, J.M. and Pascual-Montano, A. 2007, GENECODIS: a web-based tool for finding significant concurrent annotations in gene lists,Genome Biol.,8, R3.
7. Rodriguez-Baena, D.S., Perez-Pulido, A.J. and Aguilar-Ruiz, J.S. 2011, A biclustering algorithm for extracting bit-patterns from binary datasets, Bioinformatics, 27, 2738–45.
8. Altschul, S.F., Madden, T.L., Schaffer, A.A., et al. 1997, Gapped BLAST and PSI-BLAST: a new generation of protein database search programs,Nucleic Acids Res.,25, 3389–402.
9. Conesa, A., Gotz, S., Garcia-Gomez, J.M., Terol, J., Talon, M. and Robles, M. 2005, Blast2GO: a universal tool for anno-tation, visualization and analysis in functional genomics research,Bioinformatics,21, 3674–6.
10. Ashburner, M., Ball, C.A., Blake, J.A., et al. 2000, Gene ontology: tool for the unification of biology, The Gene Ontology Consortium,Nat. Genet.,25, 25–9.
11. Koski, L.B., Gray, M.W., Lang, B.F. and Burger, G. 2005, AutoFACT: an automatic functional annotation and clas-sification tool,BMC Bioinformatics,6, 151.
12. Martin, D.M., Berriman, M. and Barton, G.J. 2004, GOtcha: a new method for prediction of protein function assessed by the annotation of seven genomes,BMC Bioinformatics, 5, 178.
13. Hotz-Wagenblatt, A., Hankeln, T., Ernst, P., Glatting, K.H., Schmidt, E.R. and Suhai, S. 2003, ESTAnnotator: a tool for high throughput EST annotation,Nucleic Acids Res., 31, 3716–9.
14. Strahm, Y., Powell, D. and Lefevre, C. 2006, EST-PAC a web package for EST annotation and protein sequence predic-tion,Source Code Biol. Med.,1, 2.
15. Kankainen, M., Ojala, T. and Holm, L. 2012, BLANNOTATOR: enhanced homology-based function prediction of bacterial proteins,BMC Bioinformatics,13, 33.
16. Medina, I., Carbonell, J., Pulido, L., et al. 2010, Babelomics: an integrative platform for the analysis of transcrip-tomics, proteomics and genomic data with advanced functional profiling,Nucleic Acids Res.,38, W210–213. 17. Huang, D.W., Sherman, B.T. and Lempicki, R.A. 2009,
Systematic and integrative analysis of large gene lists using DAVID bioinformatics resources, Nat. Protoc., 4, 44–57.
18. Kasprzyk, A. 2011, BioMart: driving a paradigm change in biological data management,Database (Oxford),2011, bar049.
19. Tian, W. and Skolnick, J. 2003, How well is enzyme func-tion conserved as a funcfunc-tion of pairwise sequence iden-tity?,J. Mol. Biol.,333, 863–82.
20. The UniProt Consortium. 2007, The Universal Protein Resource (UniProt),Nucleic Acids Res.,35, D193–7. 21. Mulder, N.J., Apweiler, R., Attwood, T.K., et al. 2007, New
developments in the InterPro database, Nucleic Acids Res.,35, D224–8.
22. Sander, C. and Schneider, R. 1991, Database of hom-ology-derived protein structures and the structural meaning of sequence alignment,Proteins,9, 56–68. 23. Rost, B. 1999, Twilight zone of protein sequence
align-ments,Protein Eng.,12, 85–94.
24. Wilson, C.A., Kreychman, J. and Gerstein, M. 2000, Assessing annotation transfer for genomics: quantifying the relations between protein sequence, structure and function through traditional and probabilistic scores,
J. Mol. Biol.,297, 233 –49.
25. Gower, A.C., Spira, A. and Lenburg, M.E. 2011, Discovering biological connections between experimental conditions based on common patterns of differential gene expres-sion,BMC Bioinformatics,12, 381.
26. Zhang, Y., Chen, J., Tang, X., et al. 2010, Transcriptome analysis of the venom glands of the Chinese wolf spider
Lycosa singoriensis,Zoology (Jena),113, 10–8.
27. Takeda, K., Akimoto, C. and Kawamukai, M. 2001, Effects of theEscherichia colisfsA gene on mal genes expression and a DNA binding activity of SfsA, Biosci. Biotechnol. Biochem.,65, 213–7.
28. Ramı´rez, S., Mun˜oz-Me´rida, A., Karlsson, J., et al. 2010, MOWServ: a web client for integration of bioinformatic resources,Nucleic Acids Res.,38, W671–676.
29. Mun˜oz-Me´rida, A., Gonza´lez-Plaza, J.J., Can˜ada, A., et al. 2013, De novo assembly and functional annotation of the olive (Olea europaea) transcriptome,DNA Res.,20, 93–108.
30. Canales, J., Bautista, R., Label, P., et al. 2013, De novo as-sembly of maritime pine transcriptome: implications for forest breeding and biotechnology,Plant Biotechnol. J.[Epub ahead of print] PMID: 24256179.