doi: 10.3389/fninf.2016.00004
Edited by: Daniel Marcus, Washington University in St. Louis, USA Reviewed by: Hidetoshi Ikeno, University of Hyogo, Japan Peter Kochunov, University of Maryland School of Medicine, USA *Correspondence: Oscar Esteban [email protected] Received:16 September 2015 Accepted:18 January 2016 Published:05 February 2016 Citation: Esteban O, Caruyer E, Daducci A, Bach-Cuadra M, Ledesma-Carbayo MJ and Santos A (2016) Diffantom: Whole-Brain Diffusion MRI Phantoms Derived from Real Datasets of the Human Connectome Project. Front. Neuroinform. 10:4. doi: 10.3389/fninf.2016.00004
Diffantom: Whole-Brain Diffusion
MRI Phantoms Derived from Real
Datasets of the Human Connectome
Project
Oscar Esteban1, 2*, Emmanuel Caruyer3, Alessandro Daducci4, Meritxell Bach-Cuadra4, 5,
María J. Ledesma-Carbayo1, 2and Andres Santos1, 2
1Biomedical Image Technologies, ETSI Telecomunicación, Universidad Politécnica de Madrid, Madrid, Spain,2Centro de
Investigación Biomédica en Red en Bioingeniería, Biomateriales y Nanomedicina, Madrid, Spain,3Centre National de la
Recherche Scientifique, UMR 6074 - Institut de Recherche en Informatique et Systèmes Aléatoires (IRISA) VisAGeS Research Group, Rennes, France,4Signal Processing Laboratory (LTS5), École Polytechnique Fédérale de Lausanne,
Lausanne, Switzerland,5Department of Radiology, Centre d’Imagerie BioMédicale (CIBM), Centre Hospitalier Universitaire
Vaudois (CHUV) and University of Lausanne (UNIL), Lausanne, Switzerland
Keywords: data collection, diffusion magnetic resonance imaging, phantoms, imaging, connectomics, evaluation, simulations
DIFFANTOM IN BRIEF
Diffantom is a whole-brain diffusion MRI (dMRI) phantom publicly available through the Dryad Digital Repository (doi:10.5061/dryad.4p080). The dataset contains two single-shell dMRI images, along with the corresponding gradient information, packed following the BIDS standard (Brain Imaging Data Structure, Gorgolewski et al., 2015). The released dataset is designed for the evaluation of the impact of susceptibility distortions and benchmarking existing correction methods.
In this Data Report we also release the software instruments involved in generatingdiffantoms, so that researchers are able to generate new phantoms derived from different subjects, and apply these data in other applications like investigating diffusion sampling schemes, the assessment of dMRI processing methods, the simulation of pathologies and imaging artifacts, etc. In summary,
Diffantomis intended for unit testing of novel methods, cross-comparison of established methods, and integration testing of partial or complete processing flows to extract connectivity networks from dMRI.
INTRODUCTION
Fiber tracking on dMRI data has become an important tool for thein vivoinvestigation of the structural configuration of fiber bundles at the macroscale. Tractography is fundamental to gain information about white matter (WM) morphology in many clinical applications like neurosurgical planning (Golby et al., 2011), post-surgery evaluations (Toda et al., 2014), and the study of neurological diseases as inChua et al.(2008) addressing multiple sclerosis and Alzheimer’s disease. The analysis of structural brain networks using graph theory is also applied on tractography, for instance in the definition of the unique subject-wise patterns of connectivity (Sporns et al., 2005), in the assessment of neurological diseases (Griffa et al., 2013), and in the study of the link between structural and functional connectivity (Messé et al., 2015). However, the development of the field is limited by the lack of a gold standard to test and compare the wide range of methodologies available for processing and analyzing dMRI.
Esteban et al. Diffantom
Large efforts have been devoted to the development of physical phantoms (Lin et al., 2001; Campbell et al., 2005; Perrin et al., 2005; Fieremans et al., 2008; Tournier et al., 2008).
Côté et al.(2013) conducted a thorough review of tractography methodologies using the so-calledFiberCupphantom (Poupon et al., 2008; Fillard et al., 2011). These phantoms are appropriate to evaluate the angular resolution in fiber crossings and accuracy of direction-independent scalar parameters in very simplistic geometries. Digital simulations are increasingly popular because the complexity of whole-brain tractography can not be accounted for with current materials and proposed methodologies to build physical phantoms. Early digital phantoms started with simulation of simple geometries (Basser et al., 2000; Gössl et al., 2002; Tournier et al., 2002; Leemans et al., 2005) to evaluate the angular resolution as well. These tools generally implemented the multi-tensor model (Alexander et al., 2001; Tuch et al., 2002) to simulate fiber crossing, fanning, kissing, etc.Close et al.(2009) presented theNumerical Fiber Generator, a software to simulate spherical shapes filled with digital fiber tracts.Caruyer et al.(2014) proposedPhantomasto simulate any kind of analytic geometry inside a sphere. Phantomas models diffusion by a restricted and a hindered compartment, similar to Assaf and Basser (2005). Wilkins et al. (2015) proposed a whole-brain simulated phantom derived from voxel-wise orientation of fibers averaged from real dMRI scans and the multi-tensor model with a compartment of isotropic diffusion.
Neher et al.(2014) proposedFiberFox, a visualization software to develop complex geometries and their analytical description. Once the geometries are obtained, the software generates the corresponding dMRI signal with a methodology very close to that implemented in Phantomas. An interesting outcome of
FiberFoxis the phantom dataset1 created for the Tractography
Challenge held in ISMRM 2015. This dataset was derived from the tractography extracted in one Human Connectome Project (HCP,Van Essen et al., 2012) dataset. In the tractogram, 25 fiber bundles of interest were manually segmented by experts. Using
FiberFox, the segmentation of each bundle was mapped to an analytical description, and finally simulated the signal.
In this data report we presentDiffantom, anin silicodataset to assess tractography and connectivity pipelines using dMRI real data as source microstructural information. Diffantom is inspired by the work ofWilkins et al.(2015), with two principal novelties. First, since we use a dataset from the HCP as input, data are already corrected for the most relevant distortions. The second improvement is a more advanced signal model to generate the phantom using the hindered and restricted diffusion model of Phantomas (Caruyer et al., 2014). As a result, we provide a whole-brain digital phantom of dMRI data with structural information derived from an HCP dataset. We also openly release the diffantomizer workflow, the software package necessary to generate customdiffantoms.Diffantomis originally designed for the investigation of susceptibility-derived distortions, a typical artifact that produces geometrical warping in certain regions of dMRI datasets. In Esteban et al. (2014) we addressed this phenomenon and concluded that the connectivity matrix of
1Available at: http://www.tractometer.org/ismrm_2015_challenge/.
Phantomaswas not dense enough to evaluate the integration of correction methods in pipelines for the connectome extraction.
DATA DESCRIPTION
Microstructural Model
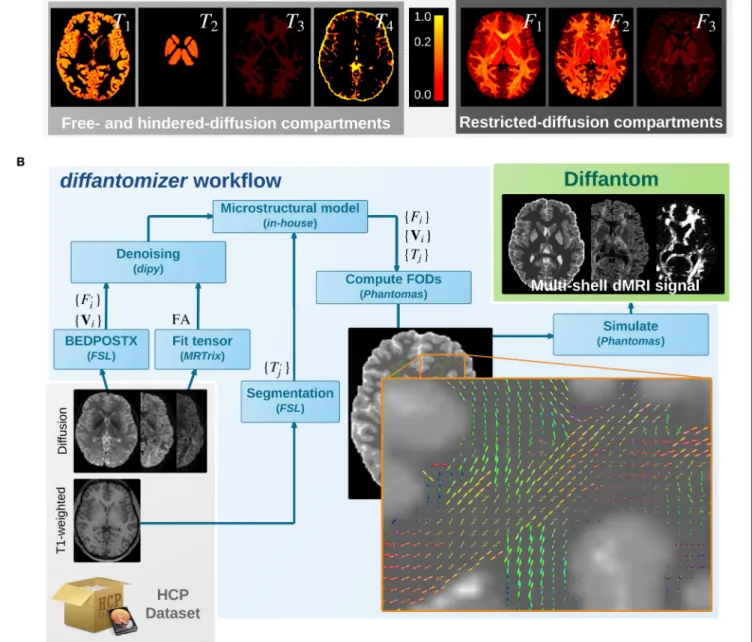
The simulation process relies on a microstructural model derived from real data. On one hand, the diffantomizer workflow requires up to five fraction maps{Tj|j ∈ {1, . . . ,5}}of
free-and hindered- diffusion (seeFigure 1A). These compartments will be derived from the macroscopic structure of tissues within the brain, specified in the following order2: cortical
gray matter (cGM), deep gray matter (dGM), WM, CSF, and abnormal tissue3. On the other hand, the restricted-diffusion compartments are specified by up to three volume fractions
{Fi|i∈ {1,2,3}}of three single fiber populations per voxel along
with their corresponding direction maps{Vi|i∈ {1,2,3}}.
The process to obtain the microstructural model from one dataset of the HCP can be described as follows (see also Figure 1B): (1) The fiber orientation maps {Vi} and
their corresponding estimations of volume fraction {F′ i} are
obtained using the ball-and-stick model for multi-shell data of BEDPOSTX (Bayesian Estimation of Diffusion Parameters Obtained using Sampling Techniques modeling crossing – X– fibres, Jbabdi et al., 2012) on the dMRI data. The HCP recommends BEDPOSTX to reconstruct their data (Glasser et al., 2013). A further advantage is that BEDPOSTX exploits the multi-shell acquisitions of the HCP while operating at whole-brain level. (2) A fractional anisotropy (FA) map is obtained after fitting a tensor model with MRTrix. As we shall see in the Appendix, the FA is used to inferF1 (the fraction map of the
most prevalent fiber), avoiding the extremely noisy estimation of F′
1 performed by BEDPOSTX in the previous step. (3) The
original fiber fractions{F′i}and the FA map are denoised with a
non-local means filter included indipy(Garyfallidis et al., 2014). This step produces an important smoothing of the maps, while preserving the edges. Smoothing is also beneficial in simplifying the voxel-wise diffusion model. (4) The macrostructural fractions
{Tj′} are extracted from the T1-weighted image of the dataset,
using standardFSLsegmentation tools (Jenkinson et al., 2012). (5) The images obtained previously (FA map, {Vi}, {Fi′}, and {Tj′}) are combined as described in the Appendix to generate the final microstructural model ({Vi},{Fi}, and{Tj}), presented in Figure 1A.
Diffusion Signal Generation
Once a microstructural model of the subject has been synthesized, the fiber orientation maps {Vi} are weighted
by the fiber-fraction maps{Fi}and projected onto a continuous
representation of the fiber orientation distributions (FODs). A close-up showing how the FODs map looks is presented in
Figure 1B. The single fiber response is a Gaussian diffusion
2Corresponding to the5TT formatestablished with the latest version 3.0 ofMRTrix
(Tournier et al., 2012).
3Since here we simulate healthy subjects, the last fraction mapT
5is empty and can
FIGURE 1 | (A)Microstructural model ofDiffantom. The phantom is simulated from an underlying microstructural model specified with the following volume-fraction
maps: three hindered-diffusion compartments{T1,T2,T3}, one free-diffusion compartmentT4corresponding to the CSF, three restricted-diffusion compartments{Fi},
and three vectorial maps associated with the local fiber directions{Vi}. Please note the piece-wise linear function of the color scale to enable visibility of small volume
fractions.(B)Thediffantomizerworkflow, a workflow to generatediffantoms. The pipeline to generate phantoms from any HCP dataset is presented in the lower
panel. Once the microstructural model shown in the upper panel has been prepared as described in Microstructural Model, the local orientations are computed and
fed intoPhantomasto finally simulate the signal.
tensor with axial symmetry and eigenvalues λ1 = 2.2·10−3
mm2s−1 and λ
2,3 = 0.2·10−3 mm2s−1. The resulting FODs
map is then combined with the free- and hindered-diffusion compartments corresponding to {Tj}. The free-diffusion
compartment corresponds to the CSF fraction map T4
and is modeled with isotropic diffusivity DCSF of 3.0·10−3
mm2s−1. The hindered-diffusion compartments correspond to{T1,T2,T3}and are also modeled with isotropic diffusivity
Esteban et al. Diffantom
DWM =2.0·10−4,DcGM =7.0·10−4 andDdGM =9.0·10−4,
respectively [mm2s−1]. All these values for diffusivity (and the
corresponding to the single-fiber response) can be modified by the user with custom settings. The restricted- and hindered-compartments are then fed intoPhantomas(Caruyer et al., 2014) and the final dMRI signal is obtained. By default, diffusion data are generated using a scheme of 100 directions distributed in one shell with uniform coverage (Caruyer et al., 2013). Custom one-or multi-shell schemes can be generated supplying the tables of corresponding vectors andb-values. Rician noise is also included inPhantomas, and the signal-to-noise ratio (SNR) can be set by the user. The default value for SNR is preset to 30.0.
Implementation and Reproducibility
We also provide the diffantomizer workflow, the software package used to generatediffantoms, so that users can regenerate similar datasets with different parameters. This workflow, presented inFigure 1, is implemented usingnipype(Gorgolewski et al., 2011) to ensure reproducibility and usability.
Interpretation and Recommended Uses
To illustrate the features of Diffantom, the example dataset underwent a simplified connectivity pipeline including constrained spherical deconvolution (CSD) and probabilistic tractography from MRTrix (Tournier et al., 2012). CSD was reconstructed using 8th-order spherical harmonics, and tractography with 1.6·106seed points evenly distributed across a
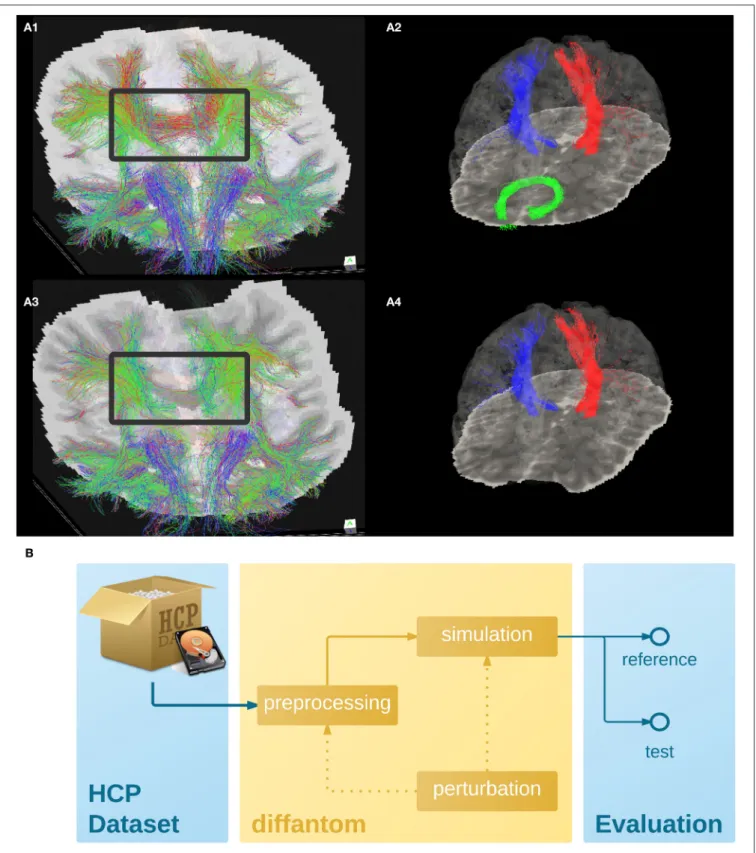
dilated mask of the WM tissue.Figures 2A1,A3, show the result of the tractography obtained with such pipeline for the original
Diffantom and a distorted version. Finally, we applied tract querier(Wassermann et al., 2013) to segment some fiber bundles such as the CST and the forceps minor (see Figures 2A2,A4). Particularly, due to its location nearby the orbitofrontal lobe, the forceps minor is generally affected by susceptibility distortions.
We recommend Diffantom as ground-truth in verification and validation frameworks (Figure 2B) for testing pipelines.
Diffantom is applicable in the unit testing of algorithms, the integration testing of modules in workflows, and the overall system testing. Some potential applications follow:
• Investigating the impact of different diffusion sampling schemes on the local microstructure model of choice and on the subsequent global tractography outcome. Since the gradient scheme can be set by the user,Diffantomcan be seen as a mean to translate the so-calledb-matrix of the source dataset to any target scheme.
• Assessment of sensitivity and robustness to imaging artifacts (noise, partial volume effect and CSF contamination, susceptibility-derived warping, Eddy-currents-derived distortions, etc.) at unit, integration and systems testing levels.
• UsingDiffantomas inFigure 2B, it is possible to apply binary classification measures to evaluate the resulting connectivity matrix. Considering the connectivity matrix of thereference Diffantomand the resulting matrix of thetest Diffantom, the receiver operating characteristic (ROC) of the pipeline can be characterized.
• Simulation of pathological brains by altering the microstructural model accordingly (e.g., as tumors were simulated inKaus et al., 2000).
In order to exemplify one of these intended uses, we also release a Diffantom including the susceptibility-derived distortion in simulation. These two images belong to a broader dataset, automatically generated, used in a study to quantify the impact of susceptibility distortions and correction methods on the connectome extraction (Esteban, 2015, Chapter 5). In this study, three widely-used correction methods are compared in a reference framework of severalDiffantomswith realistic and controlled distortions. This context provides a useful resource to characterize the impact of susceptibility distortion on the final connectivity network and allows the evaluation of the different correction methodologies available.
DISCUSSION
Whole-brain, realistic dMRI phantoms are necessary in the developing field of structural connectomics. Diffantom is a derivative ofWilkins et al.(2015) in terms of methodology for simulation with two major advances. First, the correctness of theminimally preprocessed data (Glasser et al., 2013) released within the HCP.Wilkins et al.(2015) explicitly state that their original data were not corrected for certain artifacts, and thus, generated data are affected correspondingly. Second,Diffantom
implements the hindered and restricted compartments model (Assaf and Basser, 2005), which is a more complete model than the multi-tensor diffusion model.
A possible competitor toDiffantomis the phantom generated for the Tractography Challenge in ISMRM 2015. Similarly to Diffantom, the organizers used an HCP subject as source of structural information. While this phantom is designed for the bundle-wise evaluation of tractography (with the scores defined in the Tractometer (Côté et al., 2013), such as geometrical coverage, valid connections, invalid connections, missed connections, etc.), Diffantom is intended for the connectome-wise evaluation of results, yielding a tractography with a large number of bundles. Therefore, Diffantom and
FiberFox are complementary as the hypotheses that can be investigated are different. Moreover,Diffantomdoes not require costly manual segmentation of bundles, highly demanding in terms of physiology expertise and operation time. The software workflow released with this data report (the diffantomizer) ensures the reproducibility of Diffantom and enables the generation of customdiffantoms. Thediffantomizeris designed for, but not limited to, use HCP datasets as source of structural information.
CONCLUSION
Diffantom is a whole-brain digital phantom generated from a dataset from the Human Connectome Project. Diffantom is presented here to be openly and freely distributed along with the diffantomizer workflow to generate new diffantoms. We
FIGURE 2 | (A)Example dataset.(A1,A3)Shows the tractogram of fibers crossing slice 56 ofDiffantomas extracted withMRTrix, represented over the
corresponding slice of theb0volume for the original(A1)and the distorted(A3)phantoms, with a gray frame highlighting the absence of important tracks. Panels
(A2,A4)show the segmentation of the right CST represented with blue streamlines, the left CST (red streamlines), and the forceps minor (green streamlines) using tract_querier.(A2,A4)Include the slice 56 of theb0and the pial surface is represented with transparency (see Supplementary Videos 1,2). In the distortedDiffantom
(A4)the forceps minor was not detected.(B)Recommended use ofDiffantom. The phantom is designed to be used as ground-truth information in evaluation
frameworks, to implement unit test of algorithms, to check integration of processing units within pipelines or to validate complete workflows. For instance, in order to evaluate artifacts, a perturbation can be induced in the microstructural model or after simulation to provide reference and test datasets.
Esteban et al. Diffantom
encourage the neuroimage community to contribute with their owndiffantomsand share them openly.
DATA SHARING
The firstDiffantomand its distorted version are available under the Creative Commons Zero licence (CC0) using the Dryad Digital Repository (doi:10.5061/dryad.4p080). The package is organized following the BIDS standard. The associated software to “diffantomize” real dMRI datasets is available at https://github. com/oesteban/diffantom under an MIT license. Phantomas is available in https://github.com/ecaruyer/Phantomas under the revised-BSD license.
AUTHOR CONTRIBUTIONS
All the authors contributed to this study. OE designed the data generation procedure, implemented the processing pipelines and generated the example dataset. EC implementedPhantomas
(Caruyer et al., 2014), helped integrate the project with the simulation routines. OE, EC, AD thoroughly discussed and framed the aptness of the data in the community. AD, MB,
ML, and AS interpreted the resulting datasets. MB, ML, and AS advised on all aspects of the study.
FUNDING
This study was supported by the Spanish Ministry of Science and Innovation (projects TEC-2013-48251-C2-2-R and INNPACTO XIORT), Comunidad de Madrid (TOPUS) and European Regional Development Funds, the Center for Biomedical Imaging (CIBM) of the Geneva and Lausanne Universities and the EPFL, as well as the Leenaards and Louis Jeantet Foundations.
ACKNOWLEDGMENTS
We thank Gert Wollny for his revision of this work.
SUPPLEMENTARY MATERIAL
The Supplementary Material for this article can be found online at: http://journal.frontiersin.org/article/10.3389/fninf. 2016.00004
REFERENCES
Alexander, A. L., Hasan, K. M., Lazar, M., Tsuruda, J. S., and Parker, D. L. (2001). Analysis of partial volume effects in diffusion-tensor MRI.Magn. Reson. Med.
45, 770–780. doi: 10.1002/mrm.1105
Assaf, Y., and Basser, P. J. (2005). Composite hindered and restricted model of diffusion (CHARMED) MR imaging of the human brain.Neuroimage27, 48–58. doi: 10.1016/j.neuroimage.2005.03.042
Basser, P. J., Pajevic, S., Pierpaoli, C., Duda, J., and Aldroubi, A. (2000).In vivofiber tractography using DT-MRI data.Magn. Reson. Med.44, 625–632. doi: 10.1002/ 1522-2594(200010)44:4<625::AID-MRM17>3.0.CO;2-O
Campbell, J. S. W., Siddiqi, K., Rymar, V. V., Sadikot, A. F., and Pike, G. B. (2005). Flow-based fiber tracking with diffusion tensor and q-ball data: Validation and comparison to principal diffusion direction techniques.Neuroimage27, 725–736. doi: 10.1016/j.neuroimage.2005.05.014
Caruyer, E., Daducci, A., Descoteaux, M., Houde, J.-C., Thiran, J.-P., and Verma, R. (2014). “Phantomas: a flexible software library to simulate diffusion MR phantoms,” in 23th The International Society for Magnetic Resonance in Medicine, Vol. 23 (Milano).
Caruyer, E., Lenglet, C., Sapiro, G., and Deriche, R. (2013). Design of multishell sampling schemes with uniform coverage in diffusion MRI.Magn. Reson. Med.
69, 1534–1540. doi: 10.1002/mrm.24736
Chua, T. C., Wen, W., Slavin, M. J., and Sachdev, P. S. (2008). Diffusion tensor imaging in mild cognitive impairment and Alzheimer’s Disease: a review.Curr. Opin. Neurol.21, 83–92. doi: 10.1097/WCO.0b013e3282f4594b
Close, T. G., Tournier, J.-D., Calamante, F., Johnston, L. A., Mareels, I., and Connelly, A. (2009). A software tool to generate simulated white matter structures for the assessment of fibre-tracking algorithms. Neuroimage47, 1288–1300. doi: 10.1016/j.neuroimage.2009.03.077
Côté, M.-A., Girard, G., Boré, A., Garyfallidis, E., Houde, J.-C., and Descoteaux, M. (2013). Tractometer: towards validation of tractography pipelines.Med. Image Anal.17, 844–857. doi: 10.1016/j.media.2013.03.009
Esteban, O. (2015).Image Processing Methods for Human Brain Connectivity Analysis From In-vivo Diffusion MRI. Ph.D thesis, ETSI Telecomunicación, Universidad Politécnica de Madrid, Madrid. doi: 10.6084/m9.figshare.1598091 Esteban, O., Daducci, A., Caruyer, E., O’Brien, K., Ledesma-Carbayo, M. J., Bach-Cuadra, M., et al. (2014). “Simulation-based evaluation of susceptibility distortion correction methods in diffusion MRI for connectivity analysis,”
inBiomedical Imaging (ISBI), 2014 IEEE 11th International Symposium on
(Beijing), 738–741. doi: 10.1109/ISBI.2014.6867976
Fieremans, E., De Deene, Y., Delputte, S., Özdemir, M. S., D’Asseler, Y., Vlassenbroeck, J., et al. (2008). Simulation and experimental verification of the diffusion in an anisotropic fiber phantom.J. Magn. Reson.190, 189–199. doi: 10.1016/j.jmr.2007.10.014
Fillard, P., Descoteaux, M., Goh, A., Gouttard, S., Jeurissen, B., Malcolm, J., et al. (2011). Quantitative evaluation of 10 tractography algorithms on a realistic diffusion MR phantom. Neuroimage 56, 220–234. doi: 10.1016/j.neuroimage.2011.01.032
Garyfallidis, E., Brett, M., Amirbekian, B., Rokem, A., van der Walt, S., Descoteaux, M., et al. (2014). Dipy, a library for the analysis of diffusion MRI data.Front. Neuroinform.8:8. doi: 10.3389/fninf.2014.00008
Glasser, M. F., Sotiropoulos, S. N., Wilson, J. A., Coalson, T. S., Fischl, B., Andersson, J. L., et al. (2013). The minimal preprocessing pipelines for the Human Connectome Project. Neuroimage 80, 105–124. doi: 10.1016/j.neuroimage.2013.04.127
Golby, A. J., Kindlmann, G., Norton, I., Yarmarkovich, A., Pieper, S., and Kikinis, R. (2011). Interactive diffusion tensor tractography visualization for neurosurgical planning.Neurosurgery68, 496–505. doi: 10.1227/NEU.0b013e3182061ebb Gorgolewski, K., Burns, C. D., Madison, C., Clark, D., Halchenko, Y. O.,
Waskom, M. L., et al. (2011). Nipype: a flexible, lightweight and extensible neuroimaging data processing framework in python.Front. Neuroinform.5:13. doi: 10.3389/fninf.2011.00013
Gorgolewski, K. J., Poline, J.-B., Keator, D. B., Nichols, B. N., Auer, T., Craddock, R. C., et al. (2015). “Brain imaging data structure - a new standard for describing and organizing human neuroimaging data,” inINCF Neuroinformatics 2015
(Cairns, QLD). doi: 10.3389/conf.fnins.2015.91.00056
Griffa, A., Baumann, P. S., Thiran, J.-P., and Hagmann, P. (2013). Structural connectomics in brain diseases. Neuroimage 80, 515–526. doi: 10.1016/j.neuroimage.2013.04.056
Gössl, C., Fahrmeir, L., Pütz, B., Auer, L. M., and Auer, D. P. (2002). Fiber tracking from DTI using linear state space models: detectability of the pyramidal tract.
Neuroimage16, 378–388. doi: 10.1006/nimg.2002.1055
Jbabdi, S., Sotiropoulos, S. N., Savio, A. M., Graña, M., and Behrens, T. E. J. (2012). Model-based analysis of multishell diffusion MR data for tractography: how to get over fitting problems.Magn. Reson. Med.68, 1846–1855. doi: 10.1002/mrm.24204
Jenkinson, M., Beckmann, C. F., Behrens, T. E., Woolrich, M. W., and Smith, S. M. (2012). FSL.Neuroimage62, 782–790. doi: 10.1016/j.neuroimage.2011.09.015 Kaus, M. R., Nabavi, A., Mamisch, C. T., Wells, W. H., Jolesz, F. A., Kikinis, R., et al.
(2000). “Simulation of corticospinal tract displacement in patients with brain tumors,” inMedical Image Computing and Computer-Assisted Intervention ˝U MICCAI 2000(Pittsburgh, PA), 9–18. doi: 10.1007/978-3-540-40899-4_2 Leemans, A., Sijbers, J., Verhoye, M., Van der Linden, A., and Van Dyck, D.
(2005). Mathematical framework for simulating diffusion tensor MR neural fiber bundles.Magn. Reson. Med.53, 944–953. doi: 10.1002/mrm.20418 Lin, C.-P., Tseng, W.-Y. I., Cheng, H.-C., and Chen, J.-H. (2001). Validation of
diffusion tensor magnetic resonance axonal fiber imaging with registered manganese-enhanced optic tracts. Neuroimage 14, 1035–1047. doi: 10.1006/nimg.2001.0882
Messé, A., Rudrauf, D., Giron, A., and Marrelec, G. (2015). Predicting functional connectivity from structural connectivity via computational models using MRI: An extensive comparison study. Neuroimage111, 65–74. doi: 10.1016/j.neuroimage.2015.02.001
Neher, P. F., Laun, F. B., Stieltjes, B., and Maier-Hein, K. H. (2014). “Fiberfox: an extensible system for generating realistic white matter software phantoms,” inComputational Diffusion MRI and Brain Connectivity(Nagoya: Springer), 105–113. doi: 10.1007/978-3-319-02475-2_10
Perrin, M., Poupon, C., Rieul, B., Leroux, P., Constantinesco, A., Mangin, J.-F., et al. (2005). Validation of q-ball imaging with a diffusion fibre-crossing phantom on a clinical scanner. Philos. T. R. Soc. B. 360, 881–891. doi: 10.1098/rstb.2005.1650
Poupon, C., Rieul, B., Kezele, I., Perrin, M., Poupon, F., and Mangin, J.-F. (2008). New diffusion phantoms dedicated to the study and validation of high-angular-resolution diffusion imaging (HARDI) models.Magn. Reson. Med.60, 1276–1283. doi: 10.1002/mrm.21789
Sporns, O., Tononi, G., and Kötter, R. (2005). The human connectome: a structural description of the human brain. PLoS Comput. Biol.1:e42. doi: 10.1371/journal.pcbi.0010042
Toda, K., Baba, H., Ono, T., and Ono, K. (2014). The utility of diffusion tensor imaging tractography for post-operative evaluation of a patient with hemispherotomy performed for intractable epilepsy.Brain Dev.36, 641–644. doi: 10.1016/j.braindev.2013.08.001
Tournier, J.-D., Calamante, F., and Connelly, A. (2012). MRtrix: diffusion tractography in crossing fiber regions.Int. J. Imag. Syst. Tech.22, 53–66. doi: 10.1002/ima.22005
Tournier, J.-D., Calamante, F., King, M. D., Gadian, D. G., and Connelly, A. (2002). Limitations and requirements of diffusion tensor fiber tracking: an assessment using simulations.Magn. Reson. Med.47, 701–708. doi: 10.1002/mrm.10116 Tournier, J. D., Yeh, C.-H., Calamante, F., Cho, K.-H., Connelly, A., and Lin, C.-P.
(2008). Resolving crossing fibres using constrained spherical deconvolution: validation using diffusion-weighted imaging phantom data.Neuroimage42, 617–625. doi: 10.1016/j.neuroimage.2008.05.002
Tuch, D. S., Reese, T. G., Wiegell, M. R., Makris, N., Belliveau, J. W., and Wedeen, V. J. (2002). High angular resolution diffusion imaging reveals intravoxel white matter fiber heterogeneity.Magn. Reson. Med.48, 577–582. doi: 10.1002/mrm.10268
Van Essen, D. C., Ugurbil, K., Auerbach, E., Barch, D., Behrens, T. E., Bucholz, R., et al. (2012). The human connectome project: a data acquisition perspective.
Neuroimage62, 2222–2231. doi: 10.1016/j.neuroimage.2012.02.018
Wassermann, D., Makris, N., Rathi, Y., Shenton, M., Kikinis, R., Kubicki, M., et al. (2013). “On describing human white matter anatomy: the white matter query language,” in16th MICCAI, LNCS 8149 (Nagoya), 647–654.
Wilkins, B., Lee, N., Gajawelli, N., Law, M., and Leporé, N. (2015). Fiber estimation and tractography in diffusion MRI: Development of simulated brain images and comparison of multi-fiber analysis methods at clinical b-values.Neuroimage
109, 341–356. doi: 10.1016/j.neuroimage.2014.12.060
Conflict of Interest Statement: The authors declare that the research was
conducted in the absence of any commercial or financial relationships that could be construed as a potential conflict of interest.
Copyright © 2016 Esteban, Caruyer, Daducci, Bach-Cuadra, Ledesma-Carbayo and Santos. This is an open-access article distributed under the terms of the Creative Commons Attribution License (CC BY). The use, distribution or reproduction in other forums is permitted, provided the original author(s) or licensor are credited and that the original publication in this journal is cited, in accordance with accepted academic practice. No use, distribution or reproduction is permitted which does not comply with these terms.