The Effect of Differing Shaft Dynamics
on the Biomechanics of the Golf Swing
Nils Florian Betzler
A thesis submitted in
partial fulfilment of the requirements of
Edinburgh Napier University,
for the award of
Doctor of Philosophy
Abstract
The role of the shaft in the golf swing has been the subject of scientific debate for many years but there is little consensus regarding the effects of altering shaft bending stiffness. The aim of this thesis was to determine and explain the effects of changes in shaft stiffness on body kinematics, shaft strain and key performance indicators including club head speed, impact location on the club face and launch conditions. For this purpose, three clubs matched in all properties but shaft bending stiffness (l-flex (217 cpm), r-flex (245 cpm) and x-flex (272 cpm)) were instrumented with strain gauges. In an initial study, seventeen male golfers (handicap 1.8 ±1.9) tested these clubs, but no shaft effects on body kinematics, club head speed and ball launch conditions were identified. A follow-up study involved twenty skilled players (handicap 0.3 ±1.7), testing only the l- and x-flex clubs. Two optical motion capture systems were used to determine wrist angular kinematics, club head presentation and the ball‟s impact location on the club face. There was an effect of shaft stiffness on ball and club head speed, both of which increased by 0.7 % for the l-flex club (p
= 0.008 and < 0.001, respectively). Two factors contributed to these increases: (i) a faster recovery of the l-flex shaft from lag to lead bending just before impact (p < 0.001); (ii) an increase of 0.5 % in angular velocity of the grip of the l-flex club at impact (p = 0.005). A difference in angular wrist kinematics between the two clubs was identified for two swing events and may have contributed to the increase in angular velocity. The face angle (p = 0.176) and the ball‟s impact
location (p = 0.907 and p = 0.774) were unaffected by changes in shaft stiffness. Decreases in shaft stiffness were associated with significantly more shaft bending at the transition from backswing to downswing (p < 0.001), but the amount of lead bending at impact was found to be largely unaffected by shaft stiffness. The test protocol from the follow-up study was repeated using a golf robot, confirming the results for ball speed and wrist kinematics if the impact speed was set to replicate the mean club head speed achieved by the human players. Results from this thesis contradict the conventional view that reducing shaft stiffness leads to an increase in lead bending at impact and, consequently, to an increase in ball launch angle. Overall, these results suggest that it is unlikely that changes in overall shaft stiffness in themselves have a marked
Table of contents
Acknowledgements ... vi
Nomenclature ... vii
Research communications ...viii
List of figures... ix
List of tables ... xv
List of appendices ... xviii
1
Introduction ... 1
1.0 Research background ... 1
1.1 Thesis outline ... 2
2
Literature review... 4
2.0 Introduction ... 4
2.1 Scope and structure ... 4
2.2 Behaviour of the shaft during a typical golf swing ... 5
2.3 Mechanical properties of the golf shaft ... 10
2.3.1 Manufacturing process ... 10
2.3.2 Material properties of graphite shafts ... 14
2.3.3 Geometry ... 15
2.3.4 Mass and Density ... 16
2.3.5 Length ... 17
2.3.6 Bend point position ... 18
2.3.7 Bending stiffness / Flexural rigidity ... 19
2.4 Characterising shaft properties – shaft tests ... 23
2.4.1 Mechanical Tests ... 23
2.4.2 Robot Tests ... 26
2.4.3 Human Tests ... 29
2.4.4 Boundary conditions in shaft tests ... 30
2.5 Modelling the golf swing ... 33
2.5.1 Two-dimensional models of the swing ... 34
2.5.2 Three-dimensional models of the swing ... 38
2.6 Shaft properties and swing performance ... 43
2.6.1 Shaft mass and club head velocity at impact ... 43
2.6.2 Shaft length and club head velocity at impact ... 44
2.6.3 Bending stiffness and club head velocity at impact ... 46
2.6.4 Bending stiffness and dynamic loft ... 49
2.6.5 Torsional stiffness and dynamic face angle ... 51
2.6.6 Influence of body motion on shaft deflection ... 52
2.6.7 Adaptations of players to shaft stiffness variations ... 56
2.7 Summary of literature review and conclusions ... 56
3
Aim and objectives ... 59
4
Methodological issues ... 60
4.0 Introduction ... 60
4.1 Study design considerations ... 60
4.1.1 Experimental vs. simulation studies ... 61
4.1.2 General study design ... 62
4.1.3 Population and sample selection ... 65
4.1.4 Boundary conditions ... 66
4.1.5 Variability, sample size and number of trials ... 67
4.1.6 Selection of representative swings and treatment of outliers ... 69
4.2 Selection of test clubs and balls ... 70
4.2.1 Shaft ... 71
4.2.2 Club head ... 74
4.2.3 Grip ... 74
4.3 Club instrumentation ... 75
4.4 Strain processing ... 77
4.4.1 Calibration ... 77
4.4.2 Reduction of the strain data ... 80
4.5 Measurement of body movement ... 81
4.5.1 Basic principles of optical three-dimensional motion capture ... 82
4.5.2 Camera set-up and validation ... 86
4.5.3 Marker set, body model and calculation of joint angles ... 88
4.6 Measurement of club head presentation and launch conditions . 89 4.6.1 Comparison of commercial measurement devices ... 90
4.6.2 Development of a custom club head tracking system ... 92
4.6.3 Validation of a custom club head tracking system ... 98
5
Effect of shaft bending stiffness on human joint kinematics,
shaft bending and launch conditions ...103
5.0 Introduction ... 103
5.1 Methods ... 104
5.1.1 Data collection ... 104
5.1.2 Calculation of angular joint displacements ... 106
5.1.3 Event detection ... 111
5.1.4 Statistical analysis ... 111
5.2 Results ... 112
5.2.1 Assumptions of MANOVA ... 112
5.2.2 Tests for within-player reliability... 114
5.2.3 Shaft effects ... 117
5.3 Discussion ... 125
5.3.1 Within-player reliability ... 125
5.3.2 Effect of shaft stiffness on launch conditions ... 126
5.3.3 Effect of shaft stiffness on shaft loading ... 127
5.3.4 Effect of shaft stiffness on body kinematics ... 129
6
Effect of shaft bending stiffness on club head presentation,
wrist kinematics and shaft bending in human swings ...131
6.1 Introduction ... 131 6.2 Methods ... 132 6.2.1 Data collection ... 132 6.2.2 Kinematic variables ... 135 6.2.3 Event detection ... 139 6.2.4 Statistical analysis ... 140 6.3 Results ... 141
6.3.1 Assumptions for the statistical analysis ... 141
6.3.2 Within-player consistency ... 142
6.3.3 Shaft effects ... 145
6.4 Discussion ... 158
6.4.1 Within-player consistency ... 158
6.4.2 Club head presentation ... 158
6.4.3 Club head speed generated from shaft recovery ... 159
6.4.4 Strain ... 161
6.4.5 Body movement... 161
6.5 Summary ... 164
7
Effect of shaft bending stiffness in robot swings ...166
7.0 Introduction ... 166
7.1 Methods ... 167
7.1.1 Data collection ... 167
7.1.2 Robot settings... 168
7.1.3 Calculation of joint angles ... 170
7.1.4 Event detection ... 171
7.2 Results ... 172
7.2.1 Comparison of human and robotic swing characteristics ... 172
7.2.2 Strain ... 174
7.2.3 Angular kinematics ... 175
7.2.4 Impact location ... 176
7.3 Discussion ... 181
7.3.1 Comparison of human and robotic swing characteristics ... 181
7.3.2 Strain ... 181
7.3.3 Wrist kinematics ... 182
7.3.4 Impact location ... 182
7.3.5 Launch data ... 183
7.4 Summary ... 184
8
Summary, conclusions and future research ...186
8.0 Research overview ... 186
8.1 Summary ... 186
8.1.1 Launch conditions and club presentation (Research question 1) 186 8.1.2 Shaft loading (Research question 2) ... 187
8.1.3 Body movement (Research question 3) ... 188
8.2 Limitations and suggestions for future research ... 189
8.3 Practical implications ... 190
8.4 Conclusions ... 191
Appendix ...193
Acknowledgements
I would like to thank my supervisors, Dr. Geraint Florida-James and Prof. Eric Wallace, for their support and guidance. I would also like to thank Dr. Steve Otto, Dr. Stuart Monk and Dr. Andrew Johnson for their valuable advice and help and Dr. Martin Strangwood, James Gordon and Carl Slater for their support with conducting some of the tests presented and Dr. Sandra Bonellie for her help with the statistical analysis.
I am very grateful for my wife Heike‟s support and understanding throughout the past three years.
I would like to acknowledge the funding received from R&A Rules Ltd. and the Edinburgh Napier University Knowledge Transfer Fund.
Nomenclature
ANN Artificial neural network ANOVA Analysis of variance
BASES British Association of Sport and Exercise Sciences CFRP Carbon fibre reinforced polymer
COG Centre of gravity COV Coefficient of variation
cpm Cycles per minute
FE Finite element
ISB International Society of Biomechanics MANOVA Multivariate analysis of variance MOI Moment of inertia
RMS Root mean square
SD Standard deviation
TA Take-away event
TOB Top of backswing event
Research communications
Journal paper
Betzler, N., Monk, S., Wallace, E., Otto, S. R., & Shan, G. (2008). From the double pendulum model to full-body simulation: evolution of golf swing modeling. Sports Technology, 1(4-5), 175-188.
Conference papers
Betzler, N., Brown, S., Wallace, E. S., Otto, S. R., & Shan, G. (2008). Effect of 6-iron club properties on thorax and pelvis rotation at key events of the golf swing. In D. J. Crews & R. Lutz (Eds.), Science and Golf V (pp. 455-461). Mesa, Arizona: Energy in Motion Inc.
Betzler, N., Slater, C., Strangwood, M., Wallace, E. S., & Otto, S. R. (2009). The static and dynamic behaviour of carbon fibre composites used in golf club shafts. Paper presented at the International Conference on Composite Materials, 27th-31th July 2009, Edinburgh.
List of figures
Figure 1: Shaft behaviour during a typical golf swing: (a) simulation of shaft bending according to Milne & Davis‟ (1992) measurements (bending exaggerated by a factor of 5) (adapted from Penner, 2003, p. 158); (b) bending of the shaft during a typical golf swing (adapted from Newman, Clay, & Strickland, 1997, p. 369). ... 6 Figure 2: Definition of bending planes and suggested reasons for bending (adapted from Horwood, 1994, p. 249 and 251). ... 7 Figure 3: Lay-up process for sheet-laminated shafts (adapted from Cheong, Kang, & Jeong, 2006, p. 465). ... 12 Figure 4: (a) Typical composition of a sheet-laminated shaft from a number of layers of carbon/epoxy pre-pregs (adapted from Cheong, Kang, & Jeong, 2006, p. 469). (b) Resulting lay-up of carbon/epoxy layers. Fibres of the inner layer are typically oriented at ±45°, fibres of the outer layer at 0° (adapted from Huntley, 2007, p. 140). ... 13 Figure 5: Stress(σ)-strain(ε) graphs for composites loaded at different strain rates: (a) based on micromechanical modelling (Zhu, Chattopadhyay, & Goldberg, 2006, p. 1810); (b) based on experimental results (Fereshteh-Saniee, Majzoobi, & Bahrami, 2005, p. 46). ... 15 Figure 6: Typical shaft geometry (cross section). Shaft diameter is exaggerated relative to length for clarity (based on data presented in Huntley, 2007). ... 15 Figure 7: Definition of club length (adapted from The R&A, 2008) ... 17 Figure 8: Stiffness profiles for four different golf shafts before and after applying a correction for measurement errors. It can be seen that
each shaft has characteristic stiffness variations between tip and butt end (adapted from Mase, 2004, p. 520). ... 20 Figure 9: Four static shaft tests (adapted from Howell, 1992, p. 1395). ... 24 Figure 10: Commercial shaft test equipment. (a) Deflection board (Maltby Design, USA), (b) Frequency analyser (Golfsmith, USA), (c) Torsion test (Golfmechanix, Taiwan ROC). ... 25 Figure 11: Commercial golf robots: (a) Iron Byron (True Temper, 2004), (b) Miyamae 5 (Miyamae, 2007), (c) Golflabs robot (Golflabs, 2007). . 27 Figure 12: Approaches commonly used in golf swing modelling and simulation (adapted from Betzler, Monk, Wallace, Otto, & Shan, 2008). ... 34 Figure 13: Double-pendulum model of the golf swing (adapted from Cochran & Stobbs, 1968). ... 35 Figure 14: Expected effect of shaft stiffness distribution on launch angle (adapted from Maltby, 1995, p. 416). ... 49 Figure 15: Expected effect of shaft stiffness on launch angle (adapted from Maltby, 1995, p. 414). ... 50 Figure 16: Three different shaft deflection profiles. „One-peak‟ (top),
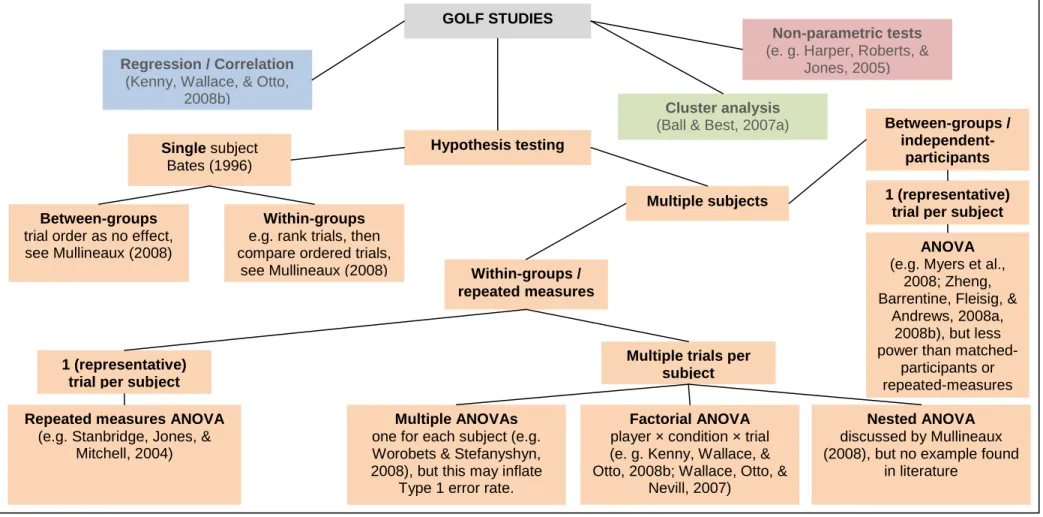
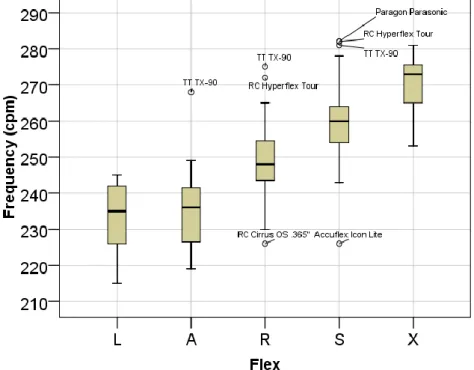
„double-peak‟ (middle) and „ramp-like‟ (bottom) (mod. from Butler & Winfield, 1994, pp. 261-262). Positive values correspond to toe-up, lead and face-close deflection, negative values to toe-down, lag and face-open deflection. ... 53 Figure 17: Overview of study designs and statistical methods employed in previous studies. ... 63 Figure 18: Boxplot showing driver shaft frequency ranges for different flex codes (based on data for 300 driver shafts presented by Summitt, 2000) ... 71 Figure 19: Set-up of frequency test. ... 72
Figure 20: Set-up of rigidity test. ... 73
Figure 21: Assembled test clubs. ... 75
Figure 22: Club instrumentation and coordinate system... 76
Figure 23: Reference system and nomenclature for strain measurements. .... 76
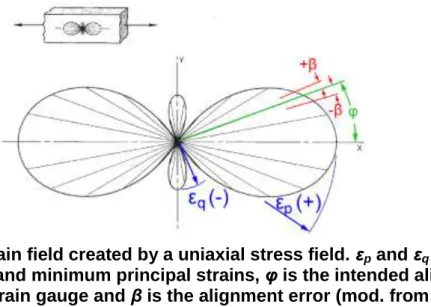
Figure 24: Strain field created by a uniaxial stress field. εp and εq denote the maximum and minimum principal strains, φ is the intended alignment angle of the strain gauge and β is the alignment error (mod. from Vishay, 2007). ... 78
Figure 25: (a) Example results from strain gauge calibration. (b) Shaft cross section with nomenclature for calibration procedure. ... 79
Figure 26: Definition of characteristic downswing strain parameters. ... 80
Figure 27: Setup of custom club head tracking system (cameras: -)... 95
Figure 28: Definition of face plane and distance to offset ball maker. ... 96
Figure 29: Example for results from the extrapolation algorithm. ... 97
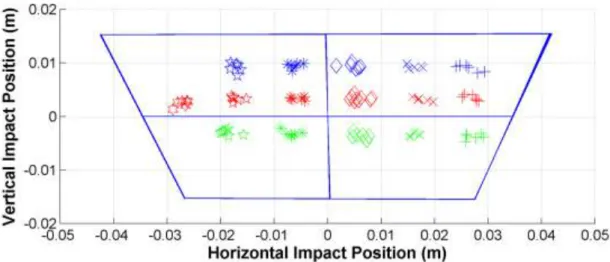
Figure 30: Face mapping results. The rows of grid points (blue, red, green) were separated by 6 mm, columns by 11 mm. ... 99
Figure 31: Set-up for player testing (cameras: -). ... 106
Figure 32: Placement of (a) posterior and (b) anterior markers. ... 107
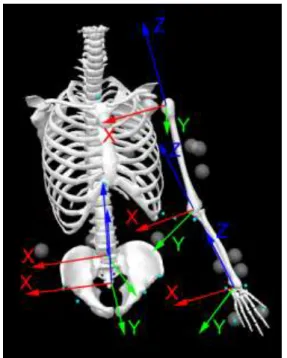
Figure 33: Definition of segment coordinate systems. For each segment, the x-axis points medially, the y-x-axis frontally and the z-x-axis proximally when the player is in the anatomical position. ... 108
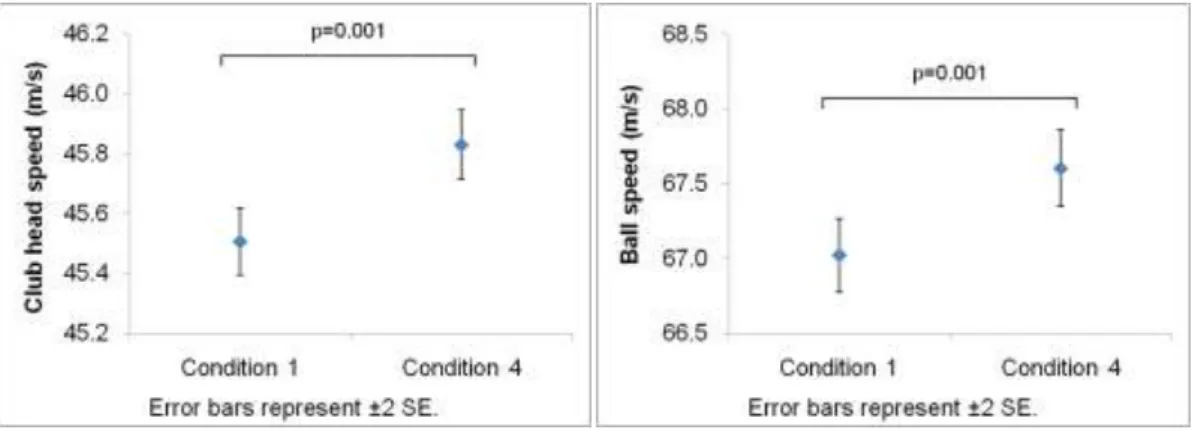
Figure 34: Estimated marginal means for club head and ball speed (controlling for player variation). ... 116
Figure 35: Estimated marginal means for different shaft conditions for the variables club head and ball speed, launch angle and side angle. ... 120 Figure 36: Mean strain patterns in lead/lag direction (a) and toe up/down direction (b). Lines represent mean strain for all subjects for the l-flex (pink), r-l-flex (yellow) and x-stiff (blue) shaft. Shaded areas indicate ±1 SD. ... 121 Figure 37: Estimated marginal means for strain variables. ... 123 Figure 38: Test set-up. Numbers in black circles denote positions of the body motion capture system, numbers in red circles denote cameras pertaining to the impact location motion capture system. ... 135 Figure 39: Club face reference system for reported impact coordinates. ... 136 Figure 40: Definition of four-point wrist angle and position of virtual offset marker placed at tip end of shaft. ... 138 Figure 41: Planar projection of the club path to determine grip angle and angular velocity at impact. ... 139 Figure 42: Events used in Study 2. ... 140 Figure 43: Estimated marginal means for club head speed for swings performed as part of the first and second set of swings. ... 144 Figure 44: Typical example for impact positions recorded for one player. Club number (1) and (2) refer to the first and second data set recorded. ... 147 Figure 45: Estimated marginal means plot for club head speed at impact and ball speed. ... 148 Figure 46: Estimated marginal mean speed for the hosel marker as measured directly with the motion capture system and as calculated for a virtual marker. ... 150
Figure 47: Interaction of speed difference and shaft stiffness factors. ... 150 Figure 48: Typical strain patterns (all swings shown were performed by one player). The transition from backswing to downswing is marked with a symbol. ... 151 Figure 49: Estimated marginal means for strain variables. ... 153 Figure 50: Estimated marginal means for planar wrist angle at the grip-vertical and the grip-horizontal events. ... 155 Figure 51: Example for wrist angle joint history for one subject. For clarity, wrist angle is plotted as a function of global arm angle rather than time (see Figure 40 for angle definitions). Shaded areas indicate ±1 SD. ... 156 Figure 52: Estimated marginal means for the planar club angle and angular velocity. This angle was calculated after projecting the longitudinal axis of the grip on the x-plane (vertical) and is relative to the z-axis. ... 157 Figure 53: Setup for robot testing. - denote motion capture cameras. .... 168 Figure 54: Control settings of the robot (based on Golflabs, 2007). ... 169 Figure 55: Definition of shoulder and wrist angle for the golf robot. The z-axis of the global coordinate system runs perpendicular to the arm. ... 171 Figure 56: Events used when analysing kinematic data. ... 172 Figure 57: Comparison of human and robotic shaft loading for two clubs with identical stiffness ratings (x-flex). Stick figures indicate the time of the transition from backswing to downswing and impact for the human player. ... 173 Figure 58: Strain patterns recorded for robot swings performed with an impact speed of approximately 45 m/s. Symbols indicate wrist release ()
and grip-horizontal event ().Club numbers (1) and (2) refer to the first and second club replicate, respectively, ... 174 Figure 59: Strain patterns recorded for robot swings performed with an impact speed of approximately 50 m/s. See previous figure for details. .. 174 Figure 60: Wrist angle as a function of arm angle for swings with a club head speed of 45 m/s (a) and 50 m/s (b). Plot shows a mean curve for all recorded swings. Standard deviations are shown as shaded areas but are barely visible due to the consistency of the robot. Vertical lines indicate swing events as defined in Section 7.1.4. ... 176 Figure 61: Impact positions for different shaft conditions for impact speeds of approximately 45 m/s (left) and 50 m/s (right). Club numbers (1) and (2) refer to the first and second club replicate, respectively. ... 177 Figure 62: Ball speeds measured for club head speeds of 45 m/s (a) and 50 m/s (b). Shaft pairs with significant differences are marked with „*‟. Dots indicate outliers (only present in the l-flex data sets). ... 178 Figure 63: Launch angles measured for club head speeds of 45 m/s (a) and 50 m/s (b). Shaft pairs with significant differences are marked with „*‟. ... 179 Figure 64: Spin rates measured for club head speeds of 45 m/s (a) and 50 m/s (b). Shaft pairs with significant differences are marked with „*‟. .... 179
List of tables
Table 1: Summary of previous research into shaft deflection patterns. ... 9 Table 2: Mass ranges of golf shafts (adapted from Lee and Kim, 2004). ... 16 Table 3: Comparison of shaft frequency of a graphite shaft measured under different boundary conditions (adapted from Wicks, Knight, Braunwart, & Neighbors, 1999). ... 32 Table 4: Summary of two-dimensional golf models (adapted from Betzler, Monk, Wallace, Otto, & Shan, 2008) ... 37 Table 5: Summary of three-dimensional models of the golf swing (adapted from Betzler, Monk, Wallace, Otto, & Shan, 2008) ... 39 Table 6: Summary of previous study designs, in order of number of participants. ... 65 Table 7: Properties of selected shafts and assembled clubs. ... 73 Table 8: Club head properties. ... 74 Table 9: Average residuals, accuracy and precision result for the different motion capture systems and set-ups used throughout this thesis. . 88 Table 10: Launch monitor systems used in validation tests and studies ... 89 Table 11: Results from comparison of launch monitors 1 and 2. The RMS error quantifies the magnitude of the discrepancies between the two systems. SD is a measure of the precision of measurements taken with system 2 from repeated robot swings. ... 92 Table 12: Numerical results from impact location measurement validation. ... 99 Table 13: Results from club head speed validation. ... 101 Table 14: Mean characteristics of participants (±SD). ... 105
Table 15: Order of test conditions. ... 105
Table 16: Descriptive statistics (mean ±SD) summarising the launch data from the first and last set of swings recorded for each subject (performed with identical clubs). ... 115
Table 17: ANOVA results for launch variables comparing data collected for the first and last set of swings recorded for each subject. ... 115
Table 18: Descriptive statistics (mean ±SD) for launch variables. ... 119
Table 19: ANOVA results for launch variables. ... 119
Table 20: Descriptive statistics (mean ±SD) for strain variables. ... 122
Table 21: ANOVA results for strain data. ... 122
Table 22: Descriptive statistics (mean ±SD) for selected angular displacements. ... 124
Table 23: ANOVA results for selected body kinematics. ... 125
Table 24: Mean characteristics of participants (±SD) ... 133
Table 25: Example for the use of the independent variable „set‟ that was introduced for the within-player consistency analysis. ... 143
Table 26: Descriptive statistics summarising club head speeds recorded for the first and second set of swings (mean ±SD). ... 143
Table 27: ANOVA results for reliability analysis that was performed to check for consistency in club head speed throughout the course of the test sessions. ... 144
Table 28: Descriptive statistics (mean ±SD) for club head presentation. ... 146
Table 29: ANOVA results for club presentation variables... 146
Table 30: Descriptive statistics for hosel speed at impact (mean ±SD) as measured directly and as calculated based on a virtual marker. .. 148
Table 31: Mixed model ANOVA results. ... 149 Table 32: Descriptive statistics for strain variables (mean ±SD). ... 151 Table 33: ANOVA results for strain variables. ... 152 Table 34: Descriptive statistics for a simplified four-point wrist angle at four downswing events. ... 153 Table 35: ANOVA results for the angle formed between the longitudinal axes of the forearm and the grip segment at four events. ... 154 Table 36: Orientation and angular velocity of the grip section of the club at impact. ... 157 Table 37: ANOVA results for the orientation of the longitudinal axis of the grip of the test clubs. ... 157 Table 38: Swing speed conditions and robot settings. ... 170 Table 39: Results from pair-wise comparisons using Mann-Whitney tests. Bonferroni correction was applied to account for multiple comparisons. ... 180 Table 40: Variation between conditions where significant differences were found as percentages between mean values. ... 180
List of appendices
A.
Mechanical club head properties ...193
A.1 Role of the club head ... 193
A.2 Materials and construction ... 193
A.2.1 Woods ... 193
A.2.2 Irons ... 195
A.3 Club head mass ... 196
A.4 Geometry ... 198
A.4.1 Loft Angle – static and dynamic loft ... 199
A.4.2 Lie Angle ... 199
A.4.3 Face Angle ... 200
A.4.4 Horizontal Face Curvature ... 200
A.5 Position of the centre of gravity of the club head (COG) ... 201
A.6 Moment of inertia (MOI) ... 202
B.
Launch monitor validation ...203
B.1 Comparison between Device 1 and 2 ... 203
B.2 Comparison between Device 1 and 3 ... 204
C.
Derivation of finite difference equation for non-uniform step
size ...205
D.
Information sheet and consent form...208
D.1 Information sheet... 208
D.2 Consent form ... 210
E.
Definitions of local coordinate systems used in Study 1 ..211
F.
Results for pair-wise comparisons in Study 1 ...213
F.1 Launch conditions ... 213
F.2 Strain ... 213
H.
Impact location results Study 2 ...220
1 Introduction
1.0 Research background
“There has been much modelling and computer simulation of the golf swing, recording of data from instrumented clubs, attempts to quantify or categorize subjective impressions and other studies of components of the swing, yet understanding of the golfer‟s interaction with the club is still too crude to fit clubs to people properly.” (Farrally et al., 2003, p. 756)
This quotation, taken from a review of scientific golf literature, highlights a problem that is not uncommon in research disciplines other than biomechanics: sophisticated analyses and simulations help understanding and optimising the technical aspect of equipment, but often human factors cannot be included in this process. This leaves the question of whether possible reactions of the human to changes in the equipment may invalidate the boundary conditions that were assumed in the isolated analysis and optimisation of the equipment. In case of the golf swing, various equipment factors have been subject to scientific analysis and debate. Examples include the golf ball (e.g. Smits & Ogg, 2004a), the face of the club head (e.g. Winfield & Tan, 1996) and the shaft (e.g. Milne & Davis, 1992). Yet, knowledge of how changes in any of these equipment properties affect the reaction of the player is often limited (Farrally et al., 2003), and it has been suggested that golf research should take a more holistic approach (Dillman & Lange, 1994). Based on this, the general scope of this thesis is an evaluation of equipment effects that considers human factors as well as mechanical behaviour. As humans interact with implements in many other situations in sport and in daily life, the opportunity exists to contribute to knowledge outside golf research through an improvement in the understanding of the interaction between human and golf club.
Most relevant for the majority of golfers may be the question of whether a particular piece of equipment has the potential to help them perform better. This thesis therefore focuses on the reaction of human players to changes in golf shaft stiffness. When a golf swing is performed, the player accelerates and attempts to control the club head that impacts the ball and determines the ball‟s
initial launch conditions thus playing the major role in its trajectory. The player and the club head are linked by the golf shaft, which is a relatively flexible structure. The shaft‟s role in the golf swing and its effect on performance have been debated by a number of previous authors, often with conflicting results. On the subject of whether shafts need to be tested dynamically, for example, conclusions range from “the principal effect of flexibility ... could be estimated from static considerations” (Milne & Davis, 1992, p. 979) to “dynamic testing appears to be necessary, perhaps even essential“ (Mather, Smith, Jowett, Gibson, & Moynihan, 2000, p. 46).
Modern shaft materials and construction provide manufacturers with almost limitless control over many of the shaft properties. Yet, it is only possible to make use of this potential if the effect of changes in mechanical parameters and the reaction of human players are known. It is the purpose of this thesis to enhance understanding of the golf shaft both in terms of performance and the underlying mechanisms that may lead to performance effects.
1.1 Thesis outline
The thesis is organised in eight chapters consisting of a literature review (Chapter 2), a statement of the aims and objectives (Chapter 3), a discussion of methodological issues (Chapter 4), three experimental studies (Chapters 5 – 7) and conclusions (Chapter 8).
Chapter 2 aims to present a summary of the current state of shaft research in order to identify areas in which further research is needed. It describes the main mechanical properties of the golf shaft and discusses methods to characterise and simulate their effect. This is followed by a summary of the current state of research into the relationship of these mechanical properties with performance variables. The chapter concludes with the identification of key areas where more research is required and is followed by a definition of more specific aims for this thesis (Chapter 3).
Chapter 4 discusses the methodological aspects of this thesis in more detail, beginning with study design considerations. This is followed by a description of
how the components of the golf clubs that were custom-assembled for the experimental studies were selected, and how these clubs were instrumented. Conducting the experimental studies required the development and validation of a number of non-standard methods for data collection and processing. These are described in the remaining sections of Chapter 4 to avoid repetition of details in later chapters.
The main part of this thesis reports three experimental studies, presented in chronological order. The first study is presented in Chapter 5 and will be referred to as Study 1 throughout this thesis. It had the more general aim of determining whether there were any effects related to shaft stiffness on body movement, shaft loading and ball launch conditions. Results of Study 1 allowed the formulation of more specific hypotheses, which are tested in Study 2 (Chapter 6). Rather than looking at the angular displacement of various body joints, Study 2 focused on wrist kinematics. Furthermore, shaft loading was studied in more detail, including an analysis of the shaft behaviour during the last milliseconds before impact and its effects on club head velocity at impact. Study 2 also applied a novel approach for determining the impact location of the ball on the club face. Following this, a golf robot was used in the third experimental study (Chapter 7) to analyse shaft effects in isolation from a human player, thereby removing any potential active adaptations that may be performed by human players to adjust their swing to changes in shaft stiffness. Finally, Chapter 8 summarises the conclusions from the three research studies, draws general conclusions and provides suggestions for future research emerging from the work presented in this thesis.
2 Literature review
2.0 Introduction
The purpose of this chapter is to define all relevant mechanical shaft properties and critically review published scientific studies that have examined the effect of shaft properties on swing performance. No attempt is made to summarise the vast amount of information available concerning the body motion of the golfer, as this aspect has been recently reviewed elsewhere (Hume, Keogh, & Reid, 2005). Instead, limitations imposed on human tests of shaft performance will be reviewed along with the roles and contributions of biomechanical modelling techniques. Whilst the club head is not part of the golf shaft, it is commonly accepted that its properties have a significant influence on shaft behaviour (Mather & Jowett, 2000). Therefore, Appendix A (p. 193) outlines the most important mechanical properties of driver club heads for reference.
2.1 Scope and structure
The literature review begins with descriptive information characterising typical shaft deflection patterns for human swings with a view to providing a basic understanding of the factors involved. Following on from this, mechanical shaft properties and shaft tests are described in detail, with a focus on the strength and weaknesses of the methods currently used in practice. A full understanding of the mechanical structures involved is deemed an important basis for biomechanical analysis. Following the discussion of experimental techniques used in shaft research, modelling and simulation methods are covered, in order to show potential methods that may be used in the course of this thesis. The final section of the literature review highlights the limitations of the current understanding of relationships between mechanical shaft properties and golf performance. At the end of this section, the case is made for shaft stiffness forming the main study of this thesis.
During the search for literature, all relevant international, peer-reviewed journals in English language that are indexed in the SportDiscus, ISI Web of Knowledge,
were searched using keywords such as „golf‟ and „shaft‟. Additionally, citations were followed up when they appeared to be relevant to the topic of golf biomechanics and shaft mechanics. It was found that there were also a number of monographs that provided valuable information on the topic (Cochran & Stobbs, 1968; Jørgensen, 1999; Maltby, 1995; Werner & Greig, 2000). Additional sources of information were the „Science and Golf‟ and „Engineering of Sports‟ conference proceedings (Cochran, 1990; Cochran & Farrally, 1994; Crews & Lutz, 2008; Farrally & Cochran, 1999; Haake, 1996, 1998; Hubbard, Mehta, & Pallis, 2004; Moritz & Haake, 2006; Subic & Haake, 2000; Thain, 2002; Ujihashi & Haake, 2002). A number of relevant PhD theses (Harper, 2006; Huntley, 2007; Lucas, 1999; MacKenzie, 2005) and one relevant M.Sc. thesis (Braunwart, 1998) were also identified and reviewed.
2.2 Behaviour of the shaft during a typical golf swing
When handling a golf club it is easy to feel that the rigidity of the shaft is „relatively low‟, permitting bending of the shaft through application of a small load (for example by using one‟s hands). Combined with the high mass of the club head and the dynamic swing motion, it can be expected that the shaft undergoes a significant amount of deformation during a swing. Consequently, it has been found that there is a constant exchange of kinetic energy and strain energy (Newman, Clay, & Strickland, 1997). Strain gauge measurements and optical observation with high-speed cameras allowed researchers to analyse the typical sequence of shaft bending that occurs throughout the swing. The pre-impact sequence is illustrated in Figure 1, and the deflection pattern occurring during the downswing can be summarised as follows:
“At the initiation of the downswing the shaft is bent backwards as a result of the inertia of the club head and the torque exerted by the golfer. As the downswing proceeds the shaft gradually straightens out and then bends forward during the final moments before impact.” (Penner, 2003, p. 157)
(a) (b)
Figure 1: Shaft behaviour during a typical golf swing: (a) simulation of shaft bending according to Milne & Davis‟ (1992) measurements (bending
exaggerated by a factor of 5) (adapted from Penner, 2003, p. 158); (b) bending of the shaft during a typical golf swing (adapted from Newman,
Clay, & Strickland, 1997, p. 369).
Whilst the shaft may influence the path and orientation of the club head just before impact, the shaft‟s effect during impact is generally considered to be negligible because of the short impact duration of ~500 μs (Hocknell, Jones, & Rothberg, 1996; Roberts, Jones, & Rothberg, 2001). Mather and Jowett reported that the change in the amount of shaft deflection during impact was minimal - “only a few millimetres” (Mather & Jowett, 2000, p. 79). After impact, however, the shaft bent considerably backwards (up to 200 mm), but this had no effect on the trajectory of the ball (Mather & Jowett, 2000). Newman et al.
(1997) reported smaller maximum deflections (up to 75mm), probably because they did not include post-impact vibrations in their analysis (see Figure 2(b)).
(a) Bending in plane of swing (lead/lag)
(b) Assumed reason for in plane bending
(c) Bending perpendicular to plane of swing (toe-up/down)
(d) Assumed reason for toe-down bending
Figure 2: Definition of bending planes and suggested reasons for bending (adapted from Horwood, 1994, p. 249 and 251).
In terms of deflection shape, measurements with multiple strain gauges along the shaft have shown that first mode vibrations dominate the downswing (Butler & Winfield, 1994). At and just after impact, however, stress waves travel up the shaft (Horwood, 1994; Masuda & Kojima, 1994), which will lead to a more complex shaft shape during this phase of the swing and the follow-through. For an observer, the forward and downward bending just before impact may be unexpected. Horwood (1994) and Mather and Jowett (2000) argue that the reason for this behaviour is the off-centre position of the centre of gravity (COG) of the club head relative to the shaft centre line (see Figure 2). The off-centre position causes a bending moment because centrifugal force is acting on the COG of the club head but centripetal force is being applied via the shaft.
It appears that Milne and Davis (1992) were the first to publish a scientific study focusing on shaft deformation and have been cited in many subsequent studies. Whilst their study laid the foundation for much of the shaft research that followed, it is important to note that there were some limitations in the data collection methods used by the authors. Strain gauge signals were sampled at a relatively low sample rate (200 Hz) and could not be sampled from all strain gauges simultaneously. Hence, the full swing data set was obtained by combining data from successive swings, which might have an effect on the accuracy of the data depending on the consistency of the players. Furthermore, the authors reported difficulties with transferring their strain data from the local shaft coordinate system to a global coordinate system because they used a single camera to determine the club orientation throughout the swing. It is not clear how they derived their three-dimensional model from data collected with a single camera. Nevertheless, the deflection patterns reported by Milne and Davis are generally in line with later studies although they are lacking an appropriate separation of the bending patterns in their lead/lag and toe-up/down components (Butler & Winfield, 1994; Horwood, 1994; N. Lee, Erickson, & Cherveny, 2002).
Based on the existing literature, it is difficult to determine the range of variation that exists for different golfers. Whilst some of the studies reporting typical patterns of shaft deflection refer to “hundreds of trials” (Butler & Winfield, 1994) or “various swings” (Newman, Clay, & Strickland, 1997), Table 1 shows that none of the studies reported shaft deflection patterns for more than 5 subjects. Furthermore, it is important to note the relatively low strain gauge sample rate that was used in some of the studies. At a sample rate of 500 Hz, as was used for example by Ozawa et al. (2002), it is only possible to record 100-150 samples in the duration of a typical downswing (0.2-0.3 s, Burden, Grimshaw, & Wallace, 1998; Egret, Vincent, Weber, Dujardin, & Chollet, 2003). It is evident from Figure 1 that a typical golf swing includes dynamic changes in shaft deflection, and it is likely that these cannot be adequately characterised with a small number of samples.
Table 1: Summary of previous research into shaft deflection patterns. Reference Method used Sample rate Number of
subjects
Milne & Davis
(1992) Strain gauges 200 Hz 3
Horwood (1994) Strain gauges unspecified 1
Butler & Winfield (1994)
2 longitudinal, 1
torsional gauge 50,000 Hz
“hundreds of trials” Kojima & Horii
(1995)
3 longitudinal, 3
torsional unspecified 1 robot
Newman, Clay & Strickland (1997) 8 longitudinal, 1 torsional strain gauge 500 Hz “various”, present only results for one professional Mather & Cooper
(1994) Multiple exposures with two cameras (exposure time 300 ns, see Smith, Mather, Gibson, & Jowett,
1998, for details) N/A 2 Mather &Jowett (2000) N/A 3 Mather et al. (2000) N/A 1 Iwatsubo et al. (2002) 4 torsional strain
gauges unspecified 1 robot
Lee, Erickson &
Cherveny (2002) 6 strain gauges 500 Hz 5
Ozawa, Namiki &
Horikawa (2002) 3 strain gauges 500 Hz 2
Tsujiuchi, Koizumi & Tomii
(2002)
6x2 strain gauges unspecified 3
Tsunoda, Bours & Hasegawa
(2004)
8 strain gauges unspecified 1
Shinozaki et al. (2005) 6 longitudinal, 3 torsional strain gauges 10,000 Hz 3
Harper, Jones & Roberts (2005)
Strain gauges
2.3 Mechanical properties of the golf shaft
This section of the literature review focuses on the mechanical properties of the shaft. The purpose of this section is to put the subsequent sections of the literature review into context and to provide background information. It is deemed necessary to fully understand the mechanical characteristics of the club in order to correctly interpret its dynamic behaviour.
2.3.1 Manufacturing process
Material selection and processing routes will each have a strong effect on the properties of a finished golf shaft. The section that follows summarises the manufacturing process for steel and graphite shafts.
2.3.1.1 Steel shafts
From the 1920s until the introduction of graphite shafts in the 1970s, the majority of golf shafts were manufactured from steel. A detailed description of the manufacturing process of steel shafts can be found in Maltby (1995, pp. 550-556). Briefly, Maltby describes the manufacturing process as follows: the process begins with the forming of high-alloy steel strips into tubes. High frequency welding is then used to close each tube. The diameter of this tube is bigger than the diameter of the finished shaft, so diameter and wall thickness are reduced on a draw bench. This process is repeated six to eight times until the butt diameter of the finished shaft is reached. A series of dies then produces the stepped tapering of the shaft. Next, a heat treatment improves the hardness and the strength of the shaft. After it is straightened (if necessary), the shaft is cleaned and plated with nickel and chrome for corrosion protection.
2.3.1.2 Graphite shafts
Despite their name, graphite shafts are typically made from Carbon Fibre Reinforced Polymers (CFRPs). Graphite shafts can be either sheet-wrapped or filament-wound. Maltby (1995, pp. 634-341) and Cheong et al. (2006) describe the sheet wrapping manufacturing route as follows. It begins with the production of crystalline carbon fibres from Polyacrylonitrile (more flexible) or pitch (highest carbon content, less flexible). These fibres are pre-impregnated with epoxy
resin and woven to form pre-pregs. These pre-pregs are cut into sections (flags) with different fibre angles. These pieces of pre-preg material are rolled around tapered steel mandrels to form the shaft, resulting in a total number of approximately seven layers (see Figure 3). Usually, each flag is rolled around the mandrel more than once. The ends of the pre-pregs form seams, which have been found to result in inconsistencies in the mechanical properties of the shaft (Huntley, Davis, & Strangwood, 2004). Furthermore, micro-structural analysis (Huntley, 2007) has shown that manufacturers usually roll some of these layers simultaneously and other layers consecutively. When two layers are rolled simultaneously, this will result in an alternating order of pre-pregs (see inner layer 1 and 2 in Figure 4(b)). When two layers are rolled consecutively, this will result in a different sequence of layers (outer layer 1 and 2 in Figure 4(b)). In terms of fibre orientation1 and order of plies, Cheong et al.
(2006) presented a model of a shaft with ±45° fibres as inner layers and 0° fibres as outer layers. This is in agreement with the majority of shafts sectioned by Huntley (2007) as well as shafts described by Sabo (1995) and Zako et al.
(2004), so it will be assumed here that this is the typical construction of sheet-laminated shafts.
1
Fibre orientations are described relative to the longitudinal axis of the shaft, with 0° meaning that the fibres are parallel to the longitudinal axis of the shaft.
Figure 3: Lay-up process for sheet-laminated shafts (adapted from Cheong, Kang, & Jeong, 2006, p. 465).
When all pre-pregs are in place on the mandrel, it is covered with tape providing the necessary pressure during the curing process. After the curing process, the mandrel is removed, and the outer surface of the shafts is sanded and polished to finish. This manufacturing route leaves four options for deliberately altering the mechanical characteristics of the shaft: (1) the number and order of pre-preg layers, (2) the fibre orientation of each layer, (3) the fibre type of each layer and (4) the geometry of the mandrel. Through the work of Huntley (2007) it is evident that changes in other aspects of shaft manufacture can also lead to changes in the mechanical characteristics of the shafts, for instance the amount of interfacial material between plies.
For filament-wound shafts, the only difference is in the method used to place fibres on the mandrel. Rather than rolling plies on a mandrel, a machine wraps two layers of pre-preg tape around it. After this, a filament winding machine weaves carbon fibres around this mandrel (Maltby, 1995, p. 626). In the case of filament winding, the angle of the fibres is configured by varying “the distance the winding head travels down the length of the mandrel per mandrel revolution” (Howell, 1992, p. 1397). Furthermore, it is possible to change the number of circuits in a layer, which is the number of times the winding head travels up and
down the shaft before finishing one layer. In contrast to the lay-up process, filament winding allows the manufacturer to vary the amount of tension on the fibres while they are wound on the mandrel (Howell, 1992).
The differences in the manufacturing process of filament-wound and sheet-laminated shafts manifest themselves in the mechanical shaft properties. Whilst filament winding involves less manual labour, creates more flexibility in the design of the lay-up and avoids seam effects at the end of pre-pregs sheets (Howell, 1992), it is also more expensive and leads to a decreased fibre content (Huntley, Davis, Strangwood, & Otto, 2006).
(a)
(b)
Figure 4: (a) Typical composition of a sheet-laminated shaft from a number of layers2 of carbon/epoxy pre-pregs (adapted from Cheong, Kang, & Jeong, 2006, p. 469). (b) Resulting lay-up of carbon/epoxy layers.
Fibres of the inner layer are typically oriented at ±45°, fibres of the outer layer at 0° (adapted from Huntley, 2007, p. 140).
2
2.3.2 Material properties of graphite shafts
For steel shafts, it is viable to assume isotropic material properties, so the shaft properties will only be governed by the choice of material and the geometry of the shaft. Composite shafts, however, consist of several layers of carbon fibres (see previous section). Therefore, they will have anisotropic properties that heavily depend on the angle between load direction and fibre orientation. Depending on load orientation, the modulus of each layer will vary between upper and lower bounds, with the properties of the fibres defining the upper bounds (longitudinal load) and the properties of the matrix materials defining the lower bounds (transverse load) (Ashby, 2005). For example, in the case of one layer of unidirectional composite material the upper bound (longitudinal load) can be 120 GPa, whereas the lower bound (transverse load) is as low as 10 GPa (Zako, Matsumoto, Nakanishi, & Matsumoto, 2004).
CFRPs have been shown to have strain rate dependent material properties under certain conditions (Gilat, Goldberg, & Roberts, 2002; Vinson & Woldesenbet, 2001; Weeks & Sun, 1998). This is illustrated in Figure 5, which shows stress-strain curves for composite materials at different strain rates. If the material properties were not strain rate dependent, each of the two graphs would show identical lines for all loading rates. Only at low strains do some of the curves overlap, in particular at low strain rates. This indicates that strain rate dependency has only a minor effect when strain and strain rates are below a material-specific limit.
(a) (b)
Figure 5: Stress(σ)-strain(ε) graphs for composites loaded at different strain rates: (a) based on micromechanical modelling (Zhu, Chattopadhyay, & Goldberg, 2006, p. 1810); (b) based on experimental
results (Fereshteh-Saniee, Majzoobi, & Bahrami, 2005, p. 46).
2.3.3 Geometry
The geometry of a golf shaft can be described by the variables shown in Figure 6 and, additionally, by its wall thickness. However, there is little information in the scientific literature describing the typical characteristics of the geometry of shafts.
Figure 6: Typical shaft geometry (cross section). Shaft diameter is exaggerated relative to length for clarity (based on data presented in
Huntley, 2007).
Maltby (1995) listed typical lengths and tip/butt diameters for a variety of shafts that were on the market in 1995, but no information is given regarding typical taper or wall thicknesses. Maltby only collated information that is of practical
relevance to club makers when assembling a club. Huntley (2007) sectioned 33 graphite driver shafts and analysed their geometry in detail. It was found that the mean wall thickness of shafts was between 0.7 and 1.1 mm. Some of the shaft batches analysed were designed to have a constant wall thickness (with the exception of reinforced areas in the tip sections); for other shaft batches the wall thickness decreased continuously from the tip end to the butt end. The range of tip diameters was between 8.2 and 8.9 mm, and the range of butt diameters between 14.8 and 15.7 mm. The diameter increased continuously from the tip end to the grip section and remained constant in the grip section for the majority of shafts. These results are in agreement with typical shaft dimensions given by Howell (1992). Huntley (2007) noted that there were wall thickness variations around the circumference of the shaft, which resulted in standard deviations in wall thickness of between 10 and 96 µm for given shaft positions. It was found that these were related to the manufacturing process and the resulting seams (see Section 2.3.1).
2.3.4 Mass and Density
As for the geometry of the golf shaft, published data describing typical mass properties of shafts is limited and, in most cases, anecdotal and not based on scientific study. Lee and Kim (2004) mention a number of categories of mass ranges, which are summarised in Table 2. The overall mass range stated by Lee and Kim is similar to values presented by Howell (1992), who stated the minimum and maximum mass of composite shafts as 59g and 110g, respectively. Penner (2003) mentioned that the typical weight is 90g for a graphite shaft and 120g for steel shafts, which is within the range given by the other authors.
Table 2: Mass ranges of golf shafts (adapted from Lee and Kim, 2004).
Mass Category
< 60 g light carbon shafts
60-80g general user carbon shafts
80-100g professional carbon shafts
>100g steel shafts
The mass ranges presented by Lee and Kim (2004) indicate that there is a trend for weaker players to prefer lighter shafts, presumably to reduce the inertia of the club.
In terms of density, Huntley (2007) found that it was consistent for the 33 shafts he sectioned (1.5 g cm-3). This is close to a value of 1.55 g cm-3 identified in a material database as a typical density of carbon/epoxy composite material (Matweb, 2007).
2.3.5 Length
For an assembled golf club, rather than measuring the length of the shaft in isolation, it is common to use the overall club length as a measure. This is due to the fact that the effective club length (as perceived by the player) can be different for two clubs even if they have identical shaft lengths, depending on the construction of their club heads (depth of hosel bore). Therefore, Maltby (1995, p. 426) defines club length as the distance from the cap of the grip to the intersection of the shaft centre line with the ground with the club sole resting on the ground. This definition is similar to the definition of club length in the Rules of Golf as displayed in Figure 7 (The R&A, 2008, Appendix II, Rule 1 (c)). The Rules of Golf limit the club length for all clubs except putters to a maximum of 48” (1.219 m). The only club of a typical set with a length close to this limit is the driver. The length of the other clubs decreases gradually as the loft angle of the clubs increases, with the possible exception of the putter.
2.3.6 Bend point position
To define the bend point of a golf shaft, the shaft is considered to be clamped at the butt end with a load applied to the tip end. The bend point is then defined as the position on the shaft where the radius of bending curvature is smallest (Howell, 1992). Golf shafts do not bend in a perfect arc because of changes in their cross section along their longitudinal axis, as illustrated by the equation for the second moment of the area of a hollow object with a cylindrical cross section (assuming isotropic material properties):
𝐼 𝑥 = 𝜋4 (𝑅(𝑥)4− 𝑟(𝑥)4) (1),
where: x is the position along the longitudinal axis of the shaft,
I(x) is the second moment of area at position x,
R(x) is the outer radius of the shaft at position x,
r(x) is the inner radius of the shaft at position x.
By multiplying equation (1) with the modulus of elasticity of the material (E), the rigidity (EI) of the object is obtained.
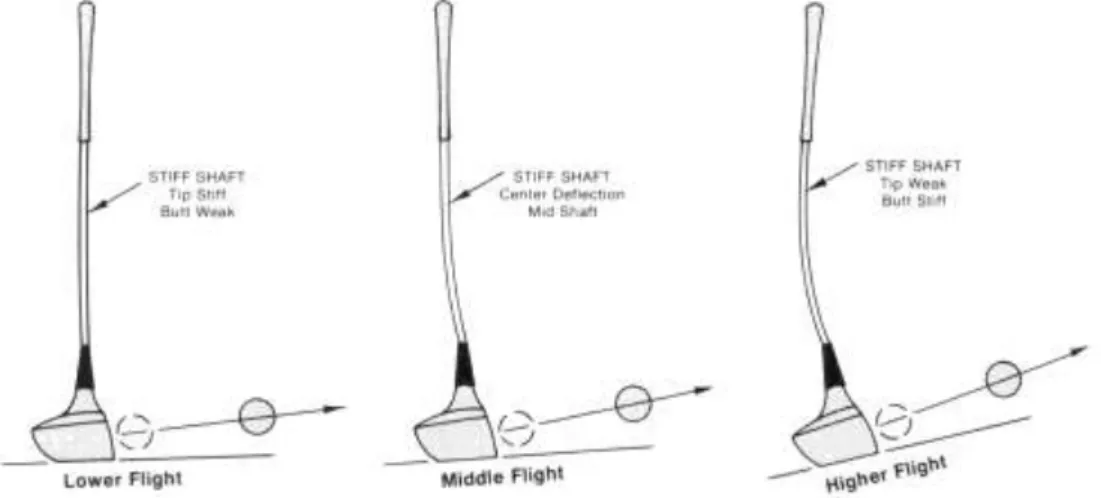
From butt to tip end, the shaft diameter typically decreases and the wall thickness increases (see Section 2.3.3), usually resulting in the rigidity gradually decreasing towards the tip because the effect of the decrease in diameter is not fully compensated by the increase in wall thickness. In golfing terms, a distinction is made between a high, mid and low bend point, depending on the bend point position relative to the tip end (Maltby, 1995). The position of the bend point can also be expressed as a percentage of the total club length relative to the tip end of a shaft. This position varies typically between 48 % and 56 % (Huntley, 2007).
2.3.7 Bending stiffness / Flexural rigidity
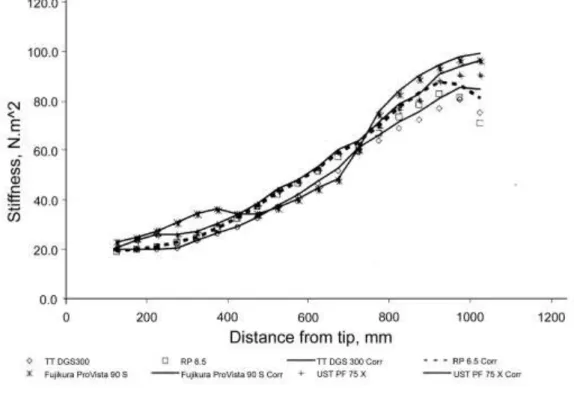
The bending stiffness or flexural rigidity3 of a golf shaft characterises its resistance to flexural deformation. It depends both on the material properties of a shaft (modulus of elasticity, E) and on its geometry (second moment of area of its cross section, I). This was demonstrated experimentally by Huntley (2007), who showed that shaft wall thickness and outside diameter variations correlated with shaft stiffness variations along golf shafts. However, these variables could not explain the full range of stiffness variations, so the material‟s modulus must also vary along the shaft. Some researchers (Brouillette, 2002; Mase, 2004) performed repeated bending tests along the shaft to characterise their stiffness profile (see Figure 8). The stiffness of a shaft is regarded as an important parameter due to the way it affects dynamic loft (see Section 2.6.4 ). Huntley (2007) noted wall thickness variations and inconsistencies in the number of layers around the circumference of the shaft. It was found that areas with a reduced number of layers resulted in lower static stiffness. This caused shaft stiffness variations of up to 3% when the shaft orientation was varied at a given position (Huntley, 2007).
In golfing, it is common to use simple abbreviations to characterise the flexibility of the whole shaft: l-flex (ladies), a-flex (senior), r-flex (regular), s-flex (stiff), x-flex (extra stiff). This provides a simple reference for golfers to compare shafts from one manufacturer, but can create some confusion and makes it difficult to compare shafts from different manufacturers as the stiffness ranges for the letter codes are not standardised (Summitt, 2000). Huntley et al. (2006) found that, at a cantilever length of 1.067 m, a „ladies‟, „regular‟ and „x-stiff‟ flex ranking corresponded to a bending stiffness of 135-140 N/m, 154-162 N/m and 168 N/m, respectively.
3
In many cases, the terms stiffness and rigidity are used interchangeably in golf literature. However, they differ in their definitions. In the case of bending tests, stiffness is defined as load divided by deflection (units: N/m). Therefore, a comparison of stiffness values is only possible if tests are performed under identical conditions (lever length, position of deflection measurement). In contrast, rigidity (units: Nm2) includes the length of the lever and represents the combined characteristics of a structure‟s modulus (E) and geometry (I). Throughout this thesis both terms are used interchangeably in the general discussion and the literature review, but the appropriate term will be used when reporting test methods and results.
Figure 8: Stiffness profiles for four different golf shafts before and after applying a correction for measurement errors. It can be seen that each
shaft has characteristic stiffness variations between tip and butt end (adapted from Mase, 2004, p. 520).
2.3.8 Fundamental Bending Frequency
The natural frequency of a structure describes its response to dynamic excitation. In the case of golf shafts, the fundamental frequency is commonly used to characterise the stiffness of a given shaft design (Cheong, Kang, & Jeong, 2006). The advantage of this approach over static bending tests is that it summarises the bending properties of the shaft as a whole, whereas typical static deflection tests, where the butt end is clamped, may overemphasise the bending stiffness of the shaft towards its butt end, because bending moments in this area will be greatest. However, shaft mass affects a shaft‟s fundamental frequency, so two shafts with identical stiffness characteristics could have different fundamental frequencies due to mass differences (Howell, 1992). If the oscillating shaft is regarded as a simple “spring mass” system, this is illustrated by the following equation (Horwood, 1994, p. 105):
𝜔𝑛 =2𝜋1 𝑚𝑘 (2),
where: ωn is the natural frequency of the shaft (Hz),
k is the stiffness of the system (N/m),
m is the mass of the system (kg).
The same conclusion can be drawn from the following alternative equation, which relates shaft frequency to rigidity (Howell, 1992, p. 1396):
𝜔𝑛 =30𝜋 𝑚+0.23 𝑀 ℓ3 𝐸𝐼 𝑔 3 (3),
where: ωn is the natural frequency of the shaft (cpm),
g is gravity (m/s2),
E is the average shaft elastic modulus (N/m2),
I is the average second moment of area (m4),
m is the mass attached to the tip end of the shaft (kg),
M is the shaft mass (kg),
ℓ is the shaft free span (m).
In both equations, the shaft mass forms part of the equation, hence influencing the calculated frequency.
It has been noted that the fundamental frequencies of sheet-laminated shafts vary depending on shaft orientation (Horwood, 1994; Howell, 1992; Maltby, 1995). Micro-structural analysis (Huntley, Davis, & Strangwood, 2004) provided an explanation for these inconsistencies as it showed structural discontinuities due to the manufacturing process (“seams”, see Section 2.3.1). However, stiffness variations observed in static tests did not affect the results of dynamic shaft tests (Huntley, Davis, Strangwood, & Otto, 2006). It remains to be clarified
by future studies whether seams and the resulting variations in fundamental bending frequencies have any significant effect when a player swings a club. 2.3.9 Torsional stiffness
The torsional stiffness4 of a golf shaft characterises its resistance to twisting when the shaft is clamped at the butt end and torque is applied at the tip (Horwood, 1994; Howell, 1992; Wishon, 1995). During the downswing, this form of load mainly occurs because of the offset between the COG of the club head and the centreline of the shaft (see Figure 2, p. 7). Inertial and centrifugal forces acting on the COG of the club head create a torque as they are counter-acted by the hands of the player. This causes the shaft to twist (Horwood, 1994), particularly when the player rotates the club around the longitudinal shaft axis. Twisting of the club head typically causes the face to close at impact compared to its neutral (unloaded) position (Newman, Clay, & Strickland, 1997).
In terms of shaft construction, torsional stiffness of graphite shafts mainly depends on the magnitude and diameter of fibres oriented at an angle close to ±45° relative to the longitudinal axis of the shaft. Theoretically, it is possible to design golf shafts with asymmetric torsional stiffness properties by varying fibre orientation, for example, to create higher torsional rigidity in the anti-clockwise direction compared to the clockwise direction. However, a shaft constructed like this would be non-conforming under the Rules of Golf (The R&A, 2008, Appendix II, Rule 2(b)). Conformance can be verified by repeating twist tests in two different directions. Huntley (2007) demonstrated that there was a linear relationship between load and twist angle with identical results for both load orientations.
4 In golf terminology, torsional stiffness is often quantified by a „torque‟ value in degrees. This value specifies how much the shaft twists when the butt end is clamped and the tip end is subjected to a load of 1.34 Nm (1 lb-ft). Therefore, a low „torque‟ value will be associated with a shaft with high torsional stiffness and vice versa.
2.4 Characterising shaft properties – shaft tests
In the previous section, all relevant shaft variables were defined. The objective of this section is to provide a brief overview of tests used to determine the magnitude of these variables. First, standardised mechanical tests are summarised; second, more complex robot tests are reviewed; finally, human tests are discussed.
2.4.1 Mechanical Tests
Only very basic measurement methods are needed for most mechanical shaft properties. The mass can be determined using a scale, density requires weighing and a volume measurement (Archimedes principle), and shaft length can be determined using a ruler or the Rules of Golf procedure (The R&A, 2007). The outer geometry of a golf shaft can be determined by using callipers. Inner diameters and wall thickness can be measured after sectioning shafts (Huntley, 2007). More complex, non-destructive techniques can be used to characterise carbon/epoxy composite shafts and could potentially be used to determine the inner diameter of golf shafts without sectioning them (Gao & Kim, 1998). These methods typically involve x-raying the specimen, but it is likely that it is not feasible to use these relatively expensive techniques to characterise the relatively simple geometry of golf shafts if it is possible to section the shaft instead.
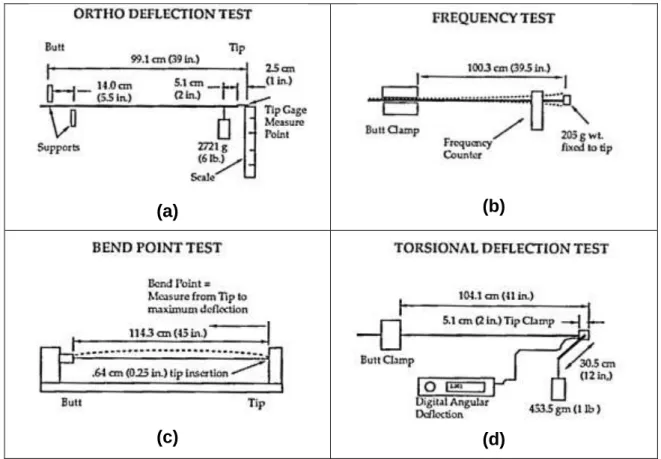
A number of different methods to determine the static stiffness of golf shafts have been presented in the literature including simple bending tests (Howell, 1992; Maltby, 1995), repeated bending tests (Brouillette, 2002) and 3-point bending tests (Mase, 2004). The method that is most widely used appears to be the simple test presented by Howell (1992) as well as Maltby (1995), where the butt end is held by a fixture and a mass is attached to the tip end of the club (see Figure 9 (a)). This simple bending test set-up is commercially available as a „deflection board‟ (Maltby Design, USA; see Figure 10 (a)). A second type of commercial device allows characterising shaft stiffness by fundamental frequency (Golfsmith, Inc. USA; see Figure 9 (b) and Figure 10 (b)). A mass, typically 205 g, is attached to the tip end and the shaft is clamped at its butt end. The shaft is excited and strain gauges, load cells or photo sensors
measure the frequency of oscillation of the shaft. After processing the measured data, the device displays the fundamental frequency of the shaft in cycles per minute (cpm). Unfortunately, there appears to be no standard for the clamp position relative to the tip end, making it difficult to compare frequency values measured by different researchers.
Torsional stiffness is typically measured using a device consisting of a butt clamp, a lever with a mass attached to it and a fulcrum to prevent any shaft bending during the test (see Figure 9 (d) and Figure 10 (c)). The resulting twist of the shaft is measured using a dial.
(a) (b)
(c) (d)