Euro, crisis and unemployment: Youth patterns, youth policies?
Atanu Ghoshray
a, Javier Ordóñez
b,c, Hector Sala
d,e,⁎
a
Newcastle University Business School, United Kingdom b
Instituto de Economía Internacional, Universitat Jaume I, Spain cUPAEP, Mexico
d
Universitat Autònoma de Barcelona, Spain e IZA, Germany
a b s t r a c t
a r t i c l e i n f o
Article history: Received 24 December 2015 Received in revised form 17 May 2016 Accepted 17 May 2016Available online 31 May 2016 JEL classification:
J64 O52 J08 F66
This paper examines the occurrence of structural breaks in European unemployment associated with major institutional events. We uncover different responses of adult and youth unemployment rates. While adult unemployment is more prone to experience structural breaks, youth unemployment is more sensitive to business cycle oscillations, especially in the recent crisis. This calls forfine tuning policy measures specifically targeted to youth unemployed in bad times. One important implication of ourfindings is that generic labour market reforms are not effective enough to solve the youth unemployment problem. Educational policies raising average qualifications and helping school-to-work transitions are suitable complementary cures.
© 2016 Elsevier B.V. All rights reserved.
Keywords: Unemployment Structural breaks Crisis Eurozone Youth Education 1. Introduction
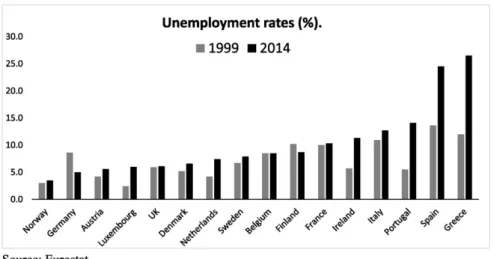
The Global Financial Crisis has led to a significant increase in unemployment after a long expansionary period. Aggregate unemploy-ment in the European Union was 9.2% in 1999, moved down to 7.2% in 2007, and rose to 10.2 in 2014. In the euro area, it decreased from 9.7 to 7.5 and then rose to 11.6% over the same years. Within the European aggregates, however, there are wide differences in the unemployment behaviour between countries.
Unsurprisingly, the European periphery countries present the worst unemployment behaviour (Fig. 1). At the start of the EMU, for example, Greece and Spain had unemployment rates around 12 and 14%, not far away from the 9% in Germany in 1999. Since then, however, while in the Scandinavian and continental European countries unemployment rates have hardly changed across expansion (1999–2007) and crisis (2008–2014), they have doubled in the periphery (Ireland, Portugal, Spain and Greece).
These developments have raised concerns about the persistence of high levels of unemployment (OECD, 2011, 2014) and its social and economic consequences: widespread deterioration of human capital, discouragement and labour market withdraw, effects on government budget and standards of living. These concerns are not however new. The seriousness of the high and persistent European unemployment problem has long been recognized, and countless theoretical and empirical studies have been undertaken to determine its causes (Layard et al., 1991; Bean, 1994; Ljungqvist and Sargent, 1998; IMF, 1999; Blanchard, 2006, among many others).
However, most of these studies focus on the aggregate unemploy-ment rate. As shown inFig. 2, youth unemployment rates may be characterised by different dynamics. Note, for example, that the rates in 2014 were larger than those of aggregate unemployment in all countries with no exception, both in 1999 and 2014. A second notewor-thy feature is that unemployment increases were larger in youth unem-ployment in all economies with the exception of France and Norway. More precisely, the largest increases in the youth unemployment rate took place in Greece, Portugal and Spain (between 20 and 27 percentage points), followed by Ireland, Italy and Luxembourg (around 15 percentage points), and Sweden (10.6 percentage points). Note that
⁎ Corresponding author.
E-mail address:hector.sala@uab.es(H. Sala).
http://dx.doi.org/10.1016/j.econmod.2016.05.017 0264-9993/© 2016 Elsevier B.V. All rights reserved.
Contents lists available atScienceDirect
Economic Modelling
Luxembourg more than tripled its youth unemployment rate, while in Sweden it almost doubled as it did in Austria.
In view of these differences, a disaggregated analysis of unemploy-ment by considering specifically the youth and adult rates may uncover significant specific patterns, and thus be useful to refine some of the generic policy recommendations aiming at the restructuring of the so called unfriendly labour market institutions (employment and unemployment protection legislation, union power,fiscal wedges). This would not imply neglecting such policies, but certainly would call for group-specific measures in case different dynamics exist.
Time series analysis has been widely used to test among unem-ployment theories. Afirst wave of studies were concerned with the degree of integration of unemployment series. If unemployment could be characterised as a unit root process, empirical support would be given to the hysteresis hypotheses (Blanchard and Summers, 1986, 1987), under which temporary shocks have perma-nent effects. At the other extreme, an order of integration close to zero would endorse the NAIRU theory (Layard et al., 1991) according to which shocks cause short departures from equilibrium and poli-cies should focus on lowering this equilibrium rather than reducing persistence (as under the hysteresis hypothesis). A moreflexible approach, such as the Structuralist one proposed byPhelps (1994), considered the possibility of infrequent shocks that would cause regime changes in unemployment.
Our study departs from this tradition of unemployment time series analysis (Narayan and Smyth, 2004;Valadkhani and Smyth, 2015) as we take a univariate approach to examine the nature of trends in unemployment of European countries. Our objective, however, is not to contribute to the extant research on unemployment hysteresis, but to measure the trends in unemployment, and disaggregate the analysis by examining youth unemployment as well, which happens to be a contentious issue. This involves detecting whether there is a case of breaking trends and how the trends are measured within regimes demarcated by the break points.
Accordingly, this paper aims at identifying potential breaks in European unemployment due to the occurrence of single definitive events: the settlement of a monetary union in 1999 and the Euro/financial crisis in 2008–2009, which was followed by an intensive and extensive reform process. In this paper we seek to answer pertinent questions such as: Has the adoption of the single currency contributed to the large distribution of unemployment rates across the euro zone area? Has the euro crisis contributed to an increase in structural unemployment? If so, for which countries? The above questions can be analysed by the robust detection and date stamping of structural breaks in unemployment across euro area countries. For example, structural breaks located around the introduction of the euro could appear in peripheral countries, but not in core countries, could be interpreted as a signal that the adoption of the single currency had asymmetric effects on the unemployment behaviour
Fig. 1.Unemployment rates (%). Source: Eurostat.
Fig. 2.Youth unemployment rates (%). Source: Eurostat.
across euro zone countries. This situation however cannot be necessarily interpreted as a divergence effect in unemployment arising from the adoption of the euro. Rather, as an example, it may signal the fact that peripheral countries are catching-up to the core countries level in terms of competitiveness and thereby, in terms of labour market performance. To assess whether this is the case, we will analyse the trend behaviour in structural unemployment before and after the estimated shocks. Similarly to the introduction of the euro, the analysis of structural breaks can help to determine whether, as a consequence of the crisis, structural unemployment in European countries has increased.
FollowingPerron (1988)the method of least squares to estimate the trend is likely to suffer from size distortions if a unit root is present in the data. For example, if the data is modelled as a differ-ence stationary process when it is actually a trend stationary process, then the test will be inefficient and lack power relative to the trend stationary process (Perron and Yabu, 2009a). The presence of struc-tural breaks further complicates the process, as neglecting a break in an otherwise trend stationary process can lead to the conclusion of a spurious unit root in the data (Perron, 1989), while ignoring a trend break in a difference stationary process can lead the unit root test to the false conclusion that the data is stationary (Leybourne et al., 1998). Therefore, when using the approach to test for unit roots while allowing for structural breaks in the trend function of the underlying data, the inference drawn from the structural break test on the level of the data depends on whether a unit root exists, while the test based on differenced data can have poor properties when the data contains a stationary component (Vogelsang, 1998). This problem underscores the need to employ structural break tests that allows one to be agnostic to the nature of serial correlation in the data. To this end, we employ robust methods ofPerron and Yabu (2009b) and Kejriwal and Perron (2010) to determine structural break points. Once the breaks (if any) are identified, we demarcate regimes based on the number of break points. We then proceed to estimate the trends for the individual unemployment regimes identified by the break points. Where no breaks are found, we estimate the trend over the entire sample. If wefind a single structural break, we estimate the trends for the two regimes demarcated by the break point. In the presence of two breaks, three slope regimes are estimated.
The advantage of measuring the trends using the method ofPerron and Yabu (2009a)is that we can be completely agnostic about the un-derlying order of integration of the data series, either for the individual regimes or the entire sample. Motivated by these considerations, this paper makes a robust detection of structural breaks, robust estimation of the break locations and the trend of the regimes identified by the estimated break dates. The euro crisis has also put on the top of the European economic agenda the issue of high youth unemployment and the need of implementing specific policy measures to cope with it. Despite the political consensus about this need, some authors have suggested that“it is not at all clear that young people suffer more from being unemployed than older people, or even disproportionately more than older unemployed individuals. In particular, it is not clear that the much-publicised notion of a‘lost generation’with permanent
‘scars’is relevant only to the young generation”(Barslund and Gross, 2013, p. 2). To shed some light on this issue, we will test for structural breaks in both youth and adult structural unemployment to assess whether the trend behaviour after the crisis is different between both groups of unemployed.
On this point, our empirical results entail a variety of policy impli-cations. Thefinding of structural breaks accompanied by statistically significant slope changes in the rate of unemployment can be associ-ated to changes in the equilibrium rate of unemployment. In that case, the standard policy recipe takes the form of structural reforms to improve the institutional design and, thereby, help the perfor-mance of the labour market. On the contrary, in the absence of structural breaks, divergence from the equilibrium unemployment
rate should be managed preferably through demand-side and growth oriented policies.1
The less standard and more novel case, however, is the one in which a different behaviour is identified for a different group (youth, adult) in a given country. Although youth and adults may benefit from group-targeted policy measures, they are all subject to the same general institutional framework. This implies that generic recommendations in terms of structural reforms may have to be complemented by more specific measures. In view of ourfindings, these complementary policies ought to emphasise better educational records and improvement of school-to-work transitions. In this way, youth would become less prone to reduce their participation rates when the economy is hit by a severe shock such as the Great Recession, and much less exposed to become part of the‘Not in Education Employment or Training’(NEET).
The remainder of the paper is structured as follows.Section 2
reviews the literature discussing the effects of both the single monetary policy and the current economic crisis on unemployment.Section 3
presents the theoretical and empirical evidence on the different behaviours of youth and adult unemployment rates.Section 4discusses how structural unemployment is obtained, whereasSection 5explains the methodology. The results are presented inSection 6and discussed inSection 7. Finally,Section 8concludes.
2. Unemployment in Europe: the effects of EMU and the crisis 2.1. The euro
Under the traditional macroeconomic paradigm, we should not expect any effect from the adoption of a single monetary policy on unemployment since monetary policy is neutral in the long-run and the creation of a monetary union is just a change in the monetary regime. However, in order to join the monetary union, the countries had to fulfil certain conditions, as the Maastricht Treaty, as well as the Stability and Growth Pact once in the euro zone. The institutional framework of the EMU imposed asymmetric relationships between a centralized monetary policy, restricted nationalfiscal policies and unco-ordinated wage policies. The design of the economic governance of the euro and the deepening process of European integration zone infl u-enced the European macroeconomic scenario, as well as the organiza-tion and the funcorganiza-tioning of European labour markets through changes in the economic environment in which these markets operate. The elim-ination of exchange ratefluctuations also led to a further increase in product market integration, and intensification of competition and reg-ulation. In addition, the common currency increased price transparency, exposing nationalfirms to a higher level of competition. All these factors have certainly affected nominal wage and price settings.
Some authors have suggested that the EMU have also affected the wage-bargaining setting through an increase in both national and trans-national wage-bargaining coordination, although some others did point out that this process would be rather dubious (Calmfors, 2001). Also,
Cukierman and Lippi (2001, p. 541)suggested that the EMU formation reduced unions' perceptions of the inflationary repercussions of their individual wages, inducing them to be more aggressive in their wage demands.
Having lost an important stabilizing tool such as the monetary policy, it has been argued that EMU countries have increased their labour marketflexibility as a complementary mechanism to cope with adverse shocks. This is in contrast to the view that a monetary union can weaken the incentives for national labour market reform, since
1
Thefinding of structural breaks and non-significant slope changes should be in princi-ple associated to the need of demand-side and growth oriented policies on account of the absence of evidence of a change in the equilibrium unemployment rate. Nevertheless this is, in fact, an intermediate case in which the statistical results are in between the two neat cases leading to relatively safe recommendations. To the extent that this intermediate po-sition is highly dependent on the statistical robustness of the results, these cases should be interpreted with more caution than the others (seeTables 1 and 2).
uncoordinated policy making can lead to more reform as countries attempt to protect themselves from others' beggar-thy-neighbour policies (Sibert and Sutherland, 2000).
Overall, the effects of the EMU on the national labour markets remain a contentious issue calling for further analysis to conclude whether the unemployment behaviour across euro zone countries has changed as a consequence of the introduction of the single currency or, rather, it is a phenomenon observed in some, but not all, EMU countries.
2.2. The crisis
Another strand of the literature claims that the recent economic crisis has had an unequal impact on the EU labour markets. As stated above, periphery countries with serious debt sustainability problems have been severely affected in terms of job destruction. In addition, as suggested byTridico (2013), those countries that pursued a model based onflexibility alone (Ireland, Spain and the United Kingdom, for example) experienced a worse labour market performance. Some of the EU western countries (France, Italy, Portugal, Spain, Sweden and the United Kingdom) suffered a double dip, Greece and Ireland experi-enced multiple dips, whereas the rest of the EU western economies have had at least one year of output contraction. The question now is whether the effects coming from the crisis have translated into structur-al breaks on unemployment and for which countries.
Thefinancial nature of the crisis may have also an important role in the behaviour of labour markets through the decline in output and in-vestment associated with heightened uncertainty, higher risk premia, and tighter lending standards (Hall, 2009). As suggested byCalvo et al. (2012),financial crises tend to be followed by jobless recoveries in the presence of low inflation, and by significant lower real wage recoveries in the presence of high inflation. Persistent shocks in the presence of jobless recoveries can lead to an increase in both long-term and structural unemployment. Boeri et al. (2013) find that
financial recessions amplify labour market volatility and Okun's elasticity over the business cycle.
Overall, the labour market impact of the crisis is still calling for attention, especially with regard to its disaggregated impact by groups, and its youth bias.
3. Unemployment in Europe: youth versus adult unemployment
Youth unemployment rates in the EU vary widely across countries and regions and have been exacerbated during the crisis increasing from 15.5% in 2007 to 23.5% in 2013, and being generally more than twice as high as the adult unemployment rates. The latter can be partly explained because of a smaller youth labour force. However, official youth unemployment rates are also likely to be an underestimate measure of the true problem since the discouraged worker effect is higher for youngsters given that they can opt to continue their education or simply live with their families. These options reduce robust search efforts iffinding a job is difficult, and can potentially lead to the so-called NEET.
Youth unemployment responds to the same two main drivers of (adult) unemployment, as discussed inSection 2; that is, business cycles and the institutional setup as well as features of the labour market. However, the impact of these factors can be different for youth and adult unemployment. According toRyan (2001), youth unemployment tends to be super-cyclical, meaning that it is more sensitive to the business cycle than adult unemployment.IMF (2014)reports that cyclical factors explain 50% of the changes in youth unemployment rate, while in stressed euro area countries thefigure rises to 70%. The sensitivity of youth unemployment to the business cycle can be explained due to special features of youth employment, such as the concentration of youth employment in cyclically sensitive industries
and in small- and medium-size enterprises (seeOECD, 2006; Scarpetta et al., 2010; European Commission, 2013).
Labour market characteristics can also have an impact on youth unemployment for the following two reasons: First, youth population have lower levels of human capital, skills and generic and job-specific work experience. As a consequence, youth productivity is lower and they are more exposed to long-term unemployment, unstable and low-quality jobs, and perhaps social exclusion (OECD, 2005). In the specific case of Europe,Pastore (2015)argues that the youth experience gap is the key factor to understand why youth unemployment in Europe is much higher. Secondly, the institutional framework is also relevant through the existence of dual labour markets and temporary jobs (Bertola et al., 2007; Nunziata and Staffolani, 2007), hiring and
firing regulations, minimum wages relative to the median wage and
firing costs (Neumark and Wascher, 2004; Bernal-Verdugo et al., 2012), unionization (Bertola et al., 2007), or the school-to-work-transition (Ryan, 2001) and the university-to-work-transition (Sciulli and Signorelli, 2011) institutions.
4. Data and computation of monthly structural unemployment
The data employed in this study consists of monthly observations for overall, adult and youth unemployment in Austria, Belgium, Denmark, Finland, France, Germany, Ireland, Italy, Luxembourg, the Netherlands, Norway, Portugal, Spain, Sweden and the United Kingdom. The source of the data is Eurostat. The sample period runs from January 1993 to September 2013. The choice of the start date January 1993 is based on the fact that the data at this frequency is only available from this point in time. Incidentally, the start date corresponds to the launch of the common market within the European Economic Community.
Actual unemployment rates are traditionally decomposed into
‘structural’and‘cyclical’unemployment. Structural unemployment is the rate of unemployment that would be observed if the economy were not hit by shocks (either demand or supply shocks), if inflation were held at a low steady state, and the economy grew smoothly. Hence, structural unemployment reflects a range of structural factors such as the efficiency of the labour market, the demographic features of the labour force, or the labour market institutions, and is attained when the economy comes to rest at potential output. Cyclical unem-ployment is the higher (lower) unemunem-ployment due to a recession (or boom) and results therefore from shocks.
FollowingShimer (2005), and subsequent studies, monthly struc-tural unemployment in this paper is obtained using the Hodrik–Prescott (HP)filter. This approach opens up the issue of how the notion of struc-tural unemployment can be best studied in an empirical sense. It is well-known that a variety of related concepts–such as Natural Rate of Unemployment, NAIRU, steady state, frictionless equilibrium–coexist in the literature. A variety of methods, ranging from the estimation of structural models to thefiltering of the unemployment series (using various techniques), have been employed to provide empirical estima-tions of these concepts. Here we use the HPfilter for the following two reasons.
First, the use of monthly data for 16 countries prevents considering standard institutional controls used, for example, infive-years average panel data estimation. Even the use of quarterly data would greatly reduce the availability of suitable controls and, thus, the possibility of using alternative methods. However, given that we are interested in considering a meaningful period (our sample starts at the inception of the European common market, the integration stage before the EMU), using monthly data provides us with enough degrees of freedom to conduct our analysis.
Secondly, a very popular strand of the literature using the Diamond–Mortensen–Pissarides framework has proceeded in the same way allowing us to compare ourfindings. The difference is that in such search-and-matching models, à laShimer (2005)and beyond, it is the structural component that is removed from the
analysis (and the business cycle component that is retained), while in this study we are interested in the structural part of the unemployment rate series. Here it should be noted that the sensitivity of the results to the HPfilter is greatly reduced as it is the trend component that is being retained and analysed. Moreover, irrespective of the method, we are interested in comparing the outcome of our time series analysis for the adult and youth unemployment rates across 16 economies. Thus, comparability is granted provided the same method is used for the different series, as it is obviously done here.
5. Econometric methodology
To estimate trends in unemployment data for the various countries chosen in this study, we consider the following model:
UNEMPt¼αþβtþut; ut¼ψut−1þεt; ð1Þ
whereUNEMPdenotes the unemployment rate,utmeasures the
devia-tion from trend, which is described in this case as an AR(1) process.2The
parameterβ, which measures the trend, is the hypothesis of interest. If the trend is significant, that is, we rejectH0: (β= 0), then we proceed to
observe (i) whether the trend is negative, that is (βb0), to conclude that the unemployment rate has fallen over time, or (ii) whether the trend is positive, that is (βN0), to conclude that the real unemployment rate has increased over time.
Consider the model given byEq. (1)where the error term is
speci-fied as an AR(1) model. The weighted least squares (WLS) is calculated using the following:
μW¼∑^ut^ut−1= ∑^u2tþ1=T∑^u 2 t
ð2Þ
whereμWdenotes the weighted least square estimate andTdenotes
the total number of observations in the sample. FollowingRoy and Fuller (2001), we obtain the unbiased estimates^μUB, and following
Andrews (1993)the median unbiased estimatesμMU^ are calculated.
Perron and Yabu (2009a)then obtain the following super-efficient estimate as follows:
^
μUS¼ ^μUBifμUB^ −1NT− 1=2 1 ifμUB^ −1≤T−1=2 ( ð3Þ or, ^ μMS¼ μMU^ ifμMU^ −1NT−1=2 1 if^μMU−1≤T−1=2 ( ð4Þ
whereμUS^ and orμMS^ are the super-efficient estimates based on the unbiased estimate and the median unbiased estimate respectively. The Feasible Generalised Least Square (FGLS) procedure is applied to obtain the estimate of the trend parameterβand construct the FGLS t–statistic for the unbiased and median unbiased estimate; that is,tβF(UB) andtβF(MU) respectively.
However, if the errors inEq. (1)are a higher order than AR(1), the estimateμ^is obtained from the following regression:
^
ut¼μu^t−1þ∑ k i¼1ςiΔ^
ut−iþetk ð5Þ
The lag lengthkis selected using the Modified Akaike Information Criterion (MAIC) followingNg and Perron (2001)withkallowing to be in the range [0, 12(T/100)1/4]. The weighted symmetric least squares estimator ^μW is constructed for an AR(p) process
[seeFuller (1996, p. 415)]. The truncated estimate μMU^ (median unbiased estimator) or^μUB(unbiased estimator) is then applied to obtain the super-efficient unbiased estimateμUS^ or super-efficient median unbiased estimate^μMSusingEq. (3)orEq. (4)respectively. Finally, the quasi-FGLS procedure is applied to obtain the estimate of the trend parameterβand construct the Robust Quasi-FGLS t-sta-tistic for the unbiased and median unbiased estimate, that is,tβ -RQF
(UB) andtβRQF(MU) respectively.Perron and Yabu (2009a)show
that for a similar sample size as chosen in this study, thetβRQF(MU)
has some liberal size distortions in comparison to thetβRQF(UB).
Whenψ= 1,tβRQF(MU) andtβRQF(UB) have similar power; however,
whenψ departs from unity tβRQF(MU) has comparatively higher
power. For brevity, in this paper we estimate the median unbiased estimate only.3
So far, the economic literature have proposed and applied different unit root tests with and without structural breaks. Usually we do not know in advance whether the time series are affected by structural breaks, which conditions the analysis that can be conducted using unit root tests. Thus, if breaks are not accounted for when in fact they have affected the time series, the unit root tests can be biased towards the non-rejection of the null hypothesis of unit root. On the other hand, allowing for inexistent breaks when computing the unit root tests can imply reductions in the empirical power of the statistics. This issue has been recently addressed inPerron and Yabu (2009b)allowing for breaks in the level and slope of the trend function given byEq. (1).
Perron and Yabu (2009b)find that the exponential functional of the Wald test has a limiting distribution that is nearly the same for both I(0) and I(1) variables. FollowingRoy and Fuller (2001), a biased corrected version of the least squares estimate ofμ^is carried out to allow for good size and power properties infinite samples.Perron and Yabu (2009b)design a test statistic—hereafter, theExp−Wbreak test statistic—that allows to test if there is a structural break affecting the time trend of the data series regardless of whether the series is I(0) or I(1).4The test is as follows:
Exp−W¼ ln 1 T∑exp 1 2Wð Þλ ð6Þ
whereλdenotes the break fraction andWdenotes the Wald statistic. In this paper, we have computed theExp−Wbreak test statistic consider-ing the model that allows for changes both in the level and the slope of the time trend, which is the most general specification.
In the spirit ofPerron and Yabu (2009b), a sequential procedure is proposed byKejriwal and Perron (2010)that allows one to obtain a con-sistent estimate of the true number of breaks irrespective of whether the errors are I(1) or I(0). Thefirst step is to conduct a test for no break versus one break. Conditional on a rejection, the estimated break date is obtained by a global minimization of the sum of squared residuals. The strategy proceeds by testing each of the two segments (obtained using the estimated partition) for the presence of an addition-al break and assessing whether the maximum of the tests is significant. Formally, the test of one versus two breaks is expressed as:
ExpWð2j1Þ ¼max1≤i≤2 ExpWð Þi
n o
ð7Þ whereExpW(i)is the one break test in segmenti. We conclude in favour
of a model with two breaks ifExpW(2| 1) is sufficiently large.
2
This assumption is relaxed in the following econometric analysis to allow for a general AR(p) process. To keep the description of the econometric methodology simple, we as-sume an AR(1) process at this stage.
3
We conducted the analysis and the unbiased estimates are broadly the same; the re-sults are available upon request.
4 It is important to note that the literature on unit root testing continues to develop so that the biases of the early test towards the non-rejection of the null hypothesis are re-duced at the same time that there is no loss of power. An example of this new wave of unit root tests is the one developed byNarayan and Popp (2010)allowing for structural breaks in level and slope at unknown times.
6. Empirical results
The full set of empirical results obtained from applying this methodology is presented in the Appendix. Thefirst set of tables shows the number of breaks and their corresponding dates for the trend components of total unemployment (Table A1), youth unemployment (Table A2), and adult unemployment (Table A3). In each of the tables the exponential Wald test (ExpW) statistics are calculated,first allowing for one break using thePerron and Yabu (2009b)test. If a break is found we then adopt the sequential break test due toKejriwal and Perron (2010). The number of breaks is listed in the designated column inTables A1 to A3and the prepon-derance of breaks is noted to fall around the introduction of the EMU or the occurrence of thefinancial crisis.Tables A4 to A6show, respectively, the slope changes in the individual regimes that are demarcated by the structural breaks. What is interesting to note, is that the results are varied with no common pattern. However, it is clear that the sample period considered is characterised by broken trends that could be positive, negative or insignificant. Given the density of this information,Table A7provides a qualitative summary of the results presented inTables A1 to A6. The results obtained raise some significantfindings as follows.
First, the analysis based on the aggregate unemployment rate fails to uncover significant differences in the unemployment dynamics of the youth and adult unemployment rates.
Secondly, wefind the existence of a similar number of structural breaks when adult and youth unemployment rates are examined. Therefore, there is no evidence that thetrend componentof the youth unemployment rate is more responsive than the adult one. In other words, differences between aggregate and youth unemployment take the form of enhanced volatilities in response to temporary shocks (as the literature has shown), but do not show up, as a general feature across countries, in the form of different intensities in their response to structural breaks.
Thirdly, a significantfinding is that a structural break occurred in the aftermath of the Eurozone creation in January 1999 and affected adult unemployment rates in the Continental European countries (Belgium, Germany, Finland, Luxembourg, and Netherlands), together with Portugal. Moreover, this break entailed a significant slope change with the exception of Belgium. Note that these are, in general, economies that undertook significant reforms at the time. For example, Germany with the Act on part-time work andfixed term employment relation-ships (Gesetz uber Teilzeitarbeit und befristete Arbeitsvertrage) passed in December 2000, followed by the Hartz reforms; the Netherlands with the Part-Time Employment Act passed in February 2000 as part
of the framework Work and Care Act; or Finland with Act n. 55/2001 to reform the Employment Contracts Act or Act n. 944/2003 to create individualised programmes for all long-term unemployed.
Regarding youth unemployment, Belgium, Germany and the Netherlands also experienced a structural break with slope change, while the rest did not. On the contrary, Southern European periphery economies did not experience the EMU break in terms of unemploy-ment. This group is made of the PIIGS (Portugal, Ireland, Italy, Greece and Spain) plus France, but may also be defined as including the Club-Med countries together with Ireland. Our hypothesis is that this cluster is made of the economies that experienced more pressure to comply with the Maastricht Criteria, since they were economies with a wider gap with respect to the leading ones (mainly in the Continental European group).
Finally, Austria, which is not clustered with the Continental European economies by the tests (neither when its youth or when its adult unemployment rates are examined), and Luxembourg (clustered with the PIIGS when the youth unemployment rates are examined), record poorfigures for youth unemployment (Fig. 2) between 1999 and 2014, even though they appear to do rather well in terms of adult unemployment (Fig. 1). During these years, youth unemployment doubled in Austria (from 5% to 10%) while it more than tripled in Luxembourg (from 7% to 22%). If we add the PIIGS, we have the set of economies where youth population has suffered the most with respect to the unemployment problem in the Euro years.
Our results may be compared with those inRomero-Ávila and Usabiaga (2008, 2009), who study the main unemployment paradigms over the period 1976 to 2004 by employing panel stationarity tests due toCamarero et al. (2006)andCarrion-i-Silvestre et al. (2005)allowing for an unknown number of endogenous structural breaks. While their chosen time-period does not match with our study, interestingly, the timing of the breaks around 1999 is reflected in both studies. As noted byRomero-Ávila and Usabiaga (2009), their methodology requires elimination of endpoints (due to a 15% trimming) preventing them from detecting structural breaks associated with some institutional reforms aimed at making European labour markets more flexible which took place after 1999.
The second major structural break took place around 2008 with the onset of the worldwide Financial Crisis and the subsequent Sovereign-Debt crisis in the Eurozone countries. This break, in contrast to the EMU one, is found to severely affect the Club-Med countries, France and the PIIGS (with the exception of Portugal), together with Austria and the Netherlands. This is the group of economies with a structural break affecting their adult unemployment rates and causing significant slope changes in the corresponding new unemployment regimes. On
Fig. 3.Youth participation rates (%). Source: Eurostat.
the contrary, Belgium, Germany and Luxembourg have not experienced a regime change, while the one in Finland was not significant. The ab-sence of Netherlands in this group is explained by the fact that a relatively large part of the economic shock was translated into unemployment (de Graaf-Zijl et al., 2015).
This result may be connected with the intensity of the Sovereign-Debt crisis. Together with Portugal, whose labour market has always evolved remarkably well relative to the Spanish one, which is very similar (seeBlanchard and Jimeno, 1995), the Club-Med countries are the ones that have suffered the Great Recession more intensively. Note that these are, precisely, the economies that did not embark in institutional reforms at the start of the EMU period and were, thus, less prepared to compete without the possibility of currency devaluations. In the absence of such reforms and divergence in the degree of competitiveness (as indicated, for example, by the evolu-tion of the real unit labour costs as it has been shown byOrdóñez et al., 2015), they became highly indebted economies;first at the private level, then at the public one, so that the impact of the Great Recession was reflected, among other things, in new and higher unemployment rate regimes.
The most salient result regarding this second major shock is related to the youth unemployment rates, which show a complete absence of
evidence that the Euro and Financial crisis break has caused a regime change in this segment of the labour market. Although, atfirst sight, it would be tempting to see this result as positive (to the extent that larger structural youth unemployment rates seem to have been avoided), we claim that it brings truly bad news.
The reason of our pessimist assessment lies on the fact that al-though youth are not as much caught into long-term unemployment as adults, they may end up in a worse situation. Thefirst reason is that the youth have the possibility of temporarily leaving the labour market, as they have done in response to the crisis. As shown in
Fig. 3, the youths in the EU have reduced their participation rates more intensively in the economies where youth unemployment has worsened (recallFig. 2). This is clearly the case of the PIIGS and Luxembourg, which is the country with the lowest youth participa-tion rate (26%), then followed by Italy. Further, it should be noted that some of the most affected economies had much higher partici-pation rates in 1999 (Ireland 54%, Portugal 47%, Spain 43%) than today, and even that these participation rates were close to the ones in Germany (stable at around 50%) and larger than in Belgium or France (where they are below 40%).
The second reason why youth mayfind that their situation deterio-rates, is that a significant proportion of them may abandon the
Fig. 5.PISA scores. 2012.
Source: OECD Programme for International Student Assessment (PISA).
Fig. 4.NEET in 2013.
education system. The growing relevance of this phenomenon has given rise to a significant increase of the NEET, especially in the economies most affected by the crisis (seeO'Higgins, 2015). As shown inFig. 4, this group accounts for around 20% of the persons between 15 and 24 years old in Spain, Greece and Italy, followed by Ireland and Portugal with values around 15%.
7. Discussion and policy implications
Youth unemployment is one of the most worrying legacies of the Great Recession (O'Higgins, 2015). One approach to discuss possible solutions to reduce this problem is to evaluate the specific effectiveness, for the youth, of active labour market policies (ALMPs). An extensive appraisal along these lines has recently been conducted inCaliendo and Schmidl (2016). Another approach is to rely on macro-oriented analysis, such as ours, to elucidate which economies seem to be in need of more intensive structural reforms and whether these reforms should be designed more generically (i.e., for all groups) or more targeted towards some specific groups.
However, general conclusions from macro-oriented analyses are based on thefinding of cross-country asymmetries (for example, in terms of salient increases in structural unemployment rates), and result in economic policy recipes at the country level. This is the case of the studies byFosten and Ghoshray (2011)orSrinivasan and Mitra (2014). For a given country (that is, in a situation in which labour market institutions and regulations are basically shared by both youth and adults), in case of significant group asymmetries, general policy recipes may be of a limited effectiveness. This is the case of the structur-al break related to the Euro/Financistructur-al crisis, which caused a significant
impact on structural adult unemployment in some economies, but did not cause a (significant) structural break in any country in terms of youth unemployment.
Given the associated fall in participation rates and the increases in the youth NEET, we claim that it is essential to complement gener-ic institutional measures with polgener-icies that enhance and improve transitions from the educational system to the labour market. This claim emerges from recognizing the close correlation between those economies having experienced the worse performance of youth unemployment along the Euro and Financial crisis, and those displaying the worst performance on the PISA scores (displayed in
Fig. 5). In addition, we can also signal the case of Sweden, which is close to the bottom in PISA scores (after having fallen successively wave after wave), and has experienced a clear increase from 12% to 23% in youth unemployment.
Of course, one could argue that this is just a one-off observation, but we can extend this analysis to the PIAAC scores, which reflect the average qualification level of the adult population. Since adult population is composed of different cohorts having exited from the educational system in different decades, a positive correlation in this case would probably reflect a more structural relationship between the structural performance of the educational system and the labour market resilience to shocks.
As shown inFig. 6, the PIAAC scores show that the Club-Med eomies are those at the bottom position. At the top of the scale, in con-trast, wefind the Netherlands and Finland, two of the economies with youth unemployment rates that have not changed much between 1999 and 2014 in clear contrast with the PIIGS (recallFig. 2). Also, most Scandinavian countries are perched in the upper position and,
Table 1
Summary of the EMU break.
Eurozone countries Countries not in the Eurozone
With structural break and regimes with significant trend
With structural break and regimes with insignificant trend
With no structural break
With structural break and regimes with significant trend
With structural break and regimes with insignificant trend
With no structural break Adult Germany, Finland, Luxembourg,
Netherlands, Portugal
Belgium Austria, France, Greece, Ireland, Italy, Spain
Norway Sweden U.K., Denmark
Youth Belgium, Germany, Ireland, Netherlands
Austria, France, Greece
Finland, Italy, Luxembourg, Portugal, Spain
Sweden, U.K. Norway, Denmark
Fig. 6.PIAAC scores. 2012.
coincidentally, do not display any sort of youth unemployment problem (with the already mentioned exception of Sweden).
Note, that if we had not conducted a time series analysis separately for youth and adult unemployment rates, we would not have identified the structural breaks in youth unemployment as consequence of the Euro and Financial crisis. It is thisfinding of the preponderance of breaks around these two significant events, that has allowed our analysis to move beyond the standard policy recommendation of implementing structural reforms, and instead focus on the consequences that poor qualifications and a poor performance of the educational system may have for the performance of the labour market. These complementary policies would help to surpass recession periods by minimizing the social and economic costs of youth unemployment and protracted periods of moving out of education and training.5
Related to this discussion, and also connected to the age composition of the workers, the long-term unemployment problem appears as a critical complementary issue. For example, the Netherlands (whose adult unemployment rate appears together with the PIIGS inTable 2) has faced worse long-term unemployment rates than its neighbours. As explained inde Graaf-Zijl et al. (2015), 40% of these unemployed workers are over 50 years old. In contrast, in Denmark (which in
Table 2 is classified as not experiencing a significant structural break in adult unemployment) most unemployment spells are short, and there are no worrying signs of long-term unemployment (Andersen, 2015). Therefore, although youth unemployment is a critical problem, we should not disregard the adverse effects of long-term unemployment on adult population.
8. Conclusions
Aggregate unemployment hides significantly different behaviours in adult and youth unemployment. As a consequence, specific attention needs to be devoted to these two components of unemployment. This paper makes a concerted analysis to analyse these two components separately for various EU countries. Novel methods are employed to detect structural breaks and the preponderance of these breaks are associated to two major single-event shocks occurred in Europe in recent times: the inception of the EMU in 1999 and the Euro and Financial crisis that took place in the aftermath of the burst of the housing andfinancial bubbles in 2008.
Wefind that the structural break associated to the EMU is limited to those economies less affected by the Euro and Financial Crisis. This is in general the case for both adult and youth unemployment rates. In contrast, the structural break associated to the Euro and the Financial Crisis had greater impact on those economies with very poor aggregate
labour market performance such as Ireland, Italy, Greece and Spain. This underscores one of the main conclusions of this study. Economies in the European periphery were to some extent inattentive in preparing themselves for the new scenario brought by the EMU. They were active and successful in securing nominal convergence ex-ante, but the lack of real convergence (for example, in competitiveness, as shown by
Ordóñez et al., 2015) caused very different impacts of the Great Recession on their labour markets.
Nevertheless, in general, youth unemployment rates did not experience significant structural breaks across Europe as a result of the Euro and Financial crisis. This confirms the well-known enhanced volatility of youth unemployment vis-à-vis adult unemployment, and leads us to conclude that underlying this wider volatility there is the possibility, for youth, of responding to shocks without experiencing shifts in structural unemployment. Lower involvement in the labour market (falling participation rates), and lower involvement in education activities (growing NEETs) would be alternative or complementary out-comes to the shifts in structural unemployment experienced by the adult section.
We have also claimed that the relative behaviour of youth unem-ployment across countries is highly associated to the relative performance of the educational system. Although this is not new in the literature, we have uncovered this association as a potentially structural phenomenon, since this seems to hold not only for the youth, but also for adult education. To the extent that adult education involves several generations, this creates a persistent mechanism by which poor educational levels end up affecting labour market perfor-mance in extenso. Microeconomic studies have warned us on the social and economic risks of individuals leaving the educational system at the early stages in their life. Here we complement this fact with an additional warning that emerges from the long lasting effects of a poor educational system: poor educational levels may harm extensively the performance of the labour market. That underlines one of our major conclusions: the educational system is a crucial tool to help restoring socially acceptable youth unemployment rates, which today remain stubbornly at an average of 20% in the Eurozone. We believe this area deserves much more attention from a macroeconomic point of view.
Acknowledgements
The authors acknowledge helpful comments received from the Editor, Paresh Kumar Narayan, and two anonymous referees. Fur-ther, the authors would like to thank Mohitosh Kejriwal for sharing his GAUSS codes. Javier Ordóñez is a member of the INTECO research Group and gratefully acknowledges the support from the Generalitat Valenciana Project Projects PROMETEOII/2014/053 and AICO/2016/ 038, MINECO project ECO2014-58991-C3-2-R and the UJI project P1-1B2014-17. Hector Sala is grateful to the Spanish Ministry of Economy and Competitiveness forfinancial support. The usual dis-claimer applies.
5 Lack and/or shortage of data prevents us from conducting meaningful time series analysis on the causality between indicators of educational performance and youth unem-ployment or youth labour force participation. A panel data analysis would compensate the short time-series with cross-section observations; however, embarking in such a comple-mentary quantitative analysis exceeds the scope of this‘stepping stone’paper.
Table 2
Summary of the euro/financial crisis break.
Eurozone countries Countries not in the Eurozone
With structural break and regimes with significant trend
With structural break and regimes with insignificant trend
With no structural break
With structural break and regimes with significant trend
With structural break and regimes with insignificant trend
With no structural break Adult Austria, France, Greece,
Ireland, Italy, Netherlands, Spain
Finland Belgium, Germany, Luxembourg, Portugal
U.K. Denmark Norway, Sweden
Youth Belgium Austria, Belgium, Germany,
Finland, France, Ireland, Italy, Luxembourg, Netherlands, Portugal, Spain
U.K. Denmark, Norway, Sweden
Table A1
Results for structural breaks tests. Total trend component. Country Test statistics Breaks location
ExpW Exp W (2|1)
No. of breaks
EMU Euro/financial crisis Other Belgium 1.25 1.70 2 2011m7 2001m1 Denmark −0.25 0 Germany 12.24 8.44 2 1999m5 2011m7 Ireland 1.21 15.15 2 1999m7 2006m6 Spain 3.86 4.42 2 1999m10 2007m4 France 3.57 5.16 2 2000m9 2004m2 Italy 0.89 0 Holland 0.29 0 Austria 2.49 8.42 2 2000m4 1997m2 Portugal 12.20 1.34 1 2003m3 Finland 16.79 2.53 2 2001m5 1996m4 Norway −0.14 0 Sweden 0.85 0 Luxembourg 3.52 12.15 2 2007m6 1996m4 UK 1.71 15.19 2 1999m12 2011m7 Greece 7.80 −0.04 1 2001m2
Note: The second and third columns present respectively thePerron and Yabu (2009a) test for one break in the trend (ExpW) and theKejriwal and Perron (2010)test of one ver-sus two breaks (ExpW (2|1)). The conclusion of both tests is shown in the fourth column. The last three columns show the location of the breaks.
Table A2
Results for structural breaks tests. Youth trend component. Country Test statistics Breaks location
ExpW Exp W (2|1)
No. of breaks
EMU Euro/financial crisis Other Belgium 3.31 13.55 2 2001m3 2011m7 Denmark −0.16 0 Germany 8.47 8.69 2 1999m8 1996m4 Ireland 1.15 29.27 2 1999m8 1996m4 Spain −0.22 0 France 5.03 0.23 1 2001m8 Italy 8.10 0.13 1 1997m10 Holland 2.54 2.90 2 2000m2 2003m12 Austria 3.96 66.92 2 2000m4 1997m2 Portugal 11.68 0.14 1 2002m6 Finland 16.41 0.47 1 2002m1 Norway 0.004 0 Sweden 3.20 3.56 2 2000m2 2005m8 Luxembourg 0.24 0 UK 14.12 11.52 2 2000m1 2011m5 Greece 10.15 16.09 2 2001m10 2004m4
Note: The second and third columns present respectively thePerron and Yabu (2009a, 2009b)test for one break in the trend (ExpW) and theKejriwal and Perron (2010)test of one versus two breaks (ExpW (2|1)). The conclusion of both tests is shown in the fourth column. The last three columns show the location of the breaks.
Table A3
Results for structural breaks tests. Adult trend component. Country Test statistics Breaks location
ExpW Exp W (2|1)
No. of breaks
EMU Euro/financial crisis Other Belgium 19.56 67.65 2 2000:6 1996:9 Denmark 42.97 98.56 2 2007:5 1997:2 Germany 134.26 73.95 2 2001:8 2004:12 Ireland 69.56 163.68 2 2011:7 2004:11 Spain 213.03 46.01 2 2011:7 2006:11 France 56.11 105.48 2 2007:9 1996:9 Italy 155.02 99.15 2 2008:4 1997:8 Holland 33.17 159.83 2 2000:4 2010:10 Austria 15.85 159.48 2 2008:9 2003:10 Portugal 30.08 91.06 2 2001:2 1996:3 Finland 138.06 170.16 2 2000:6 2007:12 Table A3(continued)
Country Test statistics Breaks location ExpW Exp W
(2|1) No. of breaks
EMU Euro/financial crisis Other Norway 166.65 135.82 2 1999:2 2003:2 Sweden 18.68 227.16 2 2000:11 1997:2 Luxembourg 65.77 148.82 2 2001:2 2004:6 UK 86.85 277.44 2 2011:7 2003:6 Greece 272.82 42.64 2 2007:1 2003:12
Note: The second and third columns present respectively thePerron and Yabu (2009b) test for one break in the trend (ExpW) and theKejriwal and Perron (2010)test of one versus two breaks (ExpW (2|1)). The conclusion of both tests is shown in the fourth column. The last three columns show the location of the breaks.
Table A4
Slope estimates. Total trend component.
Country Regime 1 Regime 2 Regime 3 Belgium −0.057 (−0.0791,−0.0355) 0.0634 (0.0406, 0.0862) −0.1923 (−0.4155, 0.0309) Denmark −0.0401 (−0.313, 0.2328) Germany −0.1318 (−0.2237,−0.0398) 0.0034 (−0.0038, 0.0107) 0.1231 (−0.2254, 0.4761) Ireland −0.0803 (−0.1120,-0.0485) −0.0024 (−0.0073, 0.0024) 0.047 (0.0339, 0.0601) Spain −0.0025 (−0.0687, 0.0638) −0.0382 (−0.057,−0.019) 0.0367 (0.0004, 0.0729) France −0.0382 (−0.101, 0.0253) −0.01 (−0.0177,−0.0023) 0.0493 (0.0384, 0.0603) Italy 0.0068 (−0.0126, 0.0262) Holland 0.0126 (−0.0186, 0.0438) Austria −0.0327 (−0.1037, 0.0383) −0.0568 (−0.1961, 0.0826) 0.0006 (−0.009, 0.103) Portugal −0.0486 (−0.0989, 0.0016) 0.0856 (−0.7175, 0.8887) Finland −0.068 (−0.1689, 0.033) −0.0491 (−0.0541,−0.0441) 0.015 (0.013, 0.0169) Norway −0.0207 (−0.2098, 0.1684) Sweden −0.024 (−0.0655, 0.0174) Luxembourg −0.0948 (−0.1966, 0.0071) −0.0068 (−0.0346, 0.021) 0.0236 (0.0166, 0.0305) UK −0.0711 (−0.1419,−0.0003) 0.0109 (0.000, 0.0217) 0.1564 (0.0128, 0.3001) Greece −0.0176 (−0.0362, 0.0010) 0.0010 (−0.0083, 0.0103)
Note: This table shows the change in the slope of the trend as a consequence of the estimated structural breaks. Numbers in parentheses denote 90% confidence intervals. Significant slope estimates denoted in bold.
Table A5
Slope estimates. Youth trend component.
Country Regime 1 Regime 2 Regime 3 Belgium −0.0836 (−0.1087,−0.0585) 0.143 (0.0045, 0.2832) −0.6128 (−1.572, 0.3471) Denmark −0.0786 (−0.4808, 0.3236) Germany 0.1273 (−0.3571, 0.1025) −0.7138 (−1.08,−0.3475) 0.0855 (0.039, 0.1315) Ireland −0.203 (−0.2699, 0.2107) −0.4511 (0.7622,−0.1401) 0.0726 (0.0149, 0.1304) Spain 0.0423 (−0.0579, 0.1426) France −0.1006 (−0.1391,−0.0621) 0.1962 (−0.1359, 0.5283) Italy −0.0528 (−0.1055,−0.0001) −0.0598 (−0.0956,−0.0239) Holland −0.0908 (−0.3418, 0.16) 0.0711 (0.062, 0.0802) 0.163 (0.0392, 0.2869) Appendix A
References
Andersen, T.M., 2015.The Danishflexicurity labour market during the Great Reces-sion. De Economist 163, 473–490.
Andrews, D.W.K., 1993.Tests for parameter instability and structural change with unknown change point, Econometrica. Econometric Society 61 (4), 821–856. Barslund, M., Gross, D., 2013.Unemployment is the scourge, not youth unemployment
per se: the misguided policy preoccupation with youth. CEPS Policy Briefs. Centre for European Policy Studies, Brussels.
Bean, C.R., 1994.European unemployment: a survey. J. Econ. Lit. 32 (2), 573–619. Bernal-Verdugo, L.E., Furceri, D., Guillaume, D., 2012.Labor marketflexibility and
unemployment: new empirical evidence of static and dynamic effects. Comp. Econ. Stud. 54, 251–273.
Bertola, G., Blau, F.D., Kahn, L.M., 2007.Labor market institutions and demographic em-ployment patterns. J. Popul. Econ. 20 (4), 833–867.
Blanchard, O.J., 2006.European unemployment: the evolution of facts and ideas. Econ. Policy 5–59 (January).
Blanchard, O.J., Jimeno, J.F., 1995.Structural unemployment: Spain versus Portugal. Am. Econ. Rev. 85 (2), 212–218.
Blanchard, O.J., Summers, L.H., 1986.Hysteresis and the European unemployment prob-lem. In: Fischer, S. (Ed.), NBER Macroeconomics Annual 1986. MIT Press, Cambridge, MA.
Blanchard, O.J., Summers, L.H., 1987.Hysteresis in unemployment. Eur. Econ. Rev. 31, 288–295.
Boeri, T., Garibaldi, P., Espen, M.R., 2013.Financial shocks and labor: facts and theories. IMF Econ. Rev. 61, 631–663.
Caliendo, M., Schmidl, R., 2016.Youth unemployment and active labor market policies in Europe. IZA J. Labor Policy 5 (1), 1–30.
Calmfors, L., 2001.Wages and wage-bargaining institutions in the EMU—a survey of the issues. Empirica 28 (4), 325–351.
Calvo, G.A., Corelli, F., Ottonello, P., 2012.The labor market consequences offinancial crisis with or withoutinflation: jobless and wageless recoveries. NBER Working Paper No. 18480. National Bureau of Economic Research, Cambridge, MA.
Camarero, M., Carrion-i-Silvestre, J.L., Tamarit, C., 2006.Testing for hysteresis in unem-ployment in OECD countries. New evidence using stationarity panel tests with breaks. Oxf. Bull. Econ. Stat. 68, 167–182.
Carrion-i-Silvestre, J.L., del Barrio, T., López-Bazo, E., 2005.Breaking the panels: an appli-cation to the GDP per capita. Econ. J. 8, 159–175.
Cukierman, A., Lippi, F., 2001.Central bank independence, centralization of wage bargaining, inflation and unemployment: theory and some evidence. Eur. Econ. Rev. 43 (7), 1395–1434.
De Graaf-Zijl, M., van der Horst, A., van Vuuren, D., Erken, H., Luginbuhl, R., 2015. Long-term unemployment and the Great Recession in the Netherlands: economic mecha-nisms and policy implications. De Economist 163, 415–434.
European Commission, 2013.Labor Market Developments in Europe 2013. European Economy 6/2013.
Fosten, J., Ghoshray, A., 2011.Dynamic persistence in the unemployment rate of OECD countries. Econ. Model. 28 (3), 948–954.
Fuller, W.A., 1996.Introduction to Statistical Time Series. 2nd Edition. Wiley 978-0-471-55239-0.
Hall, R.E., 2009.By how much does GDP rise if the government buys more output? Brookings Papers on Economic Activity, Economic Studies Program 40. The Brookings Institution, pp. 183–249 (2 (Fall)).
IMF, 1999.Chronic unemployment in the Euro area: causes and cures. World Economic Outlook, May 1999. IMF.
IMF, 2014.Youth unemployment in Europe: Okun's law and beyond. IMF Country Report No. 14/199. IMF.
Kejriwal, M., Perron, P., 2010.A sequential procedure to determine the number of breaks in trend with an integrated or stationary noise component. J. Time Ser. Anal. 31, 305–328.
Layard, R., Nickell, S.J., Jackman, R., 1991.Unemployment, Macroeconomic Performance and the Labour Market. Oxford University Press, Oxford.
Leybourne, S.J., Mills, T.C., Newbold, P., 1998.Spurious rejections by Dickey–Fuller tests in the presence of a break under the null. J. Econ. 87, 191–203.
Ljungqvist, L., Sargent, T.J., 1998.The European unemployment dilemma. J. Polit. Econ. 106 (3), 514–550.
Narayan, P.N., Popp, S., 2010.A new unit root test with two structural breaks in level and slope at unknown time. J. Appl. Stat. 37 (9), 1425–1438.
Table A5(continued)
Country Regime 1 Regime 2 Regime 3 Austria 0.413 (0.0827, 0.7443) 0.0108 (−0.4104, 0.432) −0.0074 (−0.0304, 0.0155) Portugal −0.1567 (−0.2456,−0.0677) 0.1236 (−0.2859, 0.5332) Finland −0.0736 (−0.0861,−0.0611) 0.0032 (−0.0744, 0.0809) Norway −0.0329 (−0.3081, 0.2422) Sweden −0.1729 (−0.3496, 0.0038) 0.1184 (0.0896, 0.1473) 0.0147 (−0.0251, 0.0546) Luxembourg 0.0416 (−0.009, 0.0924) UK −0.1105 (−0.263, 0.0418) 0.0379 (0.0339, 0.0419) 0.0103 (−0.1533, 0.1739) Greece 0.0533 (−0.239, 0.128) 0.0853 (−0.168, 0.338) 0.0032 (−0.0112, 0.0176) Note: This table shows the change in the slope of the trend as a consequence of the estimated structural breaks. Numbers in parentheses denote 90% confidence intervals. Significant slope estimates denoted in bold.
Table A6
Slope estimates adult unemployment.
Country Regime 1 Regime 2 Regime 3 Belgium 0.0295 (0.023, 0.028) −0.0457 (−0.047,−0.044) 0.008 (−0.009, 0.025) Denmark −0.085 (−0.094,−0.075) −0.015 (−0.026,−0.001) 0.025 (−0.009, 0.061) Germany 0.005 (−0.008, 0.018) 0.048 (0.033, 0.064) −0.046 (−0.076,−0.016) Ireland −0.071 (−0.130,−0.0118) 0.119 (0.100, 0.137) −0.085 (−0.088,−0.0817) Spain −0.055 (−0.142, 0.031) 0.233 (0.127, 0.34) 0.061 (0.041, 0.08) France 0.019 (0.016, 0.021) −0.021 (−0.056, 0.012) 0.028 (0.025, 0.031) Italy 0.041 (0.035, 0.046) −0.024 (−0.044,−0.003) 0.072 (0.061, 0.083) Holland −0.032 (−0.036,−0.028) 0.008 (0.002, 0.014) 0.062 (0.06, 0.064) Austria 0.004 (−0.019, 0.028) −0.009 (−0.012,−0.006) 0.015 (0.008, 0.022) Portugal 0.042 (0.034, 0.048) −0.033 (−0.063,−0.0025) 0.054 (0.034, 0.073) Finland −0.069 (−0.078,−0.060) −0.027 (−0.033,−0.021) 0.019 (−0.004, 0.044) Norway −0.044 (−0.045,−0.044) 0.018 (0.013, 0.023) −0.0001 (−0.019, 0.018) Sweden 0.023 (0.018, 0.028) −0.073 (−0.132,−0.013) 0.005 (0.0002, 0.01) Luxembourg −0.005 (−0.07, 0.06) 0.049 (0.044, 0.055) 0.011 (0.006, 0.016) UK −0.042 (−0.053,−0.032) 0.024 (−0.019, 0.068) −0.042 (−0.051,−0.032) Greece 0.063 (−0.041, 0.167) −0.035 (−0.041,−0.031) 0.208 (0.181, 0.236)
Note: This table shows the change in the slope of the trend as a consequence of the estimated structural breaks. Numbers in parentheses denote 90% confidence intervals. Significant slope estimates denoted in bold.
Table A7
Qualitative summary of the results inTables A1–A6.
Country EMU break Euro/financial crisis break Total Adult Youth Total Adult Youth
Belgium No No Yes Yes No No
Denmark No No No No No No
Germany Yes Yes Yes Yes No No
Ireland Yes No Yes Yes Yes No
Spain Yes No No Yes Yes No
France Yes No No No Yes No
Italy No No No No Yes No
Holland No Yes Yes No Yes No
Table A7(continued)
Country EMU break Euro/financial crisis break Total Adult Youth Total Adult Youth
Austria Yes No No No Yes No
Portugal No Yes No No No No
Finland No Yes No No No No
Norway No Yes No No No No
Sweden No No Yes No No No
Luxembourg No Yes No Yes No No
UK Yes No Yes Yes Yes No
Greece Yes No No No Yes No
Note:Yesstands for structural break with statistically significant change in the trending behaviour of unemployment.
Narayan, P.K., Smyth, R., 2004.Crime rates, male youth unemployment and real income in Australia: evidence from Granger causality tests. Appl. Econ. 36 (18), 2079–2095. Neumark, D., Wascher, W., 2004.Minimum wages, labor market institutions, and youth
employment: a cross-national analysis. Ind. Labor Relat. Rev. 57 (2), 223–248. Ng, S., Perron, P., 2001.Lag length selection and the construction of unit root tests with
good size and power. Econometrica 69 (6), 1519–1554.
Nunziata, L., Staffolani, S., 2007.Short-term contracts regulations and dynamic labour de-mand: theory and evidence. Scot. J. Polit. Econ. 54 (1), 72–104.
OECD, 2005.Education at Glance. OECD Publishing.
OECD, 2006.Boosting jobs and growth. OECD Employment Outlook. OECD Publishing (Chapters 3 and 7).
OECD, 2011.Persistence of high unemployment: what risks? What policies. OECD Eco-nomic Outlook Vol. 2011/1. OECD Publishing.
OECD, 2014.An update of the labour market situation. OECD Employment Outlook. OECD Publishing.
O'Higgins, N., 2015.Youth unemployment. IZA Policy Papers No. 103. IZA, Germany. Ordóñez, J., Sala, H., Silva, J.I., 2015.Real unit labour costs in Eurozone countries: drivers
and clusters. IZA J. Eur. Labor Stud. 4 (1), 1–19.
Pastore, F., 2015.The youth experience gap: explaining national differences in the school-to-work transition. Springer Briefs in Economics. Springer (ISBN 978-3-319-10195-8).
Perron, P., 1988.Trends and random walks in macroeconomic time series: further evi-dence from a new approach. J. Econ. Dyn. Control. 12, 297–332.
Perron, P., 1989.The great crash, the oil price shock and the unit root hypothesis. Econometrica 57, 1361–1401.
Perron, P., Yabu, T., 2009a.Estimating deterministic trends with an integrated or station-ary noise component. J. Econ. 151, 56–69.
Perron, P., Yabu, T., 2009b.Testing for shifts in trend with an integrated or stationary noise component. J. Bus. Econ. Stat. 27 (3), 369–396.
Phelps, E.S., 1994.Structural Slumps: The Modem Equilibrium Theory of Unemployment, Interest, and Assets. Harvard University Press, Cambridge, MA, p. 1994.
Romero-Ávila, D., Usabiaga, C., 2008.On the persistence of Spanish unemployment rates. Empir. Econ. 35, 77–99.
Romero-Ávila, D., Usabiaga, C., 2009.The unemployment paradigms revisited: a compar-ative analysis of US States and European unemployment. Contemp. Econ. Policy 27 (3), 321–334.
Roy, A., Fuller, W.A., 2001.Estimation of autoregressive processes with a root near one. J. Bus. Econ. Stat. 19, 482–493.
Ryan, P., 2001.The school-to-work transition: a cross-national perspective. J. Econ. Lit. 39 (1), 34–92.
Scarpetta, S., Sonnet, A., Manfredi, T., 2010.Rising youth unemployment during the crisis: how to prevent negative long-term consequences on a generation? OECD Social, Em-ployment and Migration Working Papers, No. 106. OECD Publishing
Sciulli, D., Signorelli, M., 2011.University-to-work transitions: the case of Perugia. Eur. J. High. Educ. 1 (1), 39–65.
Shimer, R., 2005.The cyclical behavior of equilibrium unemployment and vacancies. Am. Econ. Rev. 95 (1), 25–49.
Sibert, A., Sutherland, A., 2000.Monetary union and labour market reform. J. Int. Econ. 51, 421–435.
Srinivasan, N., Mitra, P., 2014.The European unemployment problem: its cause and cure. Empir. Econ. 47 (1), 57–73.
Tridico, P., 2013.The impact of the economic crisis on EU labour market: a comparative perspective. Int. Labour Rev. 154 (2), 175–190.
Valadkhani, A., Smyth, R., 2015.Switching and asymmetric behaviour of the Okun coeffi -cient in the US: evidence for the 1948–2015 period. Econ. Model. 50, 281–290. Vogelsang, T.J., 1998.Trend function hypothesis testing in the presence of serial