Swarm Offshore Malta: Analysis on Felt
Reports
Matthew R. Agius, Sebastiano D’Amico and Pauline Galea
1
Introduction
Malta is a small archipelago, with a land mass covering a total area of 316 km2in the Sicily Channel, located between Sicily, Tunisia and Libya (Fig. 1). Local seismicity occurs offshore and is considered to be low when compared to the seismicity of other regions in the Mediterranean such as Italy or Greece (Vannucci et al.2004). Despite the numerous local and regional earthquakes recorded by the seismograph located in the south of the islands (Boschi and Morelli1994), very few earthquakes are actually felt. Until recently, such felt tremors were only reported in the local newspapers, giving limited qualitative and quantitative information about the shaking experience felt across the various localities. Historical records, how-ever, indicate that Malta is susceptible to stronger shaking of higher intensity, powerful enough to damage buildings (Fig. 1, Galea 2007), such as the 1693 earthquake in south-eastern Sicily (e.g., Boschi et al. 2000). How such shaking would affect Maltese society today, taking into consideration the rapid urbanisation that has taken place on the islands in the last century, is still relatively unknown.
In order to better assess the shaking intensity of an earthquake on the Maltese islands, the Seismic Monitoring and Research Unit (SMRU) at the Department of Physics of the University of Malta has since 2007 set up a dedicated online page for the local community to report their earthquake experiences. The reported felt effects, and any damage are then manually translated into an intensity value on the European Macroseismic Scale 1998 (EMS-98, Grünthal et al.1998). Ideally, in the case of a strong earthquake, the long established practice is of trained personnel to
M.R. Agius (&)S. D’AmicoP. Galea
Department of Geosciences, Faculty of Science, University of Malta, Msida, Malta e-mail: [email protected]
S. D’Amico
e-mail: [email protected]
©Springer International Publishing Switzerland 2016
S. D’Amico (ed.),Earthquakes and Their Impact on Society,
Springer Natural Hazards, DOI 10.1007/978-3-319-21753-6_27
make on-site inspections (e.g., Dandoulaki et al. 1998; Karababa and Pomonis
2010), however, detailed assessment of an entire locality on a macro scale is a time-consuming process. Online questionnaires are an alternative assessment on a local scale, especially when there is no structural damage. The compilation of such data reports is generally used to plot intensity maps, such as ShakeMaps (Wald et al.2006), to better visualise the felt effects of the earthquake. Intensity maps are also used in conjunction with other studies such as ground acceleration, civil engineering, disaster management and civil protection.
Here we present a summary of felt reports for an earthquake swarm that occurred on Easter Sunday of 2011, felt widely across Malta. The compilation of the data is a first of its kind for the islands. The data reflects the demographics as well as the different types of buildings found across the archipelago.
Felt earthquakes on Malta
10˚ 10˚ 20˚ 20˚ 30˚ 30˚ 32˚ 32˚ 40˚ 40˚
Felt earthquakes on Malta
10˚ 10˚ 20˚ 20˚ 30˚ 30˚ 32˚ 32˚ 40˚ 40˚ Malta M e d i t e r r a n e a n S e a
EMS−98 intensity of felt tremors I < V V≤I< VI I≥ VI (2008−2014) (1542−1972) (1542−1972) Earthquake magnitude 4 6 7
Fig. 1 Map of earthquake epicentres that were felt or produced damage on Malta and their
corresponding felt intensities based on the European Macroseismic Scale 1998 (Grünthal et al.
1998). Data of felt earthquakes prior 1972 are from Galea (2007). Recent felt reports are from
2
Earthquake Sequence Over the Easter Weekend
An earthquake swarm is different from an aftershock sequence. The latter contains a mainshock followed by a sequence of aftershocks of ever-decreasing magnitude, whereas a swarm shows no particular pattern of magnitude variation with time, and the largest shock may occur anywhere in the sequence. The occurrence of earth-quake swarms is quite common in the vicinity of the Maltese islands, especially on the offshore fault systems to the south. Historical documentation also records the occurrence of a number of earthquake swarms that were felt by the public, such as that between 14th and 21st of August, 1886. About 16 events in this sequence were large enough to be felt. The strongest shock made most of the residents run out onto the streets at night and caused general alarm among the population, to the extent that public calls for prayer and adoration were made and churches remained open throughout the night (The Malta Times, Saturday 21/08/1886). Numerous other small swarms have been recorded instrumentally in recent years but many of them were unfelt.
The swarm under consideration here started early on Easter Sunday (00:10 local time) and continued for at least three days. The largest event in the swarm occurred on Sunday 24th of April 2011 at approximately 13:02 UTC (15:02 local time). It is the largest magnitude earthquake to occur near the Maltese islands in the past decade, estimated to be of a local magnitude (ML) 4.1 (D’Amico2014). Figure 2
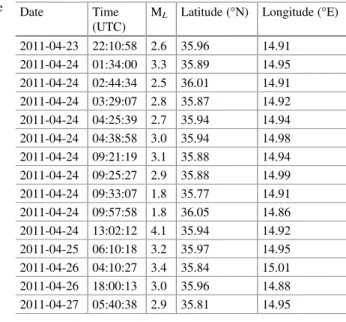
shows the recorded seismic activity throughout the day on Sunday 24th of April. The detection and location of many of the earthquakes in the swarm were limited due to the small magnitudes and poor seismic station coverage. With only one nearby station on southern Malta (WDD, Agius et al.2014), the epicentres of these earthquakes could only be analysed using the standard single-station technique: P-wave polarisation analysis used to establish the back azimuth from the station to the source, and the S-P time difference used to infer the distance to the earthquake. Such a technique is implemented in an automated manner at WDD through the software LESSLA (Agius and Galea 2011). All automated locations were also reviewed manually. In total the SMRU detected 15 earthquakes over four days, all located within the same source area about 38 km east of Malta (Table1and Fig.3). Their local magnitudes range from 1.8 to 4.1, with most earthquakes having a magnitude of less than 3.5.
In the case of the largest event, the seismic energy reached farther stations located in the Central Mediterranean area and belonging to different institutions and/or networks (e.g., INGV, MEDNET, NOA, TT). This event has been relocated using the Computer Programs in Seismology location code elocate (Herrmann
2013) by applying a suitable velocity model for the region. D’Amico (2014) obtained a moment tensor solution of the earthquake applying the CAP (Cut-and-Paste) method (Zhu and Helmberger 1996; Tan et al. 2006; D’Amico et al.2010) which is based on modelling of regional waveforms. The source depth, moment magnitude and focal mechanisms are determined using a grid search technique. For any fixed depth, the procedure attempts to find the best fit by
aligning automatically the data with the synthetics. It has been shown that a good focal mechanism estimation can be obtained using a few stations (D’Amico et al.
2011) and the CAP method can be considered a stable and powerful approach to compute moment tensor solutions. For the largest event in the swarm the bestfitting solutions suggests a moment magnitude (MW) of 4.0 orML4.1 and a focal depth of
about 10 km. The bestfitting focal mechanism shows a strike slip solution on a fault plane striking at 187°and dipping at about 71°.
The region of the 2011 swarm is close to a shallow platform, known as Hurd’s Bank (Fig. 3). Published seismotectonic maps (e.g., Gallais et al. 2011) do not indicate any apparent surface feature or fault in this area. In contrast, most of the Sicily Channel is marked by a dense network of normal and strike-slip faults manifesting near surface expression. Instrumentally located seismicity in the area prior to this event shows only a few, sparse earthquakes reported in conventional seismic bulletins. However, it is likely that the 1886 swarm originated in approx-imately the same location as that of the Easter 2011 swarm, since it was similarly
Fig. 2 The 24-hour seismic trace recorded at station WDD on Sunday 24th of April 2011.
A couple of the‘stronger’earthquakes that took place during the day are clearly visible, with the
Table 1 Parameters of all the earthquakes located by the SMRU during the 2011 swarm activity Date Time (UTC) ML Latitude (°N) Longitude (°E) 2011-04-23 22:10:58 2.6 35.96 14.91 2011-04-24 01:34:00 3.3 35.89 14.95 2011-04-24 02:44:34 2.5 36.01 14.91 2011-04-24 03:29:07 2.8 35.87 14.92 2011-04-24 04:25:39 2.7 35.94 14.94 2011-04-24 04:38:58 3.0 35.94 14.98 2011-04-24 09:21:19 3.1 35.88 14.94 2011-04-24 09:25:27 2.9 35.88 14.99 2011-04-24 09:33:07 1.8 35.77 14.91 2011-04-24 09:57:58 1.8 36.05 14.86 2011-04-24 13:02:12 4.1 35.94 14.92 2011-04-25 06:10:18 3.2 35.97 14.95 2011-04-26 04:10:27 3.4 35.84 15.01 2011-04-26 18:00:13 3.0 35.96 14.88 2011-04-27 05:40:38 2.9 35.81 14.95 0 10 20 Distance, km −200 −100 −100 −100 −100 −100 −100
Easter Sunday earthquake swarm: 23−27th April 2011
14˚00' 14˚00' 14˚30' 14˚30' 15˚00' 15˚00' 35˚30' 35˚30' 36˚00' 36˚00' Malta Gozo Valletta Hurd Bank WDD −1000 Bathymetry m Magnitude: 2 3 4
Fig. 3 The epicentres of the 15 earthquakes in the swarm located by the SMRU.Yellow stars:
Earthquake location estimates using single-station analysis on WDD (red triangle) seismic data.
Blue beach ball: The earthquake solution (location marked with theblue line) of the strongest
earthquakeML4.1 (D’Amico2014). Dense contour lines at 10 metres interval up to 100 m depth
show shallow bathymetry. Valletta is the capital city of Malta, surrounded by two harbours.Inset
felt mostly in the eastern half of Malta and hardly felt in Gozo. More long-term monitoring and interpretation of seismic activity in this area, therefore, may shed light on buried, or previously unmapped fault systems.
2.1
Media Coverage and Public Sentiment
The sequence of earthquakes and felt tremors prompted the attention of the media throughout the day. The first report was published on the Times of Malta online page on Sunday 24th of April 2011 at 00:21 local time. The news item was followed by a second article some 2 h later titled“Divorce and earthquake forecast at Borġin-Nadur”. This article featured a story of a lay man who claimed religious apparitions of the Virgin Mary. A few weeks before the earthquake, the man allegedly dictated a message conveyed to him by the holyfigure to his followers:
“The time has come for Malta’s turn to experience the tremors and you shall see buildings shake, especially in that area that your ancestors built for defence: the area around the port”. This claim came at a time when Malta was counting down the days for a national referendum on whether or not to introduce legislation for divorce. The social divide was strong particularly because of the religious senti-ment. The coincidence of the forecast time and location of the earthquake (off the Grand Harbour of Valletta) fuelled the controversy with many suggesting that the prophecy was a sign of God wanting people to vote‘no’ in the upcoming refer-endum. The article was also given full-page prominence in the print edition of The Sunday Times of Malta, on the same day (The Sunday Times2011). Furthermore, three weeks before, another tremor was felt and also reported in the local news, this time from a distant, magnitude 6.1 earthquake in Crete on 1st of April 2011. The combination of events created a sensation that led to an increased attention on various media sources. This led to higher publicity, encouraging more people to submit the online SMRU questionnaire.
Being Easter Sunday, shortly after lunch time, families are likely to have been sitting down in a quiet environment, hence increasing their chances of experiencing shaking. At home, unlike at a workplace environment, people are more likely to have had easy access to various media sources such as television, radio and internet. With the advent of social media, news items are easily ‘shared’ with friends across various online platforms, typically using smart phones. In total the online news items reported by the Times of Malta were shared more than 800 times. The extended online audience reached from such shares is hard to quantify but it is expected to grow exponentially with every ‘share’—easily reaching a good per-centage of the 400,000 population on the islands. This process indirectly helped with the promotion of the SMRU website resulting in hundreds of peoplefilling in the‘Did you feel an earthquake?’questionnaire.
3
Online Questionnaire
The‘Did you feel an earthquake?’ online questionnaire has 28 questions divided into four sections (Fig.4). Section A is the only mandatory section and refers to the location and time of the felt shaking. Users are asked to specify if they were outdoor, inside a building, in a stationary or moving vehicle, or other. A Google Maps window is included for users to voluntarily give a more precise location.
Fig. 4 Screen shot of the ‘Did you feel an earthquake?’online questionnaire on the SMRU website
Section B focuses on the building description: age, use, height and construction typology (masonry, concrete, or other). Such information might eventually be useful in the study of building vulnerability. The age of a building would generally be indicative of the style and/or construction method of that particular era. Figure5
shows three typical dwellings found across the islands. The buildings in Fig.5a are more than 100 years old, built out of masonry blockwork, commonly found in village cores and towns such as Valletta. Two-storey houses were the more popular type of housing during the last century, involving a combination of masonry blockwork walls and reinforced concrete roofs (Fig. 5b). Nowadays, new, taller, buildings are constructed using a mix of reinforced concrete and masonry (Fig.5c). The third section, C, concerns the respondent’s perception of the earthquake, such as the kind and severity of the shaking felt, his/her current position/activity, and the experience of nearby persons or animals.
Section D deals with the effects of the earthquake on objects, buildings and the environment, such as the rattling of windows, doors and crockery; disturbance of the motion of pendulum clocks; swaying of plants, splashing of liquids, swinging of hanging objects; shifted furniture, etc. There is also a series of questions on the damage, if any, to the building, such as cracks in plaster, fallen pieces of plaster from walls or ceilings; cracks in brick or stone walls; fallen masonry walls, etc., as well as on the effects on natural surroundings (landslips, cracks in the ground, or effects on ponds or streams). The respondent is also given the opportunity to add any other comments he/she deems appropriate.
4
Results
A total of 489 questionnaires were received by the SMRU over the span of three days, from the 24th to the 26th of April 2011. Figure 6 shows the frequency distribution of the submitted questionnaires in relation to the sequence of earth-quakes. Following each earthquake is a spike of submitted felt reports. During the
Fig. 5 Photos of typical dwellings found across Malta.aMasonry buildings older than 100 years
built in historic areas such as Valletta.bMasonry houses built between 20 and 100 years ago
outside historic towns such asĦaż-Żabbar and Marsaskala.cModern high-rise apartments built in
night (grey shade) fewer or no questionnaires were registered. The majority of questionnaires were submitted following the magnitude 4.1 earthquake.
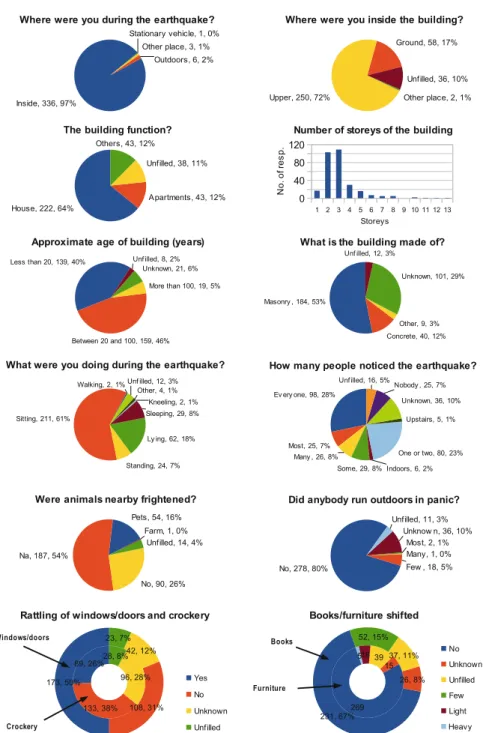
Figure7illustrates graphically the contents of the questionnaire reports relating specifically to the largest shock: a total of 346 questionnaires. Most reports were from people, who at the time of the earthquake, were inside a building (97 %), in an upperfloor (72 %), either in a house (64 %) or in an apartment (12 %), and sitting down (61 %). The majority of the buildings had 2 or 3 storeys, were built in the last century (86 %), and made of masonry (53 %). Over 40 % claim that most people who were at the respondent’s location felt the earthquake. Fifty percent of the respondents reported rattling of doors and windows whereas only 26 % reported rattling of crockery. 54 respondents (16 %) claimed that their pets were frightened; 18 reports from various localities in Malta indicated that a few people ran outdoors in panic. This contrasts with the few responses received from the western coast and the island of Gozo; no rattling of doors, and no people running outdoors were reported.
Figure8shows two maps; one of the population distribution across the Maltese islands, and the other showing the distribution of the submitted questionnaires related to the main shock on Sunday afternoon 24th of April. Most felt reports originated from the east–south-east parts of the main island; the more inhabited areas of Tas-Sliema, Marsaskala and Ħaż-Żabbar. Tas-Sliema has the highest number of reports (27). Only 5 reports were from Gozo.
Several fields were marked as‘unknown’, while towards the end of the ques-tionnaire, manyfields were left empty, probably because the questions concerned a high level of shaking intensity and structural damage that may have not been relevant in this case.
1 2 3 4 5 Magnitude
Earthquake sequence and questionnaire response
Night Earthquake Submitted questionnaires (30 min. bin) 0 10 20 30 40 Submissions 00 06 12 18 00 06 12 18 00 06 12 18 00
24 April 2011 25 April 2011 26 April 2011
Local date and time
Fig. 6 Graph showing the time series of the earthquake swarm and the corresponding submitted
felt reports.Yellow stars: The 14 earthquakes of various magnitudes that took place from the 24th
to the 26th of April.Red bars: Submitted reports grouped in 30 min bins.Grey shade: Night
Fig. 7 Pie and bar charts showing selected statistics from the questionnaire response submitted for
theML4.1 earthquake on Sunday 24th of April 2011. Comma separated labels show the selected
5
Discussion
The general aspects from the felt reports, with a particular focus on the intensity of the main shock in the context of the present urbanisation of the Maltese islands, is discussed hereunder.
5.1
Seismic Intensity
The reports, particularly the results from sections C and D, were used to assign intensity values in the various localities, according to the European Macroseismic Scale 1998 (EMS-98, Grünthal et al. 1998). The strongest reported effect is of
‘shifted furniture’, claimed by 23 respondents from various central–southern areas of Malta (Qawra, Rabat, Iklin,Ħamrun, Santa Venera, SanĠiljan, Tas-Sliema, Ta’ Xbiex, L-Imsida, Il-Marsa, Valletta, Il-Kalkara,Ħal Tarxien, Il-Fgura,Ħaż-Żabbar, Marsaskala, Marsaxlokk, Birżebbuġa, Is-Siġġiewi, L-Imqabba, and Iż-Żurrieq).
A maximum intensity of IV has been assigned to reports claiming shifted household furniture. Because the number of such reports was only a small subset within the respective locality, an intensity range of III–IV was assigned to that area. An intensity in the range of II–III was assigned to localities that had a maximum reported level of shaking from rattling doors and crockery. An intensity II was assigned to reports that had basic felt experience that did not include effects on
Intensity map 14˚12' 14˚12' 14˚24' 14˚24' 14˚36' 14˚36' 14˚48' 14˚48' 15˚00' 15˚00' 35˚48' 35˚48' 36˚00' 36˚00' 0 10 Distance, km Number of reports: 346 2 5 10 20 Malta Gozo 24/4/2011 15:02 (local time) ML4.1 earthquake Tas−Sliema Haz−Zabbar Marsaskala 0 10000 20000 Population: 406879 n EMS−98 intensity III−IV Weak−Largely observed II−III Scarcely felt−Weak II Scarcely felt
Fig. 8 Map showing local felt intensities based on the European Macroseismic Scale 1998
(Grünthal et al. 1998) intensity scale for the ML 4.1 earthquake on Sunday 24th of April.
Colour-coded circles: indicate the number of felt reports and the maximum intensity reported.
Purple star: The earthquake epicentre.Inset map: The population distribution of Malta based on
the national census (National Statistics Office2011).Shaded inland regions: indicate the built-up
objects and buildings as a result of the earthquake. Figure 8 maps the shake intensity according to the reports.
The general trend of the earthquake intensity agrees with the automated report generated by the European-Mediterranean Seismological Centre (EMSC) online questionnaire. EMSC received 36 responses from 5 communities, all from the central–south-east areas of the mainland Malta. A maximum grade of intensity IV, described as largely observed, was assigned to three localities.
The intensity map shows a natural decrease in intensity with distance from the epicentre. This is also reflected by the lower number of reports towards the north-west of the archipelago. Taking into account the close proximity of both islands to the epicentre, the frequency content of the propagating seismic waves from the earthquake may have contributed to the rapid change of the felt intensity at a relatively short distance. Unlike the expected shaking felt from a regional earthquake, where the low-frequency waves would affect the islands more or less the same throughout, the energetic high-frequency seismic waves from a local earthquake—responsible for the rattling of crockery, doors and windows—are likely to attenuate quickly during propagation. Future deployment of permanent, broadband seismic stations in central Malta and Gozo will aid with investigating such characteristics.
5.2
Citizens
’
Reaction on Social Media
As new tremors were felt throughout Sunday, many took to the Internet to report their experience publicly, beneath news items and on social media soon after each earthquake. Many simply reported the locality of where they felt the tremor, saying, for example: “I felt it in Sliema too”. Some were more descriptive: “There was another one… around 3.03 pm. Sounded like a fireworks factory explosion. Trembling sensation on the floor, and cabinet doors rattled. In my children’s bedroom, a soft toy fell off a shelf. I’m in Qormi and I live on firstfloor”. Others gave it a religious connotation in relation to the current national affairs:“This is a warning from above…With the divorce referendum coming up”. A few comments were amusing:“I blamed my son—how typical. I thought he had moved something in the kitchen”. On the other hand, a couple of comments reported otherwise:“Not a single one was felt in Gozo”. Despite the numerous online posts none reported any damage. News agencies confirmed that the Civil Protection Department received no calls for assistance.
Comparatively, the overall information obtained from the snippet textual com-ments expressed by citizens on various online platforms is coherent with those submitted to the SMRU online questionnaire. Several new studies are showing that web crawling and data mining of online social media can be used to generate near real-time alerts for the occurrence of something phenomenal (e.g., Sakaki et al.2010; Bossu et al.2011; D’Auria et al.2014). The new dataset obtained here can be used to calibrate such an Internet system were it to be adapted in the future by the SMRU.
5.3
Some Observations on Local Building Patterns
The contents of the completed questionnaires also provide some insight into con-struction patterns in Malta. Until recently many residential buildings in villages across Malta were constructed in of unreinforced masonry using local limestone blocks, and typically consisting of 2 storeys. In the last few decades this scenario has been changing rapidly; many low-rise houses are being demolished to be replaced with taller apartment blocks, including both masonry blockwork walls and reinforced concrete structural elements. The change in the building style is reflected in the questionnaires. Nearly 60 % of the masonry buildings were built between 20 and 100 years ago whereas about 30 % in the last 20 years. In contrast, 85 % of the buildings reported as‘reinforced concrete’were built in the last 20 years.
The seaside town of Tas-Sliema is one of the most re-developed areas that has undergone such a rapid change in a relatively short time. In fact, nearly half of the reported reinforced concrete buildings in the questionnaires are located here or in the vicinity. Today this upmarket area has many tall buildings, some exceeding 10 storeys as noted from the respondents (Fig.5c). In the absence of real data from strong ground motion, the behaviour of these taller buildings in comparison to low-storey masonry buildings is still unclear and needs to be better understood through other techniques, especially with respect to investigation of particular construction typologies peculiar to the islands.
The largest number of questionnaires from a single locality following the main shock were from Tas-Sliema, with 27 reports (Fig.8). Marsaskala andĦaż-Żabbar, two localities which are approximately at equal distances to the earthquake’s epi-centre as Tas-Sliema, only had 19 and 14 reports, respectively. All three localities have similar population: 13,621, 11,059, and 14,916, respectively (National Statistics Office2011), and, all three localities overlie similar geology (Pedley and Clarke2002). The main contrasting attribute between the localities is the building height. Many respondents from Tas-Sliema were inside higherfloors compared to the other localities. The average reported building height in Tas-Sliema was 5.5 storeys and the average height for Marsaskala andĦaż-Żabbar was 2.8. It is likely that the difference in the number of submitted reports is a result of the shaking being more noticeable on higherfloors, although the different response of the buildings, or the social response of the Sliema population could also be contributing factors.
6
Conclusions
Fifteen earthquakes that took place offshore Malta over the Easter of 2011 were located to be about 38 km off the east coast of Malta. These earthquakes were of various magnitudes with the largest being ofML4.1 on Sunday 24th of April. The
latter earthquake was felt by many of the inhabitants on the islands, particularly along the south-eastern coast. SMRU personnel located the earthquakes and updated the website for immediate public information.
A total of 489 felt reports were submitted through the online‘Did you Feel an Earthquake’questionnaire run by the SMRU website. The questionnaire had been in place since 2007 but had not yet achieved its full potential until these events. The reports following the main shock were analysed and benchmarked to the EMS-98 intensity scale. The highest reported shaking was‘shifted furniture’—no structural damage was reported. Hence, a maximum intensity of IV has been assigned.
The different number of reports between localities that have similar population, geological setting, and epicentre distance may be explained, in part, by the different building types. Interestingly, the locality with the most number of reports was from an area that had a large number of high rise apartments, whereas the other localities had two-storey houses. In this regard, a detailed investigation from an engineering point of view is still desirable. The questionnaires highlight the role citizens and online social media can play when investigating a regional or large-scale area.
The earthquake swarm can help to add new constraints to the regional geody-namic model and contribute to the current investigations of seismotectonics and seismic hazard in the area. A new level of seismicity has been revealed for this part of the Sicily Channel, previously only marked by a few earthquakes in conventional seismic bulletins. Important parameters such as the depth of the earthquakes are not well constrained mainly due to the lack of station coverage. Additional seismic stations on land and future missions involving ocean-bottom seismometers and detailed sea-floor mapping could provide clues on the earthquake mechanisms in this seismically active area.
Acknowledgements We thank Alex Bezzina for insightful comments that helped us to improve
the manuscript. We are grateful to Carlos Cañas Sanz for his help in generating the demographic
local maps. Somefigures were created using the Generic Mapping Tools (Wessel and Smith1998)
and ObsPy: A Python Toolbox for Seismology (Beyreuther et al.2010). This study was supported
by SIMIT Project part-financed by the European Union, European Regional Development Fund
(ERDF) under the Italia-Malta Cross-Border Cooperation Programme, 2007–2013.
References
Agius, M. R., D’Amico, S., Galea, P., & Panzera, F. (2014). Performance evaluation of Wied
Dalam (WDD) seismic station in Malta.Xjenza, 2(1), 78–86.
Agius, M. R., & Galea, P. (2011). A single-station automated earthquake location system at Wied
Dalam station, Malta.Seismological Research Letters, 82(4), 545–559.
Beyreuther, M., Barsch, R., Krischer, L., Megies, T., Behr, Y., & Wassermann, J. (2010). ObsPy:
A Python toolbox for seismology.Seismological Research Letters, 81(3), 530–533.
Boschi, E., Guidoboni, E., Ferrari, G., Mariotti, D., Valensise, G., & Gasperini, P. (2000).
Catalogue of strong Italian earthquakes from 461 B.C. to 1997.Annals of Geophysics,43(4).
Boschi, E., & Morelli, A. (1994). The MEDNET program.Annals of Geophysics,37(5).
Bossu, R., Gilles, S., Mazet-Roux, G., & Roussel, F. (2011). Citizen seismology: How to involve
the public in earthquake response. In D. S. Miller & J. D. Rivera (Eds.), Comparative
emergency management: Examining global and regional responses to disasters(pp. 237–260). Boca Raton: CRC Press.
D’Amico, S. (2014). Source parameters related to a small earthquake swarm off-shore of Malta
(Central Mediterranean).Development in Earth Science, 2(1), 8–13.
D’Amico, S., Orecchio, B., Presti, D., Gervasi, A., Zhu, L., Guerra, I., Neri, G., & Herrmann, R. B.
(2011). Testing the stability of moment tensor solutions for small earthquakes in the
calabro-peloritan arc region (Southern Italy).Bollettino di Geofisica Teorica ed Applicata.
D’Amico, S., Orecchio, B., Presti, D., Zhu, L., Herrmann, R. B., & Neri, G. (2010). Broadband
waveform inversion of moderate earthquakes in the messina straits, Southern Italy.Physics of
the Earth and Planetary Interiors, 179(34), 97–106.
D’Auria, L., Convertito, V., & Giudicepietro, F. (2014). Real-time mapping of earthquake
perception areas in the Italian region from Twitter streams analysis. InEGU General Assembly
Conference Abstracts(Vol. 16, p. 6236).
Dandoulaki, M., Panoutsopoulou, M., & Ioannides, K. (1998). An overview of post-earthquake building inspection practices in Greece and the introduction of a rapid building usability
evaluation procedure after the 1996 Konitsa earthquake. InProceedings of 11th European
Conference on Earthquake Engineering.
Galea, P. (2007). Seismic history of the Maltese Islands and considerations on seismic risk.Annals
of Geophysics,50(6).
Gallais, F., Gutscher, M.-A., Graindorge, D., Chamot-Rooke, N., & Klaeschen, D. (2011). A miocene tectonic inversion in the Ionian Sea (Central Mediterranean): Evidence from
multichannel seismic data.Journal of Geophysical Research,116(B12).
Grünthal, G. E., Musson, R., Schwarz, J., & Stucchi, M. (1998).European Macroseismic Scale
1998 (EMS-98), volume 15 ofCentre Européen de Géodynamique et de Séismologie. Cahiers
du Centre Européen de Géodynamique et de Séismologie, Luxembourg.
Herrmann, R. B. (2013). Computer programs in seismology: An evolving tool for instruction and
research.Seismological Research Letters, 84(6), 1081–1088.
Karababa, F. S., & Pomonis, A. (2010). Damage data analysis and vulnerability estimation
following the August 14, 2003 Lefkada Island, Greece, Earthquake.Bulletin of Earthquake
Engineering, 9(4), 1015–1046.
National Statistics Office (2011).Census of population and housing 2011: Final report. Technical
report, National Statistics Office, Valletta.
Pedley, M. & Clarke, M. H. (2002).Limestone Isles in a Crystal Sea: the geology of the Maltese
Islands. Publishers Enterprises Group.
Sakaki, T., Okazaki, M., & Matsuo, Y. (2010). Earthquake shakes twitter users: Real-time event
detection by social sensors. InProceedings of the 19th International Conference on World
Wide Web, WWW‘10, pp. 851–860, New York: ACM.
Tan, Y., Zhu, L., Helmberger, D. V., & Saikia, C. K. (2006). Locating and modeling regional
earthquakes with two stations.Journal of Geophysical Research,111(B1).
The Sunday Times (2011, April 24). Divorce and earthquake forecast at Borg in-Nadur. Vannucci, G., Pondrelli, S., Argnani, A., Morelli, A., Gaperini, P., & Boschi, E. (2004). An atlas
of Mediterranean seismicity.Annals of Geophysics,47(1).
Wald, D. J., Worden, B. C., Quitoriano, V., & Pankow, K. L. (2006). ShakeMap manual:
Technical manual, user’s guide, and software guide. U.S. Geological Survey.
Wessel, P. & Smith, W. H. (1998). New, improved version of Generic Mapping Tools released.
Eos, Transactions of the American Geophysical Union,79(47).
Zhu, L., & Helmberger, D. V. (1996). Advancement in source estimation techniques using
broadband regional seismograms. Bulletin of the Seismological Society of America, 86(5),