MASARYKUNIVERSITY
FACULTY OFINFORMATICS
}w !"#$%&'()+,-./012345<yA|
Indoor Navigation for Android
MASTER’S THESIS
Michal Holˇcík
Declaration
Hereby I declare, that this paper is my original authorial work, which I have worked out by my own. All sources, references and literature used or excerpted during elaboration of this work are properly cited and listed in complete reference to the due source.
Thanks
I would like to thank my advisor Mgr. Jonáš Ševˇcík for kind supervision and leading to-wards the thesis objective, Peter Trško for mathematical advice and discussions on the sub-ject, Mgr. Petr Kroutil and Mgr. Martin Vytrhlík from the Geographical Information Systems department ÚVT MU who provided plans for university buildings and useful advice on the data conversion and last but not least Ing. Leoš Vojíˇr from Siemens Enterprise Comms. com-pany for lending me the Samsung Galaxy Tab device on which all of the developed code was tested.
Abstract
The aim of this thesis was to study available navigation methods for localization within in-door environments and to implement chosen methods in an application for Android smart-phones equipped with inertial sensors and network interfaces for connection to wireless networks. Due to planned use as a localization component for augmented reality applica-tions, emphasis was placed on as high localization precision as possible.
We implemented a localization application based on step-based dead reckoning com-bined with a WiFi RSS fingerprinting method in a particle filter type system.
Test results demonstrate that the precision of our system does not fullfil augmented re-ality requirements, nevertheless the system still can be used as a basis for room-to-room indoor navigation.
Keywords
pedestrian navigation, indoor localization, step detection, sequential Monte Carlo localiza-tion, particle filter, wifi fingerprinting
Contents
1 Introduction . . . 1
1.1 Augmented reality . . . 1
1.2 Target precision . . . 1
1.3 Navigation and localization . . . 2
1.4 Thesis chapters . . . 2
2 Localization methods . . . 3
2.1 Relative localization - Dead reckoning . . . 3
2.2 Inertial navigation. . . 3
2.3 Electromagnetic wave-based techniques . . . 3
2.3.1 Satellite-based techniques . . . 3
2.3.2 Radio methods . . . 3
2.4 Image processing methods . . . 4
2.4.1 Marker detection . . . 4 2.4.2 Feature detection . . . 4 3 Sensors . . . 5 3.1 Hardware sensors . . . 5 3.2 Inertial sensors . . . 5 3.2.1 Linear accelerometer . . . 5
3.2.1.1 Accelerometers and Gravity . . . 6
3.2.2 Gyroscope . . . 6
3.3 Non-inertial sensors . . . 6
3.3.1 Magnetometers . . . 7
3.3.1.1 Magnetometer error and influence of environment . . . 7
4 Localization model . . . 9
4.1 Motion measurements . . . 9
4.1.1 Step detection . . . 9
4.1.1.1 Human locomotion . . . 9
4.1.1.2 Required sampling rate . . . 9
4.1.1.3 Signal processing tools . . . 10
4.1.2 Stride length estimation . . . 11
4.1.2.1 Experiment setup . . . 11
4.1.2.2 Measurement results and derived model . . . 11
4.2 Device orientation. . . 12 4.2.1 Coordinate system . . . 12 4.2.2 Magnetic heading . . . 12 4.2.3 Sensor Fusion . . . 13 4.2.4 Gyroscope orientation . . . 13 4.2.4.1 Frames of reference . . . 13
4.2.4.4 Complementary filter . . . 14
4.3 WiFi Localization Methods. . . 14
4.3.1 Chosen localization model . . . 14
4.3.2 RSS fingerprinting . . . 14
4.3.3 Delaunay triangulation . . . 15
4.3.4 Fingerprint metrics . . . 15
4.3.5 Location finding methods . . . 15
4.3.5.1 Nearest neighbor method . . . 15
4.3.5.2 Probability map . . . 15
4.4 Sequential Monte Carlo filtering . . . 15
4.4.1 State model . . . 16
4.4.2 Measurement model . . . 16
4.4.3 Pedestrian Monte Carlo localization algorithm with map matching . . 16
5 Implementation of the Pedestrian Navigation System . . . 18
5.1 Android . . . 18
5.1.1 Android SDK and NDK . . . 18
5.1.2 Target API Version . . . 19
5.1.3 Android Integration . . . 19
5.2 System Design . . . 19
5.2.1 External Interfaces . . . 19
5.2.1.1 Android Framework Interfaces . . . 19
5.2.2 Intercomponent interfaces . . . 20
5.3 The Pedestrian Navigation Sandbox application . . . 21
5.3.1 Pedestrian Navigation Prototype Activity . . . 22
5.3.1.1 Graphical interface . . . 22
5.3.1.2 User Controls . . . 23
5.3.2 Precision Evaluation Activity . . . 24
5.3.2.1 User Controls . . . 24
5.3.3 Step Detection Activity . . . 24
5.3.4 Acceleration FFT . . . 25
5.3.5 Compass Demonstration Activities . . . 25
5.3.5.1 Graphical interface . . . 26
5.3.5.2 User Controls . . . 26
5.3.6 Magnetic Compass Deflection Demo Activity . . . 26
5.3.6.1 Graphical interface . . . 26 5.3.7 WiFi RSS Map . . . 26 5.3.7.1 Graphical interface . . . 26 5.3.7.2 User Controls . . . 26 5.3.8 WiFi RSS Scanner . . . 27 5.3.8.1 User Controls . . . 28
5.3.9 Delaunay Triangulation Demo . . . 28
5.3.11 Grid Stochastic Demo . . . 28
5.3.12 Particle Filter Demo . . . 28
5.3.12.1 Graphical interface . . . 29
5.4 Building Plan Data . . . 29
5.4.1 Technological passport of the Masaryk University . . . 29
5.4.2 AutoDesk DWG format conversion . . . 30
5.4.3 S-JTSK coordinate system . . . 30
6 Precision evaluation . . . 32
6.1 Localization precision tests. . . 32
6.2 Evaluation method . . . 32
6.3 Testing procedure . . . 33
6.4 Test results . . . 33
6.4.1 Dead reckoning tests of particle filter with gyromagnetic compass with known starting position . . . 33
6.4.2 Dead reckoning tests of particle filter with gyromagnetic compass with unknown starting position, and WiFi localization . . . 34
7 Conclusion. . . 36 7.1 Summary . . . 36 7.2 Results . . . 36 7.3 Future work . . . 37 Bibliography . . . 39 A File formats . . . 40
A.1 Building package DTD . . . 40
A.2 Walls and stairs file format . . . 41
A.3 Area Transition Edge file format . . . 41
B Attachments . . . 42
Chapter 1
Introduction
This thesis project builds on the work of Mgr. Jonáš Ševˇcík in investigating the ways of user localization in indoor environments and implementing a prototype of an indoor localization system. His thesis [18] identified the need to determine the location of a library visitor or em-ployee, both users of an augmented reality system, that provides information and locations of books in the library.
1.1 Augmented reality
Augmented reality (AR) is real-time integration of an image of the real world with an arti-ficially created information. In present the most common way of augmenting the reality is by composing a digitally aquired image of the real environment with a computer generated visualization of the added information and presenting them on a computer screen, smart-phone display or so called augmented reality glasses. In order to compose well the real and generated images, AR applications depend on the knowledge of the camera location. In AR surgery or car-fixing application, where the camera position is near the studied object, rela-tive position may be determined by digitally processing the input image, while in outdoor applications the objects of interest (providing information about landmarks, monuments, or finding the nearest pub) are usually big and far enough so that the precision of the GPS lo-calization is sufficient. In indoor applications however, lolo-calization precision requirements rise due to smaller distances and scale of the target objects and at the same time the GPS sig-nal is obstructed by walls and other building structural parts. As a result there is currently no simple or reliable method of determining user location.
1.2 Target precision
Mgr. Ševˇcík in his thesis [18] uses a section in library shelf as the unit for addressing book location. The shelves are approximately 1 meter apart, and the shelf sections are also almost meter wide as it can be seen on the library photo, see Figure 1.1. A user of the librarian augmented reality system standing in this area would receive contextual information about the books contained in the shelf. We will use this area as our localization precision criterion. The localization precision, we will aim for, should therefore be within 1 meter from the reference location.
1.3. NAVIGATION AND LOCALIZATION
Figure 1.1: 1.3 Navigation and localization
Wikipedia, defines navigation [?] as “the process of monitoring and controlling the move-ment of a craft or vehicle from one place to another.” The knowledge of the navigator’s own position is critical for the all the navigational techniques, however the process of finding a location relative to other reference locations or patterns is called localization. Sometimes the term navigation is used as totum pro parte when referring to the task of localization, though localization is only a subtask of the navigation process. We, in this thesis, are solely concentrating on the task of localization (or positioning or position/location tracking). 1.4 Thesis chapters
The thesis begins with a general overview of localization methods (Chapter 2, “Localiza-tion methods”), followed by a descrip“Localiza-tion of characteristics of harware sensors found in smartphone devices, Chapter 3, “Sensors”. In the next Chapter 4, “Localization model” a navigational model is presented, whose implementation is covered in Chapter 5, “Imple-mentation of the Pedestrian Navigation System”. Evaluation of the localization precision of the implemented system comes in the final Chapter 6, “Precision evaluation”.
Chapter 2
Localization methods
This section contains an breif overview of available localization techniques. All sensor-based localization techniques are based on measuring physical quantities that in some way corre-late with geographical location or the change of it.
2.1 Relative localization - Dead reckoning
Dead reckoning is calculates a position estimate by measuring the motion and the direction of motion from initial position.
2.2 Inertial navigation
Inertial navigation is a kind of dead reckoning navigation technique. Position is computing by double integrating input from accelerometers. In order to function well, it requires highly accurate inertial measurement unit (IMU).
In the start of the measurement, inertial navigation system, as any other dead reckoning system requires a position fix and initial orientation.
2.3 Electromagnetic wave-based techniques
Electromagnetic waves include visible and invisible light-based methods. Radio based tech-niques estimate position relative to known locations of radio emitters (satellites, wireless accesspoints, GSM basestations etc.).
2.3.1 Satellite-based techniques
The most prevalent solution today is the GPS. Followed by GALILEO and GLONASS as alternative solutions. Satellite signals are easily obstructed by walls and have poor coverage in indoor areas.
2.3.2 Radio methods
In this cathegory belong all known communication network technologies like WiFi, Blue-tooth, ZigBee. Location estimate is computed by measuring the received signal strength
2.4. IMAGE PROCESSING METHODS indication (RSSI) and comparing to a broadcast reference signal strength level.
Alternative technology based on radio waves is a RFID badge system. This however requires and prepared environment with regularly placed RFID tags.
2.4 Image processing methods
Optical methods use image information from camera, on which they perform analysis to extract location dependent patterns.
2.4.1 Marker detection
These method require active user involvement, finding and scanning optical markers (such as barcodes or QR codes). A prepared databases with mapping of the marker id to the geo-graphical location is required.
2.4.2 Feature detection
This technique relies on computing the position from recognized features in an input im-age stream. This method is computationally demanding. However can result in sub-meter localization precision.
Chapter 3
Sensors
This chapter will cover basic information and characteristics of sensors usually available in current mobile communication devices (cellular phones or tablets) that can be used for indoor navigation.
To give an overview of sensors supported by the Android SensorManager API, the fol-lowing list [http://developer.android.com/reference/android/hardware/Sensor.html]
Accelerometer and magnetometer are quite common sensors for estimating device’s ori-entation in space and are a base sensors for UI controls and navigation. Gyroscope is present in the more expensive exemplars. Exotic sensors like pressure sensor or RFID reader are present in only few. Vast majority of the integrated inertial sensors use the MEMS – micro electro mechanical system.
3.1 Hardware sensors
To give examples of concrete sensors found in smartphones, we extracted a list of sensors found in the Samsung Galaxy Tab tablet. Hardware information was read from the device using the Android System Info application. [?]
AK8973 (by Asahi Kasei Corp.) compass/magnetic field sensor integrated L3G4200 (by ST Microelectronics) gyroscopic sensor
BMA150 (by Bosch Sensortec) three-axis accelerometer.
The Galaxy Tab is also equipped with a temperature, proximity and light sensor. Intu-itively there is little correlation between temperature and light intensity vs. geographical location, so we see no use in them for the purpose of indoor navigation.
3.2 Inertial sensors
• Linear accelerometer
• Gyroscope
3.2.1 Linear accelerometer
Linear accelerometer measures acceleration in relation to one axis of an inertial frame of reference. By using three orghogonal accelerometers, we receive information about the
ac-3.3. NON-INERTIAL SENSORS celeration in 3-dimensional space. All accelerometers use the same 2nd Newton’s law: “The acceleration a of a body is parallel and directly proportional to the net force F and inversely proportional to the mass m.”
3.2.1.1 Accelerometers and Gravity
All accelerometers on Earth’s surface are subject to Earth’s gravity. 3.2.2 Gyroscope
Mechanical gyroscope is an instrument consisting of a rapidly spinning flywheel attached to an axis that can turn freely. The angular momentum of the disk causes the axis to resist changes in the direction of its axis of rotation. Because of the gyroscope’s tendency to main-tain the same orientation in space regardless of the movement of the surrounding structure, it is used in the navigation and piloting systems of airplanes, ships, rockets, and other vehi-cles.
Electronic gyroscopes, also called angular rate sensors aren’t themselves capable of main-taining the orientation, but rather measure the angular increments in the body’s orientation, so that the actual orientation can be estimated by using a mathematical model.
There are several types of electronic gyroscopes
• Optical
• MEMS gyroscopes
Coriolis effect MEMS gyroscopes are used in todays personal communication devices. An object of the massmmoving at the velocityvin the frame of reference rotating at the angular velocityωis subject to Coriolis force:Fc=−2m(ω×v)
MEMS gyroscopes contain a vibrating element used to sense the Coriolis effect. When the gyroscope coordinate system turns, Coriolis force induces a secondary vibration on the axis perpendicular to the measurement axis.
Nowadays MEMS gyroscopes can’t compete with precision to optical gyroscopes, nev-ertheless it is expected that technological progress will bring improvements in this area. Improvement of performance can be achieved by modifications in the design of circuit and sensing element.[1]
3.3 Non-inertial sensors
• Magnetometer
3.3. NON-INERTIAL SENSORS
Figure 3.1: Image of ST LYPR540AH Tri-axis MEMS gyroscope, shot by a scanning electron microscope
3.3.1 Magnetometers
Magnetometer is an instrument used the measure the strength of magnetic field.
MEMS magnetometer sensors are either Lorentz-force based or solid-state Hall effect.
F=q[E+ (v×B)]
Equation 3.3.1: Lorentz force
3.3. NON-INERTIAL SENSORS ● ● ● ● ● ● ● ● ● ● ● ● ● ● ● ● ● ● ● ● ● ● ● ● ● ● ● ● ● ● ● ● ● ● ● ● ● ● ● ● ● ● ● ● ● ● ● ● ● ● ● ● ● ● ● ● ● ● ● ● ● ● ● ● ● ● ● ● ● ● ● ● ● ● ● ● ● ● ● ● ● ● ● ● ● ● ● ● ● ● ● ● ● ● ● ● ● ● ● ● ● ● ● ● ● ● ● ● ● ● ● ● ● ● ● ● ● ● ● ● ● ● ● ● ● ● ● ● ● ● ● ● ● ● ● ● ● ● ● ● ● ● ● ● ● ● ● ● ● ● ● ● ● ● ● ● ● ● ● ● ● ● ● ● ● ● ● ● ● ● ● ● ● ● ● ● ● ● ● ● ● ● ● ● ● ● ● ● ● ● ● ● ● ● ● ● ● ● ● ● ● ● ● ● ● ● ● ● ● ● ● ● ● ● ● ● ● ● ● ● ● ● ● ● ● ● ● ● ● ● ● ● ● ● ● ● ● ● ● ● ● ● ● ● ● ● ● ● ● ● ● ● ● ● ● ● ● ● ● ● ● ● ● ● ● ● ● ● ● ● ● ● ● ● ● ● ● ● ● ● ● ● ● ● ● ● ● ● ● ● ● ● ● ● ● ● ● ● ● ● ● ● ● ● ● ● ● ● ● ● ● ● ● ● ● ● ● ● ● ● ● ● ● ● ● ● ● ● ● ● ● ● ● ● ● ● ● ● ● ● ● ● ● ● ● ● ● ● ● ● ● ● ● ● ● ● ● ● ● ● ● ● ● ● ● ● ● ● ● ● ● ● ● ● ● ● ● ● ● ● ● ● ● ● ● ● ● ● ● ● ● ● ● ● ● ● ● ● ● ● ● ● ● ● ● ● ● ● ● ● ● ● ● ● ● ● ● ● ● ● ● ● ● ● ● ● ● ● ● ● ● ● ● ● ● ● ● ● ● ● ● ● ● ● ● ● ● ● ● ● ● ● ● ● ● ● ● ● ● ● ● ● ● ● ● ● ● ● ● ● ● ● ● ● ● ● ● ● ● ● ● ● ● ● ● ● ● ● ● ● ● ● ● ● ● ● ● ● ● ● ● ● ● ● ● ● ● ● ● ● ● ● ● ● ● ● ● ● ● ● ● ● ● ● ● ● ● ● ● ● ● ● ● ● ● ● ● ● ● ● ● ● ● ● ● ● ● ● ● ● ● ● ●● ● ● ● ● ● ● ● ● ● ● ● ● ● ● ● ● ● ● ● ● ● ● ● ● ● ● ● ● ● ● ● ● ● ● ● ● ● ● ● ● ● ● ● ● ● ● ● ● ● ● ● ● ● ● ● ● ● ● ● ● ● ● ● ● ● ● ● ● ● ● ● ● ● ● ● ● ● ● ● ● ● ● ● ● ● ● ● ● ● ● ● ● ● ● ● ● ● ● ● ● ● ● ● ● ● ● ● ● ● ● ● ● ● ● ● ● ● ● ● ● ● ● ● ● ● ● ● ● ● ● ● ● ● ● ● ● ● ● ● ● ● ● ● ● ● ● ● ● ● ● ● ● ● ● ● ● ● ● ● ● ● ● ● ● ● ● ● ● ● ● ● ● ● ● ● ● ● ● ● ● ● ● ● ● ● ● ● ● ● ● ● ● ● ● ● ● ● ● ● ● ● ● ● ●●● ● ● ● ● ● ● ● ● ● ● ● ● ● ● ● ● ● ● ● ● ● ● ● ● ● ● ● ● ● ● ● ● ● ● ● ● ● ● ● ● ● ● ● ● ● ● ● ● ● ● ● ●●●●● ● ● ●● ●● ●●●●●●●●●● ● ● ●●●● ●●● ● ● ● ● ●●●● ● ● ●●●●●●●●●●●●●●●●●●●●●●●●●●●●●●●●●●●●●●●●●●●●●●●●●●●●●●●●●●●●●●●●●●●●●●●●●●●●●●●●●●●●●●●●●●●●●●●●●●●●●●●●●●●●●●●●●●●●●●●●●●●● ● ● ● ● ●●●●●●●●●●●●●●●●●●●●●●●●●●● ●●●●●●●●●●●●●●●●●●●●●●●●●●●●●●●●●●●● ● ●●●●●●●●●●●●●●● ●●●●●●●●●●●●●●●●●●●●●●●●●●●●●●●●●●●●●●●●●●●●●●●●●●●●●●●●●●● ● ●●●●●●●●●●●●●●●●●●●● ● ●●●●● ●●● ● ●●● ● ●●●●●●●●●●●●●●● ● ●●●●●●●●●●●●●●●●●●●●●●●●●●●●●●● ●●●●●●●●●●●●●●●●●●● ●●●●●●●●●● ●●●●●●● ● ● ● ●● ● ● ● ● ● ●● ● ● ● ●●● ● ● ● ● ● ●●● ●●●● ● ● ● ● ● ● ● ● ● ● ● ● ● ● ● ● ● ● ● ●●● ● ● ● ● ● ● ● ● ● ●● ● ● ● ● ●●● ● ●●● ● ●●●●●● ●●●●●●●● ● ● ●●●● ●● ●●●●● ●●●●●●●●●●●● ● ● ●●●● ● ● ● ●●●●●●● ● ● ●● ●● ● ●●●● ● ● ● ●●●● ●● ● ●● ●●● ● ●●●●●● ●●●●●●●●●●●●●●●●●●●●● ●●●●●●●●●●●●●●●●●● ● ●●●● ● ●●●●●● ● ● ●●●●●●●●●● ● ● ● ● ● ● ● ● ● ● ● ● ● ● ● ● ● ● ●●●●●●●●● ●● ●● ●●●●●● ● ● ● ● ●●●●●●●●●●● ● ● ● ● ●●●●●●●●●●●●●●●●●●●●●●●●●●●●●●● ● ●●●●●●●●●● ● ● ● ●●●● ● ● ● ● ●●● ● ●●●●●●●● ●●●●●●●●●●●●●●●●● ●●●●●● ● ●●●●●●● ● ● ●●●●●● ● ●●●●●●●●●●● ●●● ●●●●●●●●● ● ●● ●●● ● ● ●●●●●●● ● ●●● ●●●● ● ●●●●●●●●●●●●●●●●●●●●●●●●●●●●● ●●●●●●●●●● ● ● ● ● ● ●●● ●● ● ●●●●●●●●● ● ● ● ●●●●●●●●●●●●●●●●●●●●●●●●●●●●●●● ● ●●● ●●●●●●●●●●●●●●●●●●●●●●●●●●● ● ●●●●●●●● ● ● ● ● ●●● ●●●● ● ● ● ●●●●●●●●●● ●●● ● ●●●●●●●●●●●●● ● ● ●● ●●●● ●●●●● ●●●●●●●●●●●●●●●●●●●●●●●●●●●●●●●●●●●●●● ● ●●●●●●●● ● ● ●●●●●●●●●●●●●●●●●●●●●●●●●●●●●●●●●●●●●●●● ● ● ● ● ● ● ● ● ● ● ● ● ● ● ● ● ● ● ● ● ● ● ● ● ● ● ● ● ● ● ● ● ● ● ● ● ● ● ● ● ● ● ● ● ● ● ● ● ● ● ● ● ● ● ● ● ● ● ● ● ● ● ● ● ● ● ● ● ● ● ● ● ● ● ● ● ● ● ● ● ● ● ● ● ● ● ● ● ● ● ● ● ● ● ● ● ● ● ● ● ● ● ● ● ● ● ● ● ● ● ● ● ● ● ● ● ● ● ● ● ● ● ● ● ● ● ● ● ● ● ● ● ● ● ● ● ● ● ● ● ● ● ● ● ● ● ● ● ● ● ● ● ● ● ● ● ● ● ● ● ● ● ● ● ● ● ● ● ● ● ● ● ● ● ● ● ● ● ● ● ● ● ● ● ● ● ● ● ● ● ● ● ● ● ● ● ● ● ● ● ● ● ● ● ● ● ● ● ● ● ● ● ● ● ● ● ● ● ● ● ● ● ● ● ● ● ● ● ● ● ● ● ● ● ● ● ● ● ● ● ● ● ● ● ● ● ● ● ● ● ● ● ● ● ● ● ● ● ● ● ● ● ● ● ● ● ● ● ● ● ● ● ● ● ● ● ● ● ● ● ● ● ● ● ● ● ● ● ● ● ● ● ● ● ● ● ● ● ● ● ● ● ● ● ● ● ● ● ● ● ● ● ● ● ● ● ● ● ● ● ● ● ● ● ● ● ● ● ● ● ● ● ● ● ● ● ● ● ● ● ● ● ● ● ● ● ● ● ● ● ● ● ● ● ● ● ● ● ● ● ● ● ● ● ● ● ● ● ● ● ● ● ● ● ● ● ● ● ● ● ● ● ● ● ● ● ● ● ● ● ● ● ● ● ● ● ● ● ● ● ● ● ● ● ● ● ● ● ● ● ● ● ● ● ● ● ● ● ● ● ● ● ● ● ● ● ● ● ● ● ● ● ● ● ● ● ● ● ● ● ● ● ● ● ● ● ● ● ● ● ● ● ● ● ● ● ● ● ● ● ● ● ● ● ● ● ● ● ● ● ● ● ● ● ● ● ● ● ● ● ● ● ● ● ● ● ● ● ● ● ● ● ● ● ● ● ● ● ● ● ● ● ● ● ● ● ● ● ● ● ● ● ● ● ● ● ● ● ● ● ● ● ● ● ● ● ● ● ● ● ● ● ● ● ● ● ● ● ● ● ● ● ● ● ● ● ● ● ● ● ● ● ● ● ● ● ● ● ● ● ● ● ● ● ● ● ● ● ● ● ● ● ● ● ● ● ● ● ● ● ● ● ● ● ● ● ● ● ● ● ● ● ● ● ● ● ● ● ● ● ● ● ● ● ● ● ● ● ● ● ● ● ● ● ● ● ● ● ● ● ● ● ● ● ● ● ● ● ● ● ● ● ● ● ● ● ● ● ● ● ● ● ● ● ● ● ● ● ● ● ● ● ● ● ● ● ● ● ● ● ● ● ● ● ● ● ● ● ● ● ● ●●●●● ●●● ●● ●● ●● ●● ●●● ● ●●●● ● ●●●●● ● ● ● ● ● ● ● ● ●● ●●●●●●●●●●●● ● ● ● ● ● ●●●●●●●●●●●●●● ●●●● ●●●●●●●●●●● ● ●●●●●●● ●●●●● ●●●●●●●●●●●●●●● ●●●●●●●●●●● ● ●● ●●●●●● ●●●●●●●●●●●●●●●● ● ●●●●● ● ● ●●●●●●●●● ● ●● ● ● ●●●●●●●●●● ●●●●●●●●●●●●●●●●●● −150 −100 −50 0 50 100 150 −15 −10 −5 0 5 10
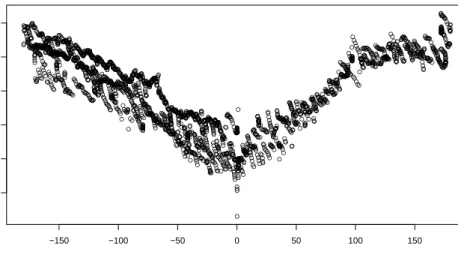
Magnetic heading deflection vs reference heading
heading[deg]
deflection[deg]
Figure 3.2: Magnetic heading deflection vs. reference heading
● ● ● ● ● ● ● ● ● ● ● ●●●●●●●●●●●●●●●●●●●●● ● ● ● ●●●●●● ● ● ● ● ● ● ●●●●●●●●●●●●●●●●●●●●●● ● ● ●●●●●●●●●●●●●●●●●●●●●●●●● ● ● ● ● ● ● ● ● ● ● ● ●●●●●●●●●●●●●●●●●●●●●●●●●●●●●●●●●●●●●●●● ● ● ● ● ● ● ● ● ●●●●●●●●●●●●● ●●●●●●●●●●●●●●●●●●●●●●●●●●●●●●●●●●●●●●●●●●●●●●●●●● ● ● ● ● ● ● ● ● ● ● ●●●●●●●●●●●●●●● ● ● ● ● ● ● ● ● ● ●●●●●●● ● ● ● ● ● ●●● ● ● ● ● ● ● ● ● ● ●●●●●●● ● ● ● ● ● ●●●●●●●●●●●●●●●●●●●●●●●●●●●●●●●● ● ● ● ● ●●●●●●●●●●●●●●●●●●●●●●●●●●●●●●●●●●●●●●●●●●●●●●●●●●●●●●●●●●●●●●●●●●● ● ● ● ● ● ●●●●●●●●●●●●●●●●●●●●●●●●●●●●●●●●●●●●●●●●●●●●●●●●●●●●●●●●● ● ● ● ● ●●●●●●●●●●●●●●●●●●●●●●●●●●●●●●●●● ● ● ● ●●●●●●●●●●●●●●●●●●●● ● ● ● ● ●●●●●●●●●●●●●●●●●●●●●● ● ● ●●●●● ● ● ● ● ● ● ● ● ● ● ● ● ● ● ● ● ● ● ● ●●●●●●●●●●●●●●●●●●●●●●●●●●●●●●●●●●●●●●● ● ● ● ● ● ● ● ● ● ●●●●●●●●●●●●●●● ● ● ● ● ● ● ● ● ● ●●●●●●●●●●●●●●●●●●●●●● ● ● ●●●●●●●●● ● ● ● ●●●●●●● ● ● ● ● ● ● ●●●●●●●●●●●●●●●●●●●●●●●● ●●●●●●●●●● ● ● ●●●●●●●●●●●●● ● ● ● ● ● ● ● ● ● ● ● ●●●●●●●●●●●● ● ● ● ● ● ● ● ● ● ● ● ● ● ● ● ● ● ● ● ● ● ● ● ● ●● ● ● ● ● ● ● ● ● ● ● ● ● ● ● ● ● ● ● ● ● ● ● ● ● ● ● ● ● ● ● ● ● ● ● ●● ● ● ● ● ● ● ● ● ● ● ●●●●●●●● ● ● ● ● ●●●●●●●● ● ● ● ● ●●●●●●●●●●●●●●●●●●●● ● ● ● ● ●●●●●●●●●●●●●●●●●●●●●● ● ● ●●●●●●●●●●●●●●●●●●●●●●●●● ●●●●●●●●●●●●●●●● ● ● ● ● ● ● ● ● ●●●●●●●●●● ● ● ●●● ● ● ● ● ● ● ● ● ● ●●●●●●●●●●●●●●●●●●●●●●●●●●●●●● ● ● ● ● ● ● ●●●●●●●●●●●●●●●●●●●●●●●●●●●●●●●●●●●●●●●●●●●●●●●●●●●●●●●●●●●●●●●●●●●●● ● ● ● ●●●●●●●●●●●●●●●●●●●●●●●●●●●●●●●●●●●●●●●●●●●●●●●●●●●●●●●●●●●●●●●●●●●●●●●●●●●●●●●●●●●●●●●●●●●●●●●●●●●●●●●●●●●●●●●●●●●●●●●●●●●●●●●●●●●●●●●●●●●●●●●●●●●●●●●●●●●●●●●●●●●●●●●●●●●●●●●●● ● ● ● ● ●●●●●●●●●●●●●●●●●●●●●●●●●●●●●●●●●●●●●●●●●●●●●●●●●●●●●●●●●●●●●●●●●●●●● ● ● ● ●●●●●●●●●●●●●● ● ● ● ● ● ● ● ● ● ● ●●● ● ● ● ● ● ● ● ● ● ●●●●●●●●●●●●●● ● ● ● ● ● ● ● ● ● ● ●●● ● ● ● ● ● ● ● ● ● ●●● ● ● ● ● ● ● ● ● ● ●●● ● ● ● ● ● ● ● ● ● ● ●●●●●●●●●●●● ●●●●●●●●●●●●●●●●●●●●●●●●●●●● ● ● ● ● ● ● ● ● ● ● ● ● ● ● ● ● ● ● ● ● ●● ● ● ● ● ● ● ● ● ● ● ● ● ● ● ● ● ● ● ● ● ● ● ●●●●●●●●●● ● ● ●●●●● ● ● ● ● ● ● ● ●●●●● ● ● ● ● ● ● ● ●● ● ● ● ● ● ● ● ● ● ● ●●●●● ● ● ● ● ● ● ● ●●●●●●●●●●●●●●●●●● ● ● ● ● ● ● ●●●●●● ● ● ● ● ● ● ●● ● ● ● ● ● ● ● ● ● ● ●●●●●●●●●●●● ●●●●●●●●●●●●●● ● ● ● ● ● ● ● ● ● ● ● ● ● ● ● ● ● ● ● ● ● ● ●●●●● ● ● ● ● ● ● ● ● ● ● ● ● ● ● ● ● ● ● ● ● ●● ● ● ● ● ● ● ● ● ● ● ● ● ● ● ● ● ● ● ● ● ● ● ●● ● ● ● ● ● ● ● ● ● ● ● ● ● ● ● ● ● ● ● ● ● ● ●●●● ● ● ● ● ● ● ● ● ● ● ● ● ● ● ● ● ● ● ● ● ● ● ● ● ● ● ● ● ● ● ● ● ●●●● ● ● ● ● ● ● ● ● ● ● ● ● ● ● ● ● ● ● ● ● ●●● ● ● ● ● ● ● ● ● ● ●● ● ● ● ● ● ● ● ● ● ● ●●● ● ● ● ● ● ● ● ● ● ● ● ● ● ● ● ● ● ● ● ● ● ●●●●●●●●●●●●● ● ● ● ● ● ● ● ● ● ● ● ●●●●●● ● ● ● ● ● ● ●●●●●●●● ● ● 0 500 1000 1500 −150 −50 0 50
Magnetic heading deflection vs. location (steel staircase)
sample
deflection[deg]
Magnetic heading deflection histogram deflection[deg] Frequency −150 −50 0 50 100 0 200 400 600
Chapter 4
Localization model
This chapter covers all the components of necessary for a localization system based on dead reckoning with step detection and absolute location estimates from WiFi signal strength measurements.
4.1 Motion measurements 4.1.1 Step detection
Other studies ([12], [8], [5]) dealing with the step detection by means of an accelerometer usually used a dedicated accelerometer unit placed on a suitable part of a body e.g. foot, hip or belt, which had considerable influence on the detection precision. We do not have the option of attaching an external unit to the handheld device, which means the accelerometer will pick-up all users hand motions, not only those caused by walking.
4.1.1.1 Human locomotion
Walking (also ambulation), according to Wikipedia (article "Walking") [?], is defined by “an ’inverted pendulum’ gait in which the body vaults over the stiff limb or limbs with each step.” The inverted pendulum motion is characteristic also for other gaits like running, dif-fering mainly in the amount of take-off from the standing limb and causes a bobbing motion of the upper body and the connected limbs (hands). The bobbing motion, being universally present in all types of gaits, will be our main feature upon which to base the step detection methods.
4.1.1.2 Required sampling rate
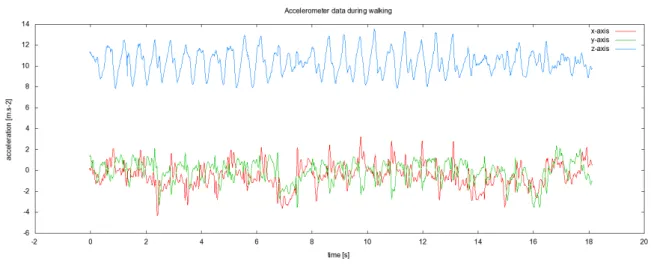
According to the Nyquist–Shannon sampling theorem, required sampling rate for the detec-tion of steps, under the assumpdetec-tion that the maximum walking speed is 3Hz, accelerometer must provide sampling frequence at least doubling the value, ie. 6Hz. This criterion is com-fortably within the capability of our test device (Galaxy Tab), which provides rates as high as 100Hz.
4.1. MOTION MEASUREMENTS
Figure 4.1: Accelerometer signal on the z-axis (vertical) during several steps measured at 100Hz sampling rate.
4.1.1.3 Signal processing tools
The following list contains digital signal processing filters [19] suitable for step detection application:
• Low-pass filter - removes high frequency components of the signal. This is impor-tant to avoid false steps when zero crossings or extrema detection method is used.
• Power threshold filter - computes signal power, which is used for identification of silence zones.
• Step duration change filter - Uses similar technique as fundamental frequency de-tection in human voice. It is probable that the duration of two succeeding steps doesn’t change too much. Detected step candidate can be rejected e.g. when its du-ration is less then half of the dudu-ration of the previous step.
• Correlation comparison filter - computes similarity of two signals by computing their correlation.
We started the step detection algorithm by implementing two moving average filters with different window sizes. The longer moving average (window size 0.2s which is 20 sample on 100Hz sampling rate) is used as an estimation of average value of G-force projec-tion on the z-axis. The shorter moving average (windows size of 0.05s, 5 samples on 100Hz sampling rate) is a low-pass filter that removes the high frequency components from the signal. Candidate steps are detected as intersections of the two moving average signals.
4.1. MOTION MEASUREMENTS while standing still when the moving averages still intersected and detected false positives. Because of these, the algorithm was extended with a power threshold filter, that defines the walking vs. non-walking zones in the signal.
The algorithm still detects false steps due to acceration signal noise caused by manipu-lation with the held device, however we decided to handle these false steps by successive mathematical processing rather than trying to filter them out.
Power threshold has to be configured manually, no self-adjusting algorithm was em-ployed.
4.1.2 Stride length estimation
During the implementation of the dead reckoning module, we noticed that the variability in step length has substantial effect on the localization precision. Through observation we deduced that there might be a dependency between the stride length and the walking fre-quency. Independent studies performed on other species than human supported the obser-vation, however no suitable study was found so we decided to make our own measurements to support the hypothesis and to create an estimation model that we could include in our implementation.
4.1.2.1 Experiment setup
A path with fixed length (38.4 meters) was used to take the measurements. A human subject walked the path at a constant walking rate maintained by a metronome. Number of steps taken were counted. From the number of steps and the distance walked, the average stride length was computed.
4.1.2.2 Measurement results and derived model
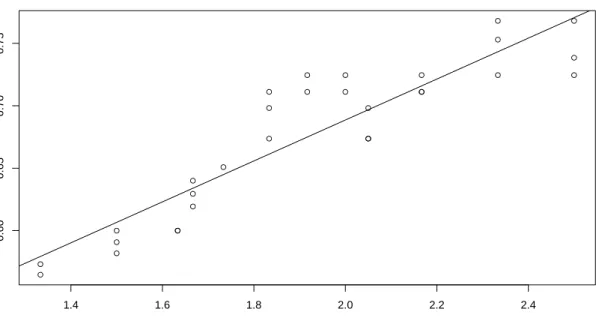
The measurement results support our hypothesis and from the picture is clear that the fre-quency and step length have strong linear correlation and the measured data also show the longest step to be 40% longer than the shortest step which pinpoints the source of the inaccuracy in the step model. Tested subject reported that the walking pace was becom-ing uncomfortable under 80bpm and at and over 150bpm. Within the interval of, let’s say, comfortable walking frequency, the linear dependency between frequency and stride length seems to hold.
We are aware of inconclusivity of a test conducted on a single person, where obviously more biomechanical parameters of the subject come into play, nevertheless we will still count with the assumption of the linear dependency of the stride frequency and length in our model.
4.2. DEVICE ORIENTATION ● ● ● ● ● ● ● ● ● ● ● ● ● ● ● ● ● ● ● ● ● ● ● ● ● ● ● ● ● ● 1.4 1.6 1.8 2.0 2.2 2.4 0.60 0.65 0.70 0.75
Stride length vs. stride frequency
linear regression fit: length = 0.3608 + 0.1639 * freq
frequency[Hz]
str
ide length [m]
Figure 4.2: Dependency of stride length on stride frequency 4.2 Device orientation
4.2.1 Coordinate system
In the following text whenever we metion a device coordinate system, we mean the Android standard coordinate system defined relative to the device’s screen [22]: “When a device is held in its default orientation, the X axis is horizontal and points to the right, the Y axis is vertical and points up, and the Z axis points toward the outside of the screen face. In this system, coordinates behind the screen have negative Z values.”
4.2.2 Magnetic heading
The magnetometer provides device’s heading relative to the Earth’s magnetic pole. The problematic part is that indoor environments contain structural elements or electronic equip-ment that may have significant effect on magentic field and therefore on orientation mea-surements. For devices that are not equipped with other means of orientation sensing is the inaccurate magnetometer the only way. The responsibility to make orientation corrections
4.2. DEVICE ORIENTATION 4.2.3 Sensor Fusion
Although the magnetometer is subject to error, it is the only sensor that can provide the ab-solute north-bound heading. Gyroscope provide much precise orientation estimate derived from the angular rotation measurements, however it is subject to integration drift and will require recalibration after some time. Clever combination of these two sensors can diminish the deficiencies of both. Combination of sensors in this way is called sensor fusion.
4.2.4 Gyroscope orientation 4.2.4.1 Frames of reference
Sensor units are firmly attached to the smartphone. In order to express orientation of the de-vice by means of sensor measurements we must transfer the measurements and the derived orientation from one frame of reference to another.
We adopt the definitions used in Woodman [20] and refer to “the navigation system’s frame of reference as thebody frameand to the frame of reference in which we are navigat-ing as theglobal frame.”
4.2.4.2 Coordinate system rotations
Gyroscope produces a sensor event with a measured angular rate vector ofφ= (φx, φy, φz).
The size of the vector represents the total angular rate of the body frame of reference in the global frame. We use this vector to transform our base matrix by the axis and angle rotation. The angleθequals to the the size of the vector divided by theθ=|φ|=qφ2
x+φ2y+φ2z. The
normalized vectoru = (ux, uy, uz) = √φ2 φ x+φ2y+φ2z
defines the axis of rotation. The transfor-mation matrix for axis and angle rotation is:
Equation 4.2.1: Rotation matrix from axis and angle
4.2.4.3 Alignment to the global frame of reference
Relative angular rate sensor measurements are corrected by the absolute measurements from the magnetometer and accelerometer. Alignment is done separately for the accelerom-eter and magnetomaccelerom-eter vector. Alignment vector coordinates are first converted to the global frame of reference coordinate system. Alignment is done by rotating the global frame of ref-erence so that the global frame z-axis vector matches the acceleration vector and the global
4.3. WIFI LOCALIZATION METHODS frame y-axis vector matches the magnetic field vector’s projection into the xy-plane. In at-tempt to mitigate the undesirable effects mentioned in Section 4.2.3). The mathematical tool for combining two distinct sensor inputs is called thecomplementary filter.
4.2.4.4 Complementary filter
Complementary filter is another name for a weighted average in digital signal processing jargon. This filter adds together two separate signals at a constant ratioβ. The equation of the filter is Equation 4.2.2 [7], where θrel is the relative angle update,θabs is the absolute
angle update.
θ=β∗θrel+ (1−β)θabs
Equation 4.2.2: Complementary filter equation
We want to be the relative sensor input from the gyroscope the main reference input, the
βless than 0.5. The size of theβis chosen according to the formula Equation 4.2.3 [6], where T is the time constant of the low-pass filter, dt is the sampling period (e.g. 0.01s for 100Hz rate).
T = (1−ββ)dt →β = T+dtdt
Equation 4.2.3: Complementary filter time constant
For example, for the low-pass window of 5 seconds at 100Hz sampling rate we receive
β= 5+00.01.01 = 0.002
4.3 WiFi Localization Methods 4.3.1 Chosen localization model
Triangulation is possible in environments where a propagation loss model can translate sig-nal strength measurements into distance from the known locations of WiFi access points (APs). In the university buildings, location of WiFi APs is not centrally known, and even creating the database of locations would left us without a suitable propagation model. So instead, we decided go with the RSS fingerprint approach to use in our system.
4.3.2 RSS fingerprinting
Positioning techniques based on fingerprinting have two phases:
cre-4.4. SEQUENTIAL MONTE CARLO FILTERING sic service set identification - unique Access Point ID) and the strength of received signal (in dBm).
On-line phase In the online phase, regular AP scans are done and resulting fingerprints are compared against the database of reference fingerprints. Location of the best matching candidate is returned as the estimated location based on a chosen metric.
4.3.3 Delaunay triangulation
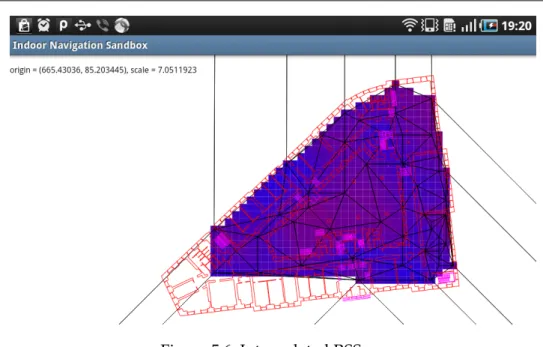
The phase of gathering fingerprints can be simplified [4] by gathering smaller amount of fingerprints and interpolating the full map. The measured map is triangulated with the De-launay algorithm. The triangulation algorithm splits the area into non-overlapping triangle mesh, where each location in the plane is uniquely assigned three vertexes of the triangle in which it is contained. At that point full linear interpolation of the map can be recreated from the barycentric coordinates of the location in the triangle. Care has to be taken when design-ing the initial fdesign-ingerprint set to avoid inducdesign-ing error with linear interpolation in places with larger signal gradient. This is the technique we used. We created basic fingerprint sets on the ground floor of the Faculty of Social Studies and on the 2nd floor of the Faculty of Arts library. Example of the interpolated map can be seen on Figure 5.6
4.3.4 Fingerprint metrics 4.3.5 Location finding methods 4.3.5.1 Nearest neighbor method 4.3.5.2 Probability map
4.4 Sequential Monte Carlo filtering
The key idea of the sequential Monte Carlo (SMC) filtering is modelling the state of a dy-namic system by aproximating the posterior density function by a set of random samples of the state vector while sequence of noisy measurements are made on the system.[2]
The computation of the SMC requires two models [2]:
1. System model - model describing the evolution of the state with time 2. Measurement model - model relating the noisy measurements to the state
Filter processes events from the step detector (step event, length estimate) and a proba-bility density function from the WiFi AP scans.
4.4. SEQUENTIAL MONTE CARLO FILTERING 4.4.1 State model
First version of the state vector of the modeled system held only the hypothetical location coordinates of the pedestrianstate = [x, y]. We later extended the model also by heading deflection and stride length:state = [x, y, hdg, len]. The extension enabled the application to gradually ’learn’ these two parameters and improved localization precision. Especially heading correction caused a big improvement. During tests the user of the localization ap-plication often doesn’t hold the smartphone in exactly the direction he or she walks. Usually a smartphone held in the right hand points slightly to the right and vice versa.
Any moving particle is subject to spatial constraints imposed by the building walls and other structures. Particles, whose hypothetical motion leads through impassable obstacles are removed from the set.
4.4.2 Measurement model
The state model is updated by two kinds of measurement events:
• Step events from the step detector
• WiFi location probability map
The step event accompanied with a heading in which the step was taken. The heading is a normally distributed random variable with configurable standard deviation.
The probability map is a grid-based probability density function that maps location(x, y)
to a probabilityα. On the WiFi update event, particles that belong to grid point with coordi-nates(x, y)are removed with probability1−α.
4.4.3 Pedestrian Monte Carlo localization algorithm with map matching The following code shows the update step of the localization filter:
particle state is a vector of (x, y, hdg, length) void onStep(heading) {
for all states in the particleSet do {
# add measurement noise according to the respective distributions lengthWithNoise = length + lengthMeasurementNoise
headingWithNoise = heading + headingMeasurementNoise
# compute the new state, only the x, y coordinates are updated
newX = state.x + state.lengthWithNoise * cos(state.hdg + headingWithNoise) newY = state.y + state.lengthWithNoise * sin(state.hdg + headingWithNoise) particleTrajectory = (state.x, state.y, newX, newY)
4.4. SEQUENTIAL MONTE CARLO FILTERING # check for collision with walls
collided = collisionModel.checkCollision(particleTrajectory) if (collided) {
remove particle from the set }
}
# resample the set by multiplying randomly selected particles from the set resample(particleSet)
Chapter 5
Implementation of the Pedestrian Navigation System
The following chapter describes the environment for which the pedestrian navigation sys-tem is designed, internal design and interfaces of the syssys-tem and the decisions we faced during its implementation.
5.1 Android
The system is implemented for the Android operating system as requested by the project assignment. Android is an opensource Linux-based operating system intended primarily for personal mobile communication devices such as smartphones and tablet computers. It is developed by the Open Handset Alliance, led by Google, and other companies [?]
Android consists of a kernel based on the Linux kernel, with middleware, libraries and APIs written in C an application software running on an application framework which in-cludes Java-compatible libraries based on Apache Harmony. Android uses the Dalvik vir-tual machine with just-in-time compilation run Dalvik dex-code (dalvik executable). [22]
In the following text, we often mention Android activities. Android Dev Guide [22] de-fines an activity as “an application component that provides a screen with which users can interact in order to do something, such as dial the phone, take a photo, send an email, or view a map. Each activity is given a window in which to draw its user interface.”
5.1.1 Android SDK and NDK
Two different frameworks can be used when writing an application for Android:
• SDK – Standard Development Kit
• NDK – Native Development Kit
Android SDK is a set of tools for writing and deploying Android applications written in Java. NDK is an extension of the SDK that lets developers write performance-critical por-tions in native code (in C or C++). It provides headers and libraries that allow developers to build activities, handle user input, use hardware sensors, access application resource. [21]
The initial discussions suggested that the programming code is written C/C++ with the Android NDK in order to allow for simpler portability to Apple iOS, but the Android
de-5.2. SYSTEM DESIGN from writing native code, due to increased code complexity, unless some of the native APIs unsupported in the framework are required, so we decided to stay with the Java version of the program.
5.1.2 Target API Version
The application was written for the Android API 8 (Android V2.2 ). This decision is based merely on the API version available on the Galaxy Tab device on which this project was developed and tested.
5.1.3 Android Integration
We investigated ways how to inject our pedestrian localization component into the Android system framework, so that 3rd party components can register for reception of the location events. Currently Android doesn’t support registration of proprietary location provider so a sibling LocationManager called PedestrianLocationManager was created. This class wraps the in-system LocationManager together with the implementation of all the pedestrian lo-calization methods described in the previous chapter Chapter 4, “Lolo-calization model”. 5.2 System Design
5.2.1 External Interfaces
The PedestrianLocalizationManager reuses the Android LocationManager interface, which serves for registering LocationListeners for location update events.
5.2.1.1 Android Framework Interfaces
The navigation system uses several Android system services as data sources for the local-ization algorithm:
SensorManager class for accessing device’s hardware sensors. It registers SensorListeners for individual Sensors. The listeners are then periodicly updated when sensor val-ues change.
WifiManager serves as a primary API for WiFi connectivity management. We use the class for starting and retrieving results of the access point scans.
LocationManager class for accessing the system location services. These services supply applications with updates of the device’s geographical location.
5.2. SYSTEM DESIGN
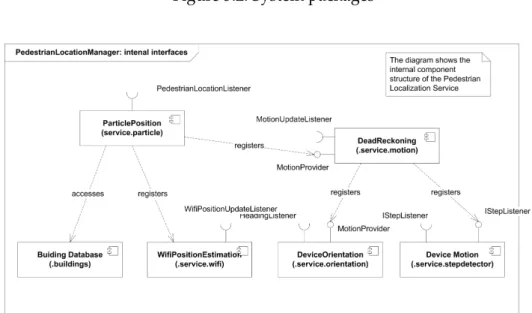
Figure 5.1: Context of the Pedestrian Localization Service 5.2.2 Intercomponent interfaces
PedestrianLocationManager components:
• Dead reckoning component
– Compass (magnetic, gyroscopic, combined gyromagnetic) – StepDetector
– StepLengthEstimator
• RssFingerprintController
• ParticlePosition
Compass module – receives data from the accelerometer, gyroscope and magnetometer sensors and combines them in estimation of coordinate system connected with the building. Step detection module registers for accelerometer signal updates and generates step events.
DeadReckoning component combines the events from the Compass and Step Detector and produces relative position update events.
5.3. THE PEDESTRIAN NAVIGATION SANDBOX APPLICATION Particle filter – registers for relative location updates from the dead-reckoning compo-nent and events from the WiFi interface and combines the two together in a posterior prob-ability density function approximation.
Figure 5.2: System packages
Figure 5.3: Pedestrian Localization Service
5.3 The Pedestrian Navigation Sandbox application
The installation .apk package is available on the attached CD. The application contains a set of demonstration activities that show functioning of individual system subcomponents:
• Pedestrian Navigation Prototype
• Precision Evaluation Activity
5.3. THE PEDESTRIAN NAVIGATION SANDBOX APPLICATION – Step Detection
– Acceleration FFT
– Magnetic Compass Demo – Gyro Compass
– Combined Gyro & Magnetic Compass – Acceleration FFT
– Magnetic Compass Deflection Demo
• Radio Positioning Methods – WiFi RSS Map
– WiFi RSS Scanner
– Delaunay Triangulation Demo – Location Provider Demo
• Stochastic Position Computation Methods – Discrete Stochastic Model
– Particle Filter Model
• Preferences
5.3.1 Pedestrian Navigation Prototype Activity
Pedestrian Navigation Prototype activity contains fusion of all the implemented navigation methods with a visualization of the estimated location.
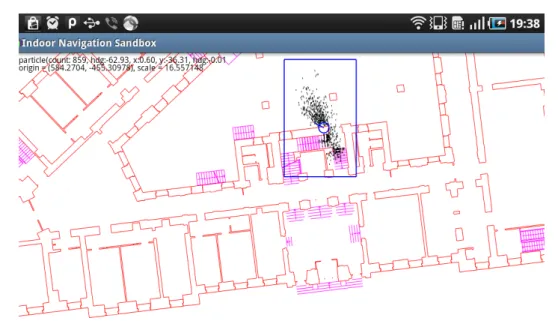
5.3.1.1 Graphical interface
Activity view shows visualization of the user position in the building plan: Probability den-sity function aproximated by the particle cloud with a piper on the average position, walls (red lines) and stairs (magenta lines) of the particle collision model and transition edges (cyan). Particle color changes between black for particles in the currently selected area/floor
5.3. THE PEDESTRIAN NAVIGATION SANDBOX APPLICATION
Figure 5.4: Pedestrian Navigation Prototype screen 5.3.1.2 User Controls
Activity GUI allows user to pan and zoom around the building plan by using slide and scale gestures.
Further user actions are accessible via the activity menu:
Select floor by selecting this item, user can make a selection of the currently displayed floor Set position action to manually reset initial position of the particle filter. After this item is selected, user must set the new position by tapping a desired location in the build-ing plan. New position of the particle filter is set to the coordinates of the tap on the currently selected floor.
Reset compass action to manually realign compass heading, if the integration drift or local magnetic field fluctuation cause unacceptable deflection. Reset behaviour differs for gyroscopic and combined gyromagnetic compass. Gyroscopic compass aligns to the device’s coordinate system (i.e. north heading in the direction of the top of the screen, east heading to the right). Gyromagnetic compass aligns to match current gravitational acceleration and magnetic field vectors.
5.3. THE PEDESTRIAN NAVIGATION SANDBOX APPLICATION Pause/Resume action to pause or resume sensor data streams
Help action launches the instruction file in a viewer
5.3.2 Precision Evaluation Activity
This activity is a modified PedestrianNavigationPrototype with different controls used for testing the precision of the system. Graphical interface and all control elements apart from the menu remained the same. More on the precision evaluation testing in Chapter 6, “Preci-sion evaluation”.
5.3.2.1 User Controls
Select floor, Set position and Reset compass menu items remained the same and kept the same functinality. Settings, Pause and Help items were replaced by new three items:
Log attempt action writes a new evaluation log entry. The log contains the distance of the actual average location to the destination location in meters, the coordinates of the destination location and a timestamp of the log creation.
Pick next action randomly generates a new destination location.
Set destination action sets the destination location manually. Location coordinates are en-tered by tapping the screen.
5.3.3 Step Detection Activity
Step Detection Activity provides visualization of the step detection method and helps tuning the step detection parameters. Displayed signals are, from the top to bottom:
• cumulated signal power - the sum of power since the last crossing of the moving averages (see next point). On positive step detection, the power must reach over the red line (the threshold).
• two moving averages, with marked crossings - red circles represent step event can-didates with insufficient cumulated signal power level. Green circles are reported step events.
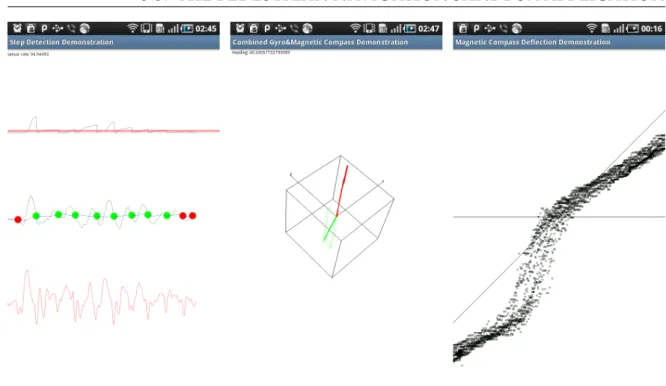
5.3. THE PEDESTRIAN NAVIGATION SANDBOX APPLICATION
Figure 5.5: Orientation Demos Screenshot (from left to right): 1. Step Detection Activity, 2. Combined Gyro & Magnetic Compass Activity, 3. Magnetic Compass Deflection Activity 5.3.4 Acceleration FFT
Acceleration FFT activity displays the Fast Fourier transform of the input accelerometer signal on the z-axis. The tool was used to gather data for pattern matching of possible step events. In the upper part of the screen, black line is the original accelerometer signal on the z-axis, blue line is the computed FFT of the signal. Lower half of the screen is another graphical representation of the signal’s spectrum.
5.3.5 Compass Demonstration Activities
MagneticCompass, GyroCompass, GyromagneticCompass activities serve as visualization and debugging tools for the three types of compasses. The MagneticCompass provides heading value supplied by the in-system Orientation sensor. GyroCompass and GyroMag-neticCompass track devices orientation in 3d space by processing gyroscope, accelerometer and magnetometer sensors. Difference between the two gyro compasses is that the latter contains mechanism to align orientation to gravitational acceleration and magnetic field vectors, while the former doesn’t and therefore is subject to integration drift. Amount of integration drift over time can be assessed by playing with the tool. The following text is relevant only for the gyroscopic versions of the activities.
5.3. THE PEDESTRIAN NAVIGATION SANDBOX APPLICATION 5.3.5.1 Graphical interface
Both gyro compass activities show a world coordinate system orientation visualization rep-resented by three orthogonal axis x, y, and z and a wire cube for better depth perception.
Visualization contains vectors acceleration (red) and magnetic field (green) with bound-ing boxes in the correspondbound-ing colors.
5.3.5.2 User Controls
Tapping the screen realigns the coordinate system. In the GyroMagnetic compasss activity, the speed of alignment for configured parameters can be observed.
5.3.6 Magnetic Compass Deflection Demo Activity
This activity was used to measure data for graphs of mangetic compass deflection in depen-dence on location and device orientation in Section 4.2. Procedure used for retreiving data for the graphs is also described there.
5.3.6.1 Graphical interface
The activity screen displays dependence between gyroscopic compass heading and mag-netic compass heading, with gyro compass heading placed on the X-axis (horizontal line with zero in the center of the screen), and magnetic heading on the Y-axis (not displayed). The quadrant axis (the line across) represents a direct proportion and serves as a visual clue for assessing dependency between the two variables.
5.3.7 WiFi RSS Map
WiFi RSS Map activity provides visualization and recording capabilities for WiFi RSS fin-gerprints.
Works in three regimes: idle/viewing, location finding, recording. Location finding regime displays an updated location probability map on every finished RSS scan. In recording regime, a reference RSS fingerprint is recorded on a chosen location.
5.3.7.1 Graphical interface
Activity view of the interpolated fingerprint map on the building plan. Fingerprint RSS values are displayed on a square grid mesh with a blue-red color ramp.
5.3.7.2 User Controls
Activity view allows user to pan and zoom around the building plan by using slide and scale gestures.
5.3. THE PEDESTRIAN NAVIGATION SANDBOX APPLICATION
Figure 5.6: Interpolated RSS map
Select floor by selecting this item, user can make a selection of the currently displayed floor
Select BSSID Lets the user choose the network to be displayed or ’maximum’. If maximum is selected, the grid displays the value of the strongest signal present in that location.
Add fingerprint starts fingerprint recording
Find location Enters location finding regime.
Clear database Permanently deletes fingerprint database in the currently building area (floor).
5.3.8 WiFi RSS Scanner
An activity for inspection of the local access point RSS levels. This activity works in similar way to the WiFi RSS Map activity, with the difference that no map is shown and no location context is used for fingerprints, i.e. artificially generated coordinates are used when creating new fingerprints in the database. Scanned access-point RSS values are logged on the screen in textual form.
5.3. THE PEDESTRIAN NAVIGATION SANDBOX APPLICATION 5.3.8.1 User Controls
Activity is controled solely by means of menu actions. Available actions are:
Add fingerprint by selecting this item, the activity enters the fingerprint recording state. Scanned access-points RSS values are saved and their average computed during the duration of the recording mode.
Find location This action starts the location finding regime. Scanned access-point RSS val-ues are compared to the fingerprint database and the closest match is printed on the screen.
Clear database This action renews the RSS fingerprint database. File for storing the finger-prints on the flash drive is deleted and recreated.
Help Action opens readme file in a viewer
5.3.9 Delaunay Triangulation Demo
Toy activity for familiarization with the Delaunay triangulation algorithm. The activity iter-atively generates Delaynay triangulation from a set of points input by tapping the screen. 5.3.10 Location Provider Demo
Simple logging activity of events from the Android LocationManager. Logs both GSM and GPS location events, with additional info about GPS satellites. The activity was used to study LocationManager events streams in locations where laptop connection wasn’t available. 5.3.11 Grid Stochastic Demo
Demonstration activity to show the basic functioning of a stochastic grid based location filter in space constrained by non-passable partitions. Tapping the screen generates a step event. The direction vector of the step is computed from the center of the screen to the coordinates where the screen was tapped. Length of the step is constant.
5.3.12 Particle Filter Demo
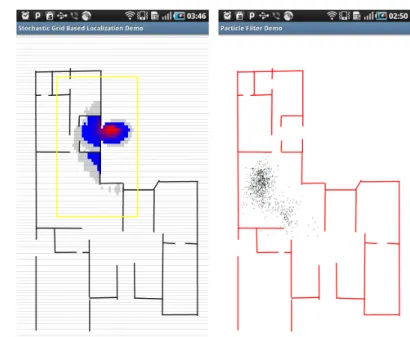
Demonstration activity to show the basic functioning of a particle filter, see Section 4.4 in space constrained by non-passable partitions. Steps are generated in the same way as in the
5.4. BUILDING PLAN DATA
Figure 5.7: Grid and Particle Filter Activity Screen 5.3.12.1 Graphical interface
The graphical interface uses the same visual elements as the PedestrianNavigationPrototype demo (see Section 5.3.1).
5.4 Building Plan Data
The system was tested in real buildings thanks to kind cooperation of colleagues from the Geographical Information Systems department of the Masaryk University (GIS ÚVT MU) who provided vector plans of several university buildings from the university technological passport.
5.4.1 Technological passport of the Masaryk University
The maps from the technological passport (accessible from the Maps Muni portal <http:// maps.muni.cz>, direct link <http://gisweb.muni.cz/TechnologickyPasport/>) contain information for management of university buildings. For navigation puposes only a fraction of the information was necessary so the provided plans had to be converted from the AutoDesk DWG format into a proprietory vector format containing only the parts of the building that can be used by the map matching models (i.e. walls, windows, stairs).
The building plans use the S-JTSK coordinate system, so a conversion to a common co-ordinate system is necessary.
5.4. BUILDING PLAN DATA
Figure 5.8: DWG plan of the 1st floor, block B of the faculty of informatics 5.4.2 AutoDesk DWG format conversion
AutoDesk DWG is a closed proprietary format for storing multilayer vector data and their description, however tools capable of opening the files and working with the contained data exist. We used the jdwglib (see <http://sourceforge.net/projects/jdwglib>) java library to extract the relevant layers and store the contained Line objects into a text file that can be read directly from the Android OS.
5.4.3 S-JTSK coordinate system
In order to use geographical data from different sources, the location coordinates must be converted to the same coordinate system. In our case the data provided by the Android system framework are in the WGS84 system, whereas the building plans use the S-JTSK coordinates in Kˇrovák’s projection.
The WGS-84 system is defined by a set of land stations and positions of satellites of the GPS navigation system. [9]
The S-JTSK coordinate is used by the Czech and Slovak Katastrální úˇrad (Office for Sur-veying, Mapping and Cadastre) and the projection is adapted to bear the highest precision for location withins the former Czechoslovakia, which means that the coordinates are not universally available for the whole world. Nevertheless the fact that the coordinates are in meters meant significant advantage, so we decided to use the S-JTSK as the reference co-ordinate system. This raised the requirement to implement also the coco-ordinate conversion
5.4. BUILDING PLAN DATA
Figure 5.9: Schema of the Kˇrovák’s projection[3]
Hrdina 2006 [9] publishes a coordinate conversion routine from WGS84 to S-JTSK written in Pascal. We rewrote this conversion routine to Java and used it in our project.
Chapter 6
Precision evaluation
The precision of our localization system was tested many times during the implementation phase to find and remove bugs and tune the localization algorithms. This chapter describes the procedures and presents the final formal test results of the system’s localization preci-sion.
6.1 Localization precision tests
The target of the testing was to get idea of the system precision in conditions close to real usage of the device.
Since not all Android devices are equipped with a gyroscope, it seemed sensible to test also the precision of the system while using the magnetometer for orientation measure-ments. The following tests were executed:
• Dead reckoning tests of particle filter with combined gyro-magnetic compass with known starting position
• Dead reckoning tests w/ WiFi localization, with gyromagnetic compass and un-known starting position
6.2 Evaluation method
Other studies on the topic use precise localization method, most commonly a LIDAR (LIght Detection and Ranging, optical technology to measure distances from target objects by illu-minating the target with laser pulses ), to establish ground truth against which to compare developed method during the total duration of movement.
As we didn’t have access to such equipment so we decided to measures localization error only at the end point of a randomly generated path. The arrival to the destination is estimated from the map and confirmed manually by the tester. The idea behind this kind of setup is that instead of measuring error between the computed and real position during the whole motion, error is measured only at randomly chosen points, which are at the same