St
udy
on
t
he
ef
f
i
ci
ency
and
ef
f
ect
i
venes
s
of
publ
i
c
s
pendi
ng
on
t
er
t
i
ar
y
educat
i
on
Mi
guel
St
.
Aubyn,
Ál
var
o
Pi
na,
Fi
l
omena
Gar
ci
a
and
Joana
Pai
s
Economi
c
Paper
s
390|
November
2009
EUROPEAN
ECONOMY
Economic Papers are written by the Staff of the Directorate-General for Economic and Financial Affairs, or by experts working in association with them. The Papers are intended to increase awareness of the technical work being done by staff and to seek comments and suggestions for further analysis. The views expressed are the author’s alone and do not necessarily correspond to those of the European Commission. Comments and enquiries should be addressed to:
European Commission
Directorate-General for Economic and Financial Affairs Publications
B-1049 Brussels Belgium
E-mail: [email protected]
This paper exists in English only and can be downloaded from the website ec.europa.eu/economy_finance/publications
A great deal of additional information is available on the Internet. It can be accessed through the Europa server (ec.europa.eu)
ISBN 978-92-79-13365-7 DOI: 10.2765/30348
Study on the efficiency and effectiveness
of public spending on tertiary education
Third report (second draft)
Miguel St. Aubyn,1 Álvaro Pina, Filomena Garcia, and Joana Pais ISEG - Technical University of Lisbon
December 2008
Abstract: Public tertiary education systems in the EU Member States are studied by comparing used resources with education and research outputs and outcomes. Efficiency in public tertiary education systems across EU countries plus Japan and the US is assessed with semi-parametric methods and stochastic frontier analysis. A core group of efficient countries is identified. A good quality secondary system, output-based funding rules, institutions’ independent evaluation, and staff policy autonomy are positively related to efficiency. Moreover, evidence is provided that public spending on tertiary education is more effective in what concerns labour productivity growth and employability when it is coupled with efficiency.
Key words: efficiency; effectiveness; public spending; tertiary education; universities
1 Team leader and corresponding author. ISEG, Rua Miguel Lupi, 20, P-1249-078 Lisboa (Portugal). E-mail:
Contents:
Introduction... 3
1. Concepts, data and preliminary analysis ... 5
1.1 Concepts... 5
1.2 A literature survey... 12
1.3 Data ... 16
1.3 Preliminary analysis ... 21
2. Efficiency Assessment ... 34
2.1 The semi-parametric analysis method ... 34
2.2 Main results from the semi-parametric analysis... 36
2.3 More results from the semi-parametric analysis: the "research" and the "teaching" models... 47
2.4 The stochastic frontier method ... 48
2.5 Results from the stochastic frontier analysis ... 50
2.6 A summary of efficiency results... 52
3. Effectiveness Assessment ... 55
3.1 The effectiveness assessment approach... 55
3.2 Effectiveness results concerning labour productivity... 56
3.3 Effectiveness results concerning employability ... 60
3.4 A summary of effectiveness results... 63
Conclusions... 65
Annex. Case studies. ... 68
Netherlands ... 68
United Kingdom... 79
Portugal ... 89
References... 101
Appendix A – Data ... 106
Appendix B - Data sources and remarks... 114
Appendix C - The OECD questionnaire ... 119
Appendix D - Data Envelopment Analysis alternative models... 130
Appendix E - Stochastic Frontier Analysis alternative models... 140
Introduction
This is the final report of a study on the efficiency and effectiveness of public spending on tertiary education in the EU commissioned by the Directorate General Economic and Financial Affairs of the European Commission to an ISEG/Technical University of Lisbon team, under contract number ECFIN/329/2007/486218.
In this report we outline the conceptual framework, present data, and discuss the appropriate input, output, and environment indicators, and take into account the specific features of each country in order to compare properly the tertiary education systems in the EU Member States. Special care is given to the wide-ranging nature of tertiary education, where research and teaching activities cohabit from the individual to the institutional level.
Efficiency of public spending on tertiary education is evaluated using two different methods: a semi-parametric method and the stochastic frontier analysis (SFA). The first method includes data envelopment analysis (DEA) as a first stage and the regression of the obtained efficiency scores on explanatory factors as a second step. The latter is essentially a regression of total tertiary education cost on the considered outputs and factor costs, including the explicit modelling of country-specific efficiency scores. Results from the semi-parametric and SFA methods are essentially consistent. A core of more efficient European countries is identified (the UK and the Netherlands), while important inefficiencies are recognised in other countries. Countries with secondary education systems of good quality and where tertiary education is organised along certain lines (in terms of staff policy autonomy and flexibility, of independent and public evaluation of institutions, and of output oriented funding rules) tend to obtain better results in education and research from the resources used.
Effectiveness of tertiary education is the relation between this activity and final goals rather than closely related outputs. As a matter of fact, tertiary education is one of the driving forces of growth. In this report we show that there is a link between labour and total factor productivity and spending in education. However, this link is only effective when spending is efficient. In other words, what really matters is that money and resources are spent in such a way that one gets outputs that in a broader layer are related to productivity and growth. Moreover, we present evidence of a link between tertiary education efficiency and
employability. Unemployment rates among tertiary education graduates are lower than those among individuals that attained secondary level only, and this difference increases when public tertiary education is more efficient.
This report is organised as follows. The first section covers the important definitions of efficiency, effectiveness, and related concepts and sets some key measurement issues. We include a description of collected data and present some indicators constructed from them. The analysis provided is introductory and intends essentially to describe data and their usefulness for the subject at hand, and to give the reader a first impression of the main issues at stake. The second section describes the methods to be followed in order to assess efficiency on tertiary education provision across countries and its determinants and presents results from the application of semi-parametric and stochastic frontier methods. The third section is focused on the effectiveness of public spending on tertiary education. An annex contains three case studies, two concerning more efficient countries (the Netherlands, the UK) and one about a less efficient system (Portugal). Finally, the report ends with the conclusions that can be drawn from our study.
1. Concepts, data and preliminary analysis
1.1 Concepts
Definition of efficiency
Efficiency is essentially a comparison between inputs used in a certain activity and produced outputs. When, with a given amount of inputs or resources, a decision making unit (DMU) – be it a company, a government body, or a country – attains that level of output or outputs that is the maximum attainable under the existing technology, that DMU is said to be efficient, i.e., it operates on the production possibility frontier. When it produces less than what can possibly be attained, the DMU is considered to be inefficient.
FIGURE 1:THE PRODUCTION POSSIBILITY FRONTIER
Figure 1 illustrates these concepts in a simplified one input – one output framework. DMUs A, B, and C are located on the production possibility frontier, and are therefore efficient. On the other hand, DMU D is inefficient. With the level of input it uses it produces d1 units of
output. Production should increase by d2 units if the possibility frontier were to be attained. A
possible measure of DMU D’s inefficiency is the so-called output efficiency coefficient, (d1+d2)/d1, related to the vertical distance to the frontier. In a similar manner, it is possible to
measure an input efficiency coefficient, associated to the horizontal distance to the frontier. A dual approach to efficiency measurement is adequate when more that one output is to be considered and the researcher uses a parametric method like stochastic frontier analysis. This dual approach implies the estimation of a cost frontier, instead of a production frontier. The cost frontier will be a function of outputs and of input costs. Inefficiency will in this case be
evaluated as a measure of the excess cost each unit is incurring relative to minimum (efficient) cost.
Applying these concepts to tertiary education entails defining the DMUs, characterizing inputs and outputs, and also developing a method or methods to estimate the production or cost frontiers, all points to be covered in what follows.
The decision-making units
One of the main objectives of the study is to compare the EU Member States and a country-level analysis is envisaged. Accordingly, the DMU set includes the different public tertiary education systems, which roughly corresponds to all public instructional educational institutions of tertiary education across the EU (to be made precise below). Luxembourg was excluded as its only university was only established in 2003. Japan and the US are also taken in the analysis in order to gain more insight and to add statistical significance to the results. However, in practice, effective consideration of all these countries will depend on data availability. Countries to be considered in the study are listed in Table 1.
TABLE 1:COUNTRIES TO BE CONSIDERED IN THE STUDY
Country Name Country Code
Country Name Country
Code
Austria AT Italy IT
Belgium BE Japan JP
Bulgaria BG Lithuania LT
Cyprus CY Latvia LV
Czech Republic CZ Malta MT
Germany DE Netherlands NL Denmark DK Poland PL Estonia EE Portugal PT Greece EL Romania RO Spain ES Sweden SE Finland FI Slovenia SI
France FR Slovak Republic SK
Hungary HU United Kingdom UK
Ireland IE United States US
Finally, note that Table 1 contains both small and large countries. In order to have a meaningful comparison, variables will usually be taken in per capita terms, i.e., divided by population.
Public system vs. private system
This study is integrated in the study of efficiency and effectiveness of public spending. As such, the institutions under analysis in each country are either public or government-dependent private. These concepts, as defined in European Commission (2007), are:
• public institutions: institutions that are directly or indirectly administered by a public education authority;
• private government-dependent institutions: institutions that are directly or indirectly administered by a non-governmental organisation (church, trade union, a private business concern, or other body) and which, according to the definition in the UNESCO-UIS/OECD/Eurostat (UOE) questionnaire, receive over 50% of their core funding from the public authorities;
• private independent institutions: institutions that are directly or indirectly administered by a non-governmental organisation (church, trade union, a private business concern, or other body) and which, according to the definition in the UOE questionnaire, receive less than 50% of their core funding from the public authorities.
Table 2 summarises the structure of the tertiary education systems in each country under study. In ideal terms, one would like to include all public institutions, and weight each private government-dependent institution according to the percentage of funds it receives from public sources. Such detailed data is not available. As a matter of fact, it was not even possible to obtain a list of private government-dependent institutions per country. However, we could obtain lists of public and or private institutions per country. We have then considered in our sample:
• all institutions, when, in one given country, institutions are all either public or public and private government-dependent;
• public institutions only, when there are some private independent institutions. In these cases, private government-dependent institutions, if they exist, could not be considered, as it was not possible to disentangle them from the private independent institutions. This happened for France, Germany, and Spain;
• public and government-dependent institutions, when both are important, whereas independent private institutions are negligible. This is the case of Estonia, Latvia, Lithuania, and Slovenia.
In what follows, we will refer to the institutions we have considered in each country, be it public only or both public and government-dependent, by PGD.
TABLE 2:STRUCTURE OF TERTIARY EDUCATION SYSTEMS
Public Private
Government-Dependent
Private
Independent Institutions to Consider Observations
Austria X X All Belgium X X All Bulgaria X X Public institutions Cyprus X X Public institutions
Czech Republic X X Public
institutions
Some negligible private government-dependent institutions exist.
Denmark X All
Estonia X X X Public and gov. dependent inst.
Some negligible private institutions exist. Finland X X All France X X X Public institutions Germany X X X Public institutions Greece X All Hungary X X All Ireland X X Public institutions Italy X X Public institutions Japan X X Public institutions Latvia X X X Public and gov.
dependent inst. Lithuania X X X Public and gov. dependent inst.
Private universities are few and negligible.
Malta X All
Netherlands X X All
Poland X X X Public
institutions
Some negligible private government-dependent institutions exist.
Portugal X X Public
institutions
Romania X X Public
institutions
Slovakia X X All Some negligible private institutions exist.
Slovenia X X X Public and gov. dependent inst.
Some negligible private government-dependent institutions exist.
Spain X X X Public
institutions Some negligible private government-dependent institutions exist.
Sweden X X All
United Kingdom X X All
United States X X Public
institutions Source: OECD Online Education Database, complemented by inspection of government websites.
Outputs and their measurement
Tertiary educational systems are supposed to produce and disseminate knowledge, and this activity is pursued along two main dimensions: teaching and research. It is important
therefore to properly define outputs that are at the same time measurable, not too numerous relative to the number of DMUs to be studied, and clearly related to teaching and research. As in other studies concerning the efficiency of universities, measures of the number of graduates will be considered as outputs of teaching activities.2 Quality of teaching is to be measured by resorting to survey data. The THES (Times Higher Education Supplement) - QS (Quacquarelli Symonds) World University Rankings provide data on two important surveys.3 One concerns graduates' employability as perceived by recruiters and the other relates to quality perceptions among peers. These surveys provide scores on individual universities. In a process to be described later, we computed country scores from those original university scores and obtained a “recruiter view country indicator” and a “peer view country indicator.” These indicators will be used to scale the number of graduates in each country.
Research output is to be evaluated by means of measures derived from the number of publications and their impact. We aggregate to country level the number of published papers in academic journals by considering the location of the authors’ affiliation. Furthermore, quality of such publications is taken into account by means of the number of citations received. In fact, in a manner to be made precise below, we have computed a citation index, which we then use to weight the number of publications. The Web of Science database elaborated by The Thomson Corporation is our source on this matter.
Inputs and their measurement
As in many studies on efficiency in education (see section 1.2), the number of full-time equivalent academic staff is the input considered. This category includes all personnel whose primary or major assignment is instruction or research (covering, namely, those holding an academic rank with such titles as professor, associate professor, assistant professor, instructor, lecturer, or the equivalent of any of these academic ranks). Ideally, we would also like to consider non-academic staff, whose main function is to administer students, teachers, and researchers and who facilitates the teaching and research process in general, as well as the
2 See, for example, Flegg
et al. (2004).
3 The Institute of Higher Education from the Shanghai Jiao Tong University also produces a well known world ranking of universities. We did not use data from that ranking because it would imply a double counting in what concerns publications and citations. On the other hand, the qualitative survey data we took from the THES-QS ranking is not superimposing to the information we collected from other sources.
total time spent by students in order to have a degree, and some measure of the physical capital used (e.g., buildings and libraries). Nevertheless, such data is not available for most countries/years comprised in this study.
The total number of students is the other input we included. Students are an input in so far as they constitute the essential resource used to produce one of the main tertiary education outputs – the number of graduates. Implicitly in our approach, students who do not achieve graduation are an indicator of waste in education, as time, labour, capital, and expectations were spent without a measurable outcome.4
Cost (money) measures
In order to implement a multi-dimensional cost function model, we have to consider the total cost of the tertiary educational system. In one model,5 we have considered wages in the services sector as a proxy for wages in tertiary education across countries, so we could have data for the whole sample. Other alternatives proved less adequate:
- Dividing staff costs by the number of full-time equivalents in the Unesco/OECD/Eurostat database was considered, but missing values are too numerous.
- The International Labour Organization (ILO) collects information on wages paid in the month of October to tertiary education teachers of mathematics or languages and literature, but we could not use it for several reasons: the data do not capture variation in the number of months paid each year, nor in employers’ social security contributions and missing values are very numerous. Moreover, the ILO makes very few adjustments to the national replies to the questionnaires provided.
- Eurostat has data on average annual gross earnings in education. However, apart from neglecting social security contributions paid by employers (and, of course, comprising non-tertiary education), this variable presents missing values in all years for more than half of the countries in our sample. Eurostat also has annual information on monthly labour costs in education, with somewhat better country coverage (only 5 EU members without any annual entries), though often with very short time spans (e.g., countries with data for only 2 or 3
4 As mentioned in section 1.2, some studies on university efficiency follow our approach (for example, Flegg
et al., 2004). Others, however, consider the number of students as an output, rather than an input (for example,
Abbott and Doucouliagos, 2003). We think there is an essential distinction between enrolled students as such, who are simply working to achieve a goal, and graduates, students who have achieved that goal. Assuming enrolled students as an output would result in a bias towards efficiency for those systems where drop out rates are high and we wish to consider this as a waste symptom.
years). We have checked that the available observations are highly correlated with our chosen proxy (even when “old” and “new” Member States are considered separately), which suggests that the use of the latter does not distort significantly the analysis.
Exogenous and environment factors
These are factors that potentially determine efficiency scores. In Figure 1, exogenous and environment factors explain in part why the DMU D is below the production possibility frontier. One could for example expect that under a less adverse environment DMU D could have been found producing d1c instead of d1.
These variables are to be introduced in both efficiency measurement models to be used (two-stage DEA and SFA), as explained in the proper sections. Here, we make reference to the most likely factors and corresponding variables that may be found to be significant:
i) Universities’ organisation and funding schemes
The way universities are organised is probably the first factor that comes to mind in what concerns explaining inefficiencies. We consider institutional indicators taken from Oliveira Martins et al. (2007). These authors constructed a composite indicator from a questionnaire in such a way that low values are associated to input rigidity, supply restrictions, and absence of accountability and high values linked to input flexibility, no supply restrictions, and high accountability.6
ii) Quality of secondary education
As in most countries the majority of the tertiary students have obtained their secondary degrees in that very same country, it is possible that better quality in secondary education affects efficiency in tertiary education. Examples of measures of secondary education quality are PISA scores, which we include here, and drop out rates.
Definition of effectiveness and outcomes
While efficiency derives from a relationship between inputs and outputs, and refers essentially to the extent to which outputs are attained while minimising production costs, effectiveness refers, in our view, to the connection between inputs, outputs and more general,
second layer type objectives or outcomes. According to this preferred definition, while outputs from tertiary education are graduated students or published papers, outcomes to which these outputs in principle concur may be higher productivity, employability, innovation, or economic growth.
Outcomes to be considered
When considering effectiveness of tertiary education across countries, we will be asking the following questions:
i) Are increasing tertiary education spending levels affecting in a positive way labour productivity or total factor productivity?
ii) How does efficiency in tertiary education promote employability? Namely, does efficiency explain the gap between graduates’ unemployment rate and that of people with secondary education only?
iii) And how does efficiency in spending affect the relationship between tertiary education
spending and labour productivity?
1.2 A literature survey
Despite the long history in studying universities costs, it is only recently that it is taken into account the presence of inefficiency in university production. In fact, while previous work in general assumed that the university produces on the minimum-cost frontier, recent empirical analysis allows for inefficiencies using two main categories of methods, namely, DEA methods and SFA.
The scope of most of these studies, with only a few exceptions, is limited to the higher education institutions of a single country and the approaches are varied. Firstly, the output of universities can be generally categorized into teaching and research. Some works focus only on one of these dimensions, while others cover both. Second, concerning the choice of outputs and inputs, there is no definitive study to guide the selection of these factors in educational application. Various variables have been employed as measures of teaching output. The number of degrees conferred, the number of graduates, or full-time equivalent student enrolment are the most common, with, eventually, a distinction between the undergraduate and the graduate level and arts and sciences. There is no reason why students
should be considered a better measure than the number of graduates: degrees awarded neglect the education of those who attend but do not graduate, but measure completions and the level of accomplishment. McMillan and Datta (1998) use the full-time equivalent number of students. A study that uses the number of graduations as a measure of outcome is Abbott and Doucouliagos (2003), whereas Athanassopoulos and Shale (1997) employ the number of graduates; Johnes (2006) and Flegg et al. (2004) divide the number of degrees awarded in graduate and postgraduate degrees; Warning (2004) distinguishes between graduations in sciences and in social sciences. Adjustment for quality is rare, namely through peer evaluation, given the lack of consistent qualitative measures in higher education. Both Flegg et al. (2004) and Johnes (2006) aim at evaluating universities in the UK and use graduations weighted by degree classification.
The means for estimating the value of the research output is not less controversial. It has been assessed by means of the number of patents obtained, as well as publications and citations (see Athanassopoulos and Shale, 1997, and Warning, 2004). An alternative approach is to use government or external research finance attracted by a university as a proxy for both quantity and quality of the research output, even though some argue that this may well be considered an output, instead of an input. This is the case of Abbott and Doucouliagos (2003), Flegg et al., or McMillan and Datta (1998).
If there is no consensus on which output measures to use and, in many cases, output selection is driven by the availability of reliable data, inputs are more readily quantifiable. Since university inputs must be purchased, expenditure becomes an aggregate input measure (see Athanassopoulos and Shale, 1997). Faculty are typically incorporated in full-time equivalent numbers or as salary expenses. This may be extended to include all academic staff or even non-academic staff, again in numbers or costs. Abbott and Doucouliagos (2003), Johnes, 2006, and Flegg et al., 2004 consider staff in numbers and Warning (2004) in costs. Other separately designated inputs are the full-time equivalent number of students (see Flegg et al., 2004, and Johnes, 2006), expenditure on inputs other than labour inputs, and proxies for the university's capital stock. Johnes (2006) for instance, uses the value of interest payments and depreciation as a measure of the capital stock.
All the aforementioned studies apply DEA to study efficiency in the higher education sector; other examples include Tomkins and Green (1988), Beasley (1990, 1995), Johnes and Johnes
(1993), Sarrico et al. (1997), Sarrico and Dyson (2000). Among the few articles that apply SFA to higher education, we only mention two key studies, both concerning universities in the UK. Izadi et al. (2002) estimates a constant elasticity of scale (CES) cost frontier. The dependent variable is total expenditure and the independent variables are the number of undergraduate students in arts and in sciences, the number of graduate students, and the value of research grants received. Apart from these, Stevens (2005) also considers staff costs and, in order to account for the quality of the teaching output, the proportion of first-class degrees, while controlling for input quality by means of the average scores of students entering the university.
To the best of the authors’ knowledge, attempts to make efficiency analysis of the higher education sector at the international level are only a few. Joumady and Ris (2005) compare universities in 8 different countries (Italy, Spain, France, Austria, Germany, the Netherlands, United Kingdom, and Finland), using a large sample of recent higher education graduates responses to a survey conducted in 1998. Their aim is to evaluate the adequacy of the skills of recent graduates from different universities to the labour market requirements. Thus, they focus on teaching and define efficiency as the ability to, first, generate human capital competencies and, second, to match the competencies provided with the competencies required, and outputs are taken along these lines. Inputs are students' qualification and grade before enrolment in higher education, study conditions and teaching quality provision, and intensity of job search. By computing average efficiency scores, Joumady and Ris (2005) distinguishes between three groups of countries, namely the UK, Netherlands, and Austria, that have relatively good performance, France and Germany, that are located on an average level of inefficiency, and finally, Spain, Finland, and Italy, that exhibit the worst performances.
Agasisti and Johnes (2007) use DEA to compare technical efficiency of English and Italian universities in the period 2002-3 to 2004-5. This study includes as outputs the number of graduates and the total amount of external grants and contracts for research, thus covering both dimensions - teaching and research. As inputs, they consider the total number of students, the total amount of financial resources/incomes, the number of PhD students, and the number of academic staff. By looking at the evolution of technical efficiency scores over the four-year period, Agasisti and Johnes (2007) conclude that whereas Italian universities are improving their technical efficiency, English universities are obtaining stable scores.
Nevertheless, the typical English HE institution is measured as being much more efficient than its Italian counterpart. Finally, Agasisti (2008) is the only article that performs a cross-country comparison using countries as decision-making units. It conducts a DEA on the HE sector of some European countries for the period 2000-2003, focusing on the teaching dimension only. Agasisti uses as outputs the population that has attained tertiary education, employment rates of graduates, and the percentage of foreign students. Inputs are the students to teachers ratio, entry rates, and expenditure on educational institutions. Agasisti then concludes that the UK has the best performance, essentially due to the high graduation rates experienced and the good results in terms of foreign students’ attraction. France, Germany, and Ireland also display good performances. The Nordic countries are characterized by relatively low efficiency scores given the extremely high levels of spending, while Eastern countries have both relatively low levels of spending and low performances, except for the Slovak Republic, which results as an efficient country.
In what effectiveness is concerned, there is a vast literature studying the impact of education on economic growth, though many contributions do not disaggregate education by levels, so as to study the importance of tertiary education. Abundant research is also available on the link between education and labour market outcomes, though often drawing on micro data. Our survey of these strands of literature will be selective, and mainly guided by the approach taken in section 3 of this report.
Some studies address the importance of education for output or productivity growth within the more general framework of the growth effects of fiscal policy, especially of public expenditure and its composition. From this perspective, one tests the explanatory power of public spending on education in a growth regression, controlling for other variables, such as capital accumulation, initial income levels or other budget items. Examples include Blankenau et al. (2007) and Devarajan et al. (1996). The latter study contains a detailed disaggregation of central government expenditure, including, among many other categories, tertiary education spending (for which no significant beneficial growth effects were found).7
7 The sample period is 1970-1990 and the study draws on data from the IMF’s
Government Finance Statistics. In
past issues of this source total education outlays were broken down into schools, universities and other spending, but this disaggregation has been discontinued.
While the approach in the previous paragraph can be regarded as input-based, it is also possible to consider how education outputs contribute to economic growth. By far the most widely used output is average years of schooling, which is taken as a proxy for human capital and included in a production function alongside other production factors, such as labour and physical capital (see, e.g., De la Fuente and Domenech, 2006; Cohen and Soto, 2007). A few studies disaggregate total human capital by levels of education –e.g., Pereira and St. Aubyn (2008) or Vandenbussche et al. (2006), the latter study suggesting that the growth effects of tertiary education are stronger the closer economies are to the technological frontier. For the purposes of the present report, however, a disadvantage of this approach is that it neglects one of the main outputs of tertiary education, namely scientific research.
It holds that in most countries and years schooling minimizes the risk of unemployment, and hence the unemployment rate among those with tertiary education attainment is smaller than among groups with lower levels of attainment (see, e.g., Blondal et al., 2002). On the basis of micro data (individual-level data from household surveys), Boarini and Strauss (2007) estimates for several countries the employability premium from tertiary education (relative to upper secondary education) controlling for other individual characteristics, and find an average value of roughly two percentage points. Biagi and Lucifora (2008) studies the impact of education on unemployment using data from Labour Force Surveys for 10 European countries, and conclude that, controlling for a host of other factors (e.g., demographic variables or the business cycle), higher educational attainment (measured by the share of those with more than primary education) reduces unemployment rates, both for less educated and (especially) for more educated groups. In section 3 of this report we intend to go one step further and investigate the determinants of cross-country variation in the employability premium from tertiary education.
1.3 Data
Data on inputs, teaching outputs, and financial data were drawn from the OECD (Online Education Database) whenever possible to ensure data comparability across countries. Such data are available for the period 1998-2005 only, thus considerably restricting the scope of our study. Moreover, in order to derive consistent time series for the period considered, the
OECD data were combined with other sources, notably Eurostat.8 In what research outputs are concerned, the ISI Web of Science was the main source. Finally, indexes on the quality of teaching were drawn from THES (Times Higher Education Supplement), the institutional variables were taken from Oliveira Martins et al. (2007), and macroeconomic data from AMECO and Eurostat. Precise definitions of the variables used are given in what follows. Appendix A contains the data and details on sources and some remarks are available in Appendix B.
Input data
Academic staff:
Definition: Number of members of the academic staff (comprising all personnel whose primary or major assignment is instruction or research and so covers personnel who hold an academic rank with such titles as professor, associate professor, assistant professor, instructor, lecturer, or the equivalent of any of these academic ranks), working in both PGD institutions of tertiary education (including ISCED levels 5 and 6) in full-time units.
Students in PGD Institutions:
Definition: Number of students enrolled in PGD institutions of tertiary education (ISCED levels 5 and 6) in full-time units.
Expenditure/financial data
Total Expenditure on PGD Institutions in Percentage of GDP:
Definition: Annual expenditure on PGD institutions in percentage of GDP at tertiary level of education (ISCED levels 5 and 6).
8 We think it is important to point out that UOE databases on education are incomplete, with a good number of missing figures and unclassified items. Apart from measurement errors, this conditioned our empirical work when it came to model specification and periods considered in a manner that will be clarified in the following parts of this report.
Total Expenditure on PGD Institutions in Purchasing Power Standard in Real Terms Per Capita:
This data has been constructed using the dataset Expenditure by nature and resource category from the UOE data collection. We have obtained the total current and capital expenditure for PGD institutions for the selected years. Originally data is measured in millions of national currency and, for the sake of comparison, we have transformed the data into purchasing power standard euros in real terms using the following formula:
ti ti ti ti ti D PPS E Pop TotExp 1 1 1 × × × ,
where is the total current and capital expenditure in million of national currency for country i in year t; is the total population; Eti is the ECU-EUR average exchange rates
defined as units of national currency per EUR/ECU; PPSti is the ratio of GDP purchasing
power parities over ECU/EUR exchange rates and, finally, is the euro area price deflator of the gross domestic product at market prices of the year 2000. Data on , Eti, PPSti, and
has been obtained from AMECO Database.
ti TotExp ti Pop ti D ti Pop ti D
Total Public Expenditure on Tertiary Education
Definition: Annual expenditure on tertiary education by all government levels, consisting of direct expenditures for educational institutions (public and private) plus transfers and payments to private entities (i.e., public spending outside educational institutions).
Total Public Expenditure for Educational Institutions (Tertiary Education) Definition: A component of the preceding variable.
Output data
Graduates in PGD Institutions:
Definition: Number of students who graduate in PGD institutions of tertiary education
(ISCED levels 5, 6).
THES - QS recruiter survey ranking:
Definition: Classification of world universities according to results from a survey filled by recruiters from all over the world (2005, 2006, and 2007) and concerning the employability of graduates.
THES - QS peer survey ranking:
Definition: Classification of world universities according to results from a survey filled by academics from all over the world (2005, 2006, and 2007).
Published articles:
Definition: Number of published articles in a given year with at least one author affiliated to a given country's institution and included in the ISI Web of Science database. The data collection methodology was the following. Firstly, we obtained a list of the PGD institutions for each country. Then, for each year and each country, we searched all publications for which at least one author was affiliated to an institution of that particular country. From these, we selected the publications from the universities belonging to the relevant list, i.e., the list of the PGD institutions. The ISI platform does not allow for searches in which the number of publications in one year exceeds 100 000. In cases where that situation arose, namely the US, we have split the search into the different states and then removed the papers that included authors in more than one state, to avoid double counting of these publications.
Citations:
Definition: Number of citations of articles published and cited within a five-year period with at least one author affiliated to a given country's institution and included in the ISI Web of Science database. The data collection was done as follows: after having obtained the list of relevant institutions in each country, we looked for the number of citations of papers published in a certain year in the five subsequent years, whenever possible. Whenever the number of publications of a country exceeded 10 000, in which case the ISI platform does not return any valid number, we partitioned that country’s set of institutions so as to obtain groups of institutions that publish at most 10 000 articles per year. We then obtained all citations for
the publications of each group of institutions, excluding those already considered in a different group to avoid double-counting, and summed them up to obtain the number of citations of the country’s publications.
Institutional and environment data
Supply of tertiary education (STE)
Definition: STE is a composite indicator of the institutional set-up of tertiary education, aggregating scores for input flexibility, output flexibility, and accountability.
Input flexibility (IF):
i) Selection of students: autonomy to choose the number of students and their profile.
ii) Budget autonomy: autonomy to decide on the level of tuition fees and to raise other funds, as well as to decide on the structure of expenditure.
iii) Staff policy: autonomy to hire, set the wages, and to dismiss the academic staff.
Output flexibility (OF):
Autonomy to set course content, to offer more diversified studies, and to decide on the (in)existence of constraints associated with numerus clausus.
Accountability (Ac):
i) Evaluation: presence of an independent evaluator, involvement of stakeholders in the evaluation process, and availability of public evaluation reports.
ii) Funding rules: input or output-oriented funding.
PISA
Definition: PISA is an internationally standardised assessment that was jointly developed by participating countries and administered to 15-year-olds in schools. The survey was implemented in 43 countries in the first assessment in 2000, in 41 countries in the second assessment in 2003, and in 57 countries in the third assessment in 2006. Tests are typically administered to between 4 500 and 10 000 students in each country. We have considered the
average of the PISA assessments on reading, mathematics, and science in year 2000 as a measure of the student preparation for university studies.
1.3 Preliminary analysis
FIGURE 2
Expenditure on PGD Institutions of Higher Education as Percentage of GDP 2005 0,00 0,20 0,40 0,60 0,80 1,00 1,20 1,40 1,60 1,80 2,00 Finland Denmark Sweden
United Poland Greece
Slovenia
United Austria
Netherlands
Belgium Lithuania Portugal France Ireland Hungary Germany Estonia
Spain
Bulgaria Czech
Italy
Slovakia
Malta Japan
Figure 2 expresses the total public expenditure on tertiary education institutions in percentage of GDP in 2005. It varies from 1.73% (Finland) to 0.49% (Japan). The average is 1.2%.9
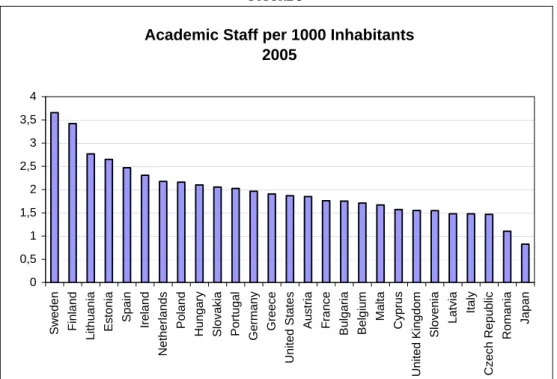
Figure 3 illustrates the number of academic staff in PGD institutions relative to the total country population. This number varies between 3.7 (Sweden) and 0.8 (Japan). Romania has the lowest figure available for a EU country, 1.1. Notice that Sweden and Finland have a very high number of academics per 1000 inhabitants whereas the UK is below average. Also striking are the cases of Bulgaria, Estonia, and Spain with values well above the average (2.0).
9 Note that, in total, the US expenditure on education is much higher than European countries’ expenditure, but this is mainly due to private funding.
FIGURE 3
Academic Staff per 1000 Inhabitants 2005 0 0,5 1 1,5 2 2,5 3 3,5 4
Sweden Finland Lithuania Estonia Spain Ireland
Netherlands
Poland
Hungary Slovakia Portugal Germany Greece
United States Austria France Bulgaria Belgium Malta Cyprus United Kingdom Slovenia Latvia Italy Czech Republic Romania Japan
Figure 4 depicts the share of students in the tertiary education enrolled in PGD institutions. Note that the countries in which 100% of the students are enrolled in these tertiary education institutions are countries in which there are no private independent universities, or in which these institutions are very small (Austria). Observe that in the analysed countries the weight of the public sector in tertiary education is very high, except for Japan, in which only 21% of the students are enrolled in public tertiary education institutions.
FIGURE 4
Share of Students in PGD Institutions
0,000 0,200 0,400 0,600 0,800 1,000 1,200 Austria Belgium
Denmark Finland Greece Hungary
Malta
Netherlands
Slovakia Sweden United
Italy
Lithuania
Ireland
Germany
Czech Spain France
Bulgaria Estonia Romania United Portugal Latvia Poland
Slovenia
The number of students in ISCED levels 5 and 6 per member of the academic staff is illustrated in Figure 5. Slovenia has a very high ratio of students per member of the academic staff (35), whereas Japan and Cyprus have a much lower ratio (7.8 and 5.4, respectively).
FIGURE 5
Students per Academic Staff 2005 0,0 5,0 10,0 15,0 20,0 25,0 30,0 35,0 40,0 S lov eni a Gr e e ce La tv ia U n ite d K ing dom Ro m a n ia U ni ted S tates It a ly B e lg iu m H un gar y C z ec h R epubl ic Li thuani a P o land Ir e land F in land Fra n c e S lov ak ia Au s tr ia N ether la nds E s toni a B ul gar ia Sp a in Ma lta P or tugal S w eden Ge rm a n y J a pan C y pr us
In terms of graduations (Figure 6 and Figure 7) we observe that Ireland, Lithuania, and the UK have a good performance both in the number of graduates per 1000 inhabitants and per member of academic staff. We observe a high variance across countries (see Figure 7). The worst performances in Europe are from Austria, Germany, and Cyprus, with a very low number of graduates.
FIGURE 6
Graduates per 1000 Inhabitants 2005 0,00 2,00 4,00 6,00 8,00 10,00 12,00 14,00 16,00 Ireland Lithuania United Kingdom Poland Denmark France Latvia
Finland Belgium Hungary Estonia Slovakia Malta
Netherlands
Sweden
United States
Italy
Spain
Romania Slovenia Greece Portugal
Czech Republic
Bulgaria Austria Germany Japan Cyprus
FIGURE 7
Graduates per Academic Staff 2005 0 1 2 3 4 5 6 7 8 UK Ir el an d L ith uan ia Lat v ia R om ani a Sl ov e n ia Po la nd F ranc e Bel g iu m Ma lta It a ly Cz e c h Re p H un gar y US Sl o v ak ia Cy p ru s N et he rl and s G reec e Au s tr ia Es to n ia Po rt u gal Sp ai n F inl an d Bu lgar ia G e rm any S w ede n J apa n
Note that the indicator “graduates per academic staff” can be used to analyze the efficiency of the teaching system as graduates are one of the outputs of tertiary education and academic staff is one of the inputs. In Figure 7 we observe that, on average, the number of graduates per academic staff is between 3 and 4, but some countries can achieve twice this value. It will be interesting to compare the number of publications per academic staff and the number of
graduates per academic staff given that these are the two outputs of the tertiary education system.
Another important indicator is the graduation rate, defined as the percentage of graduates over the number of students in each period. It can be interpreted as a turnover rate of tertiary education. This variable can be observed in Figure 8.
FIGURE 8
Graduates per Student 2005 0.00 0.10 0.20 0.30 0.40 0.50 0.60 J apan Ir el and F ranc e Ma lta Uni ted K ingdom Denm ark P ol and Li thuani a Rom ani a Be lg iu m S lov ak ia Lat v ia P ort ugal Net herl ands B ul gari a Ita ly Cy prus E s toni a Hungary Cz ec h Republ ic S pai n Germ any Uni ted S tat es Au str ia S w eden F inl and S lov eni a Greec e
The number of published articles is one possible measure of scientific production. This measure is plotted in Figure 9. Again, this number is divided by the population to scale the indicator.
FIGURE 9 Publications 1000 Inhabitants 2005 0 0,2 0,4 0,6 0,8 1 1,2 1,4 1,6 S w eden F inl and D enm ar k N ether lands B e lg iu m U ni ted K ingdom Au s tr ia Ir el and S lov eni a G er m any G reec e U ni ted S tates E s toni a It a ly S pai n P or tugal J apan F ranc e H ungar y C z ec h R epubl ic C y pr us P ol and S lov ak ia Li thuani a Mal ta Lat v ia B ul gar ia R omani a
Scientific production as measured by the indicator in Figure 9 is particularly high in the Nordic countries (Sweden, Finland, and Denmark) and the Netherlands. Note that all these countries are above the US, the greater producer in absolute terms.
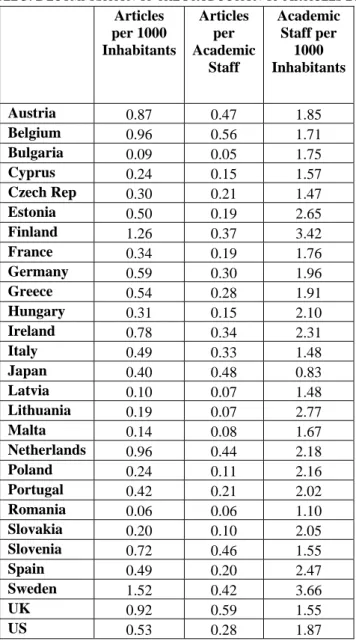
It is possible to decompose the number of articles per capita in two other interesting indicators, the number of articles per member of the academic staff, and academic staff per capita: population staff academic staff academic articles of number population articles of number × = . (1)
Articles’ production per capita depends both on the academic staff productivity and on the relative importance of the academic staff respective to total population. As it will be shown in the following lines, this decomposition allows a deeper analysis of differences across countries.
TABLE 3:DECOMPOSITION OF THE PRODUCTION OF ARTICLES 2005 Articles per 1000 Inhabitants Articles per Academic Staff Academic Staff per 1000 Inhabitants Austria 0.87 0.47 1.85 Belgium 0.96 0.56 1.71 Bulgaria 0.09 0.05 1.75 Cyprus 0.24 0.15 1.57 Czech Rep 0.30 0.21 1.47 Estonia 0.50 0.19 2.65 Finland 1.26 0.37 3.42 France 0.34 0.19 1.76 Germany 0.59 0.30 1.96 Greece 0.54 0.28 1.91 Hungary 0.31 0.15 2.10 Ireland 0.78 0.34 2.31 Italy 0.49 0.33 1.48 Japan 0.40 0.48 0.83 Latvia 0.10 0.07 1.48 Lithuania 0.19 0.07 2.77 Malta 0.14 0.08 1.67 Netherlands 0.96 0.44 2.18 Poland 0.24 0.11 2.16 Portugal 0.42 0.21 2.02 Romania 0.06 0.06 1.10 Slovakia 0.20 0.10 2.05 Slovenia 0.72 0.46 1.55 Spain 0.49 0.20 2.47 Sweden 1.52 0.42 3.66 UK 0.92 0.59 1.55 US 0.53 0.28 1.87
Table 3 displays the aforementioned decomposition across countries in 2005. Some countries are not included due to missing data. The following observations apply:
• the countries with the highest production per capita (Finland and Sweden) are also countries with a large academic staff. Productivity of this academic staff is above average;
• some countries achieve above average production per capita (the Netherlands and the UK) essentially due to a high academic staff productivity, while displaying a smaller than average academic staff;
• a third group of countries, while employing an above average academic staff, produces below average. This group includes Spain, Portugal, Hungary, Slovakia, Estonia, Poland, and Bulgaria;
• finally, some countries not only exhibit lower productivity, but also have a relatively small academic staff. This is the case of Romania, Latvia, Malta Cyprus, and Czech Republic.
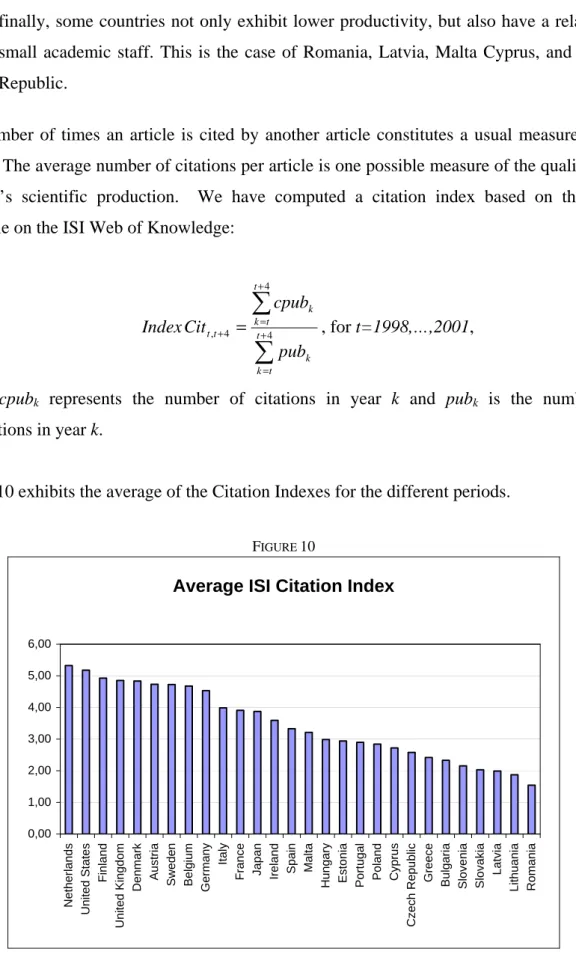
The number of times an article is cited by another article constitutes a usual measure of its impact. The average number of citations per article is one possible measure of the quality of a country’s scientific production. We have computed a citation index based on the data available on the ISI Web of Knowledge:
∑
∑
+ = + = + = 4 4 4 , t t k k t t k k t t pub cpub Cit Index , for t=1998,…,2001, (2)where cpubk represents the number of citations in year k and pubk is the number of
publications in year k.
Figure 10 exhibits the average of the Citation Indexes for the different periods.
FIGURE 10
Average ISI Citation Index
0,00 1,00 2,00 3,00 4,00 5,00 6,00 Netherlands United States Finland United Kingdom Denmark
Austria Sweden Belgium
Germany
Italy
France Japan Ireland Spain Malta
Hungary Estonia Portugal Poland Cyprus
Czech Republic
Greece Bulgaria Slovenia Slovakia
Latvia
Lithuania Romania
It is worth to highlight countries such as the Netherlands, the US, Finland, and Sweden, which not only produce a high number of publications, but also have a high impact in terms of citations. Eastern European countries exhibit a weaker performance.
Two other quality indicators, the peer review and the recruiter view country indicators, were constructed from the THES - QS World University Rankings database.
The peer review country indicator intends to reflect each country’s presence in the universities’ ranking derived from the THES - QS peer survey. In order to compute a score for each country, we have considered only PGD universities and given points according to the following rule:
• 2 points for each university between the 1st and the 100th position; • 1.5 points for each university between the 101st and the 200th position; • 1 point for each university between the 201st and the 300th position; • 0.5 points for each university between the 301st and the 400th position.
We have then summed all the points corresponding to each country’s institutions and obtained a score per country.
The peer review country indicator results from the adjustment of this score for country size, taking into account the weight of PGD institutions in tertiary education. To be precise, the country score was divided by population multiplied by the proportion of students in PGD institutions: . 108 × × = education tertiary in students of number total ns institutio PGD in students population score country indicator country review peer
Then, this indicator has been standardised using the following procedure:
. peer review country indicator 1
std peer reviewindicator
Highest peer review country indicator
= + . (3)
The recruiter review country indicator aims to reflect graduate employability. It is derived from the THES - QS recruiter survey. Its computation follows the same method as the peer review country indicator.
In Figure 11 we plot the standardised recruiter review country indicator. Recruiters regard the Universities in Ireland and in the UK as providing highly employable graduates. On the other hand, Spanish, Polish, and Portuguese universities perform poorly on this strand. Other countries, for which the standardised recruiter review country indicator equals 1, do not have any university in the top 400.
The standardised peer review country indicator is depicted in Figure 12. Considering their size, Finland, Ireland, and Sweden are the countries with more universities pointed out by peers as being excellent. Spain, Poland, and Greece also perform poorly on this indicator, but note should be taken that some countries were not included in the graphs because their score was null.
FIGURE 11
Standardised Recruiter Review Country Indicator 0.00 0.50 1.00 1.50 2.00 2.50 Ireland United Kingdom Netherlands Japan
Sweden Belgium Finland Denmark Austria Germany France
United States Greece Ital y Portugal Poland Spain Czech Republic
Bulgaria Cyprus Estonia Hungary
Latvia
Lithuania
Mal
ta
FIGURE 12
Standardised Peer Review Country Indicator
0,00 0,50 1,00 1,50 2,00 2,50
Finland Ireland Sweden
Netherlands Belgium Denmark United Kingdom Austria Japan Germany France United States Portugal Italy Spain Czech Republic
Poland Greece Bulgaria Cyprus Estonia Hungary Latvia
Lithuania
Malta
Romania Slovakia Slovenia
FIGURE 13
PISA 2000 - average of reading, science and
mathematics scores
400 420 440 460 480 500 520 540 560 J apan F inl and UK N ethe rl ands Au s tr ia Ir el and S w eden Be lg iu m F ranc e Cz e c h US D enm ar k H ungar y G er m any S pai n S lov ak ia It a ly G reec e P or tugal R o m ani aThe average of the PISA indicator is 496.6. The highest scores are attained by Japan, Finland, the UK, and the Netherlands. The US have a slightly above average score and the lowest scores belong to Greece, Portugal, and Romania.
FIGURE 14
Score for Funding Rules Indicator
0 1 2 3 4 5 6 7 8 9 P o rt ugal Fr a n c e F inl an d Ir el and B e lg iu m Au s tr ia UK Denm ar k Ge rm a n y Ita ly Ne th e rl a nd s S pai n Gr e e c e S w ed en Hu ngar y Cz ec h J apan US R om ani a Sl o v a k ia
Portugal performs extremely well in the Funding Rules indicator. The average of this indicator is 5. The worse performing countries are Romania and Slovakia.
FIGURE 15
Score for Staff Policy Indicator
0 2 4 6 8 10 12 Au s tr ia Cz e c h D e nm ark Ja p a n Ne th e rl a n d s S lov ak ia S w ed en UK US Ro m a n ia Ir e la n d It a ly F inl an d Ge rm a n y P o rt ug al B e lg iu m Sp a in Gr e e c e H u n gary Fr a n c e
Several countries attain the maximal value for the staff policy indicator, namely Austria, Czech Republic, Denmark, Japan, the Netherlands, Slovakia, Sweden, the UK, and the US. The lowest score is for France followed by Hungary, Greece, and Spain.
FIGURE 16
Score for Evaluation Indicator
0 1 2 3 4 5 6 7 8 9 H unga ry UK N eth er lands G er m any Italy Ir el and Cz e c h US S lov ak ia S pai n S w eden Japan F ranc e Be lg iu m R om ani a Au s tr ia D enm a rk P or tuga l F inl and G reec e
Figure 16 exhibits the scores for the evaluation indicator. Hungary, the UK, and the Netherlands present the highest scores and Portugal, Finland, and Greece present the lowest ones.
Constructed variables
In the estimation of the following sections we will use two composed variables: wgrad or weighted graduates, which reflects the number and quality of graduates, and wpub, a measure of the number of publications weighted by the number of citations. To be precise we have computed these two variables in the following way:
. . . . 1000
2
t t
std peer rev ind std recruiter rev ind
wgrad =graduates per pop × + (4)
and wpubt =IndexCit t( )×pubt, where IndexCit t( ) is the average of citation indices that
2. Efficiency Assessment
We applied two different methods in order to measure efficiency in the provision of tertiary education and to identify the relevant non-discretionary (exogenous and environment) variables. Firstly we used a two-stage semi-parametric method, Data Envelopment Analysis (DEA) followed by a regression of output scores on non-discretionary variables; and secondly, a Stochastic Frontier Analysis (SFA) method, including the estimation of a multi-dimensional cost-minimising model with explanatory variables for the inefficiency effect. We turn now into an explanation of these two methods and the ensuing results.
2.1 The semi-parametric analysis method
The two-stage procedure can be briefly described in the following manner.
In the first stage, the researcher identifies relevant inputs (X) and outputs (Y). Then, the following mathematical programming problem is computed, for a given i-th DMU:
0
1
'
1
to
s.
,≥
=
≥
≤
λ
λ
λ
λ
δ
δ
δ λn
X
x
Y
y
Max
i i i i i . (5)In problem (5), δi is a scalar satisfying δi ≥1. It measures technical efficiency of the i-th unit
as the distance to the efficiency frontier, the latter being defined as a linear combination of best practice observations. With δi >1, the decision unit is inside the frontier (i.e., it is inefficient), while δi =1 implies that the decision unit is on the frontier (i.e., it is efficient). In what comes next, we will define as the country i DEA output efficient score, which is necessarily greater then zero and no higher than 1. An interesting intuition is that
1 − i δ = i μ i μ is the
fraction country i is producing of its potential efficiency level. It follows that μi =1 when country i is efficient.
This first stage is known as Data Envelopment Analysis, originating from Farrell (1957) seminal work and popularised by Charnes, Cooper, and Rhodes (1978). A full presentation of the method may be found in Coelli et al. (2005). Afonso and St. Aubyn (2005) have applied DEA to education and health efficiency across OECD countries.
In the second stage, the following regression is estimated:
i
z
i iμ
=
β ε
+
, (6)where μi is the efficiency score that resulted from stage one, i.e., from solving (4). zi contains
non-discretionary variables, i.e., exogenous and environment factors.
Typical two-stage applications include the estimation of (6) using censored regression techniques (Tobit).10 Recently, Simar and Wilson (2007) have criticised the two-stage method, as results are likely to be biased in small samples and propose an alternative estimation and inference procedures based on bootstrap methods. Afonso and St. Aubyn (2006) have applied both the Tobit and the Simar and Wilson bootstrap procedures in the second stage to estimate efficiency in secondary education across countries and contain a relatively detailed explanation of methods. Results from the two methods were very similar. In our study, we have used the Tobit estimation procedure only.
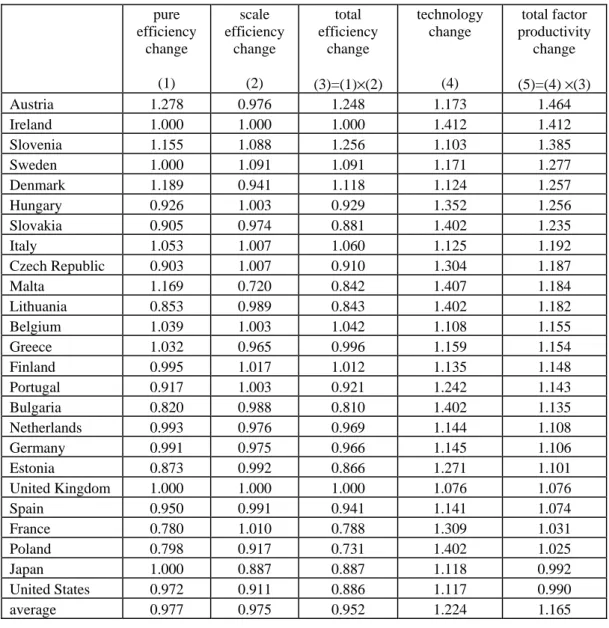
When panel data is available, it becomes possible to apply DEA to more than one period. The researcher will then obtain as many efficiency scores as periods for each country. The mere comparison of those scores is informative as it shows whether a country became closer to or farther away from the efficiency frontier. However, one has to be aware that the frontier itself is usually not static. If that is the case, it becomes important to know if that frontier changed over time, and by how much. In fact, and after applying DEA in two different periods, the Malmquist index allows the decomposition of “total factor productivity change” (M) into “efficiency change” (E) and “technical change” (T):
i i
i E T
M = × . (7)
In equation (7), Ei is given by the ratio of efficiency scores for country i, and Ti measures the
change in the production possibility frontier in country i’s vicinity.11 2.2 Main results from the semi-parametric analysis
The first stage (data envelopment analysis)
TABLE 4:VARIABLES IN THE TWO-STAGE PROCEDURE
Inputs Outputs
(in per capita terms)
Non-discretionary variables Model DEA1:
Academic Staff Students
(in per capita terms) Model DEA2:
Spending in PGD institutions (in percentage of GDP)
Weighted graduates Weighted published articles
Selection of students Budget autonomy Staff policy Output flexibility Evaluation Funding rules PISA results
Table 4 summarises the variables used with this method.12 We have considered two models, which are referred as model DEA1 and model DEA2. The output part of these models being exactly the same, they differ in what concerns the way inputs are measured.
In model DEA1 we have considered academic staff and students as our inputs. Inputs are therefore measured in physical units, which seems a natural way to measure and compare resources used across units (countries) that differ markedly in what concerns the cost of these resources (prices and wages). Note that it was not possible to collect data for other inputs. One envisaged possibility was to have a third input that would contain other resources used in the tertiary sector, in the manner of Flegg et al. (2004) when analysing British universities.13
11 A more complete explanation of the Malmquist index can be found in Coelli
et al. (2005).
12 See Appendix A for data on inputs, some non-discretionary variables, and data used to construct the outputs. 13 These authors included staff, students, and total expenditure other than that on academic and academic-related staff as inputs. See section 1.2 for more examples.
However, this variable was scarcely available and the use of it would drastically reduce the number of countries in our sample.
In model DEA2 we have considered a financial measure of outputs used. Considering nominal spending in PGD institutions has one advantage over using physically measured inputs, as virtually all costs are included. However, it carries also some drawbacks, as differences in costs across countries are controlled in an imperfect way. The widely used PPS correction (i.e., using the same acquisitive power euros across countries) is not enough when it comes to DEA. As wages are a very important part of tertiary education costs, countries where earnings are considerably lower would become artificially more efficient.14 Measuring financial costs as percentage of GDP seems to be more suitable. It can be assumed as an approximation that any two countries that spend the same proportion of GDP on their tertiary education institutions use a comparable level of resources in this activity.15
In both models outputs are considered in per capita terms, in order to make it possible to compare countries that are very different in size (both Malta and the US are in the sample). Our two outputs, weighted graduates and weighted publications, reflect the double nature of tertiary institutions, which is education and research. As explained in section 1, graduates are weighted by quality inferred from the peer review and the recruiter review. Publications are weighted by citations, which is a measure of their impact and usefulness in subsequent research.16
It was not possible to compute weighted graduates, academic staff, and students per capita for all years and countries, due to missing data. However, and by dividing the whole time span in two sub-periods (1998-2001 and 2002-2005), it was possible to have values for those variables for all countries by averaging existing data.
14 A DEA model where PPS measured costs were considered as the input is presented in Appendix D.
15 This approximation is more appropriate for activities where most inputs are nontradable across borders, as is the case of education.
16 The consideration of these two types of output and weighting for quality is common in the literature on the efficiency of tertiary education institutions. As noted in section 1.2, examples of studies that consider both types of output are McMillan and Datta (1998), Flegg et al. (2004), and Stevens (2005), as well as references therein.