F. Peña & M. Chávez (eds.) Mexico City, Mexico, 14–17 October 2014
A STATIC PENETRATION TEST FOR MASONRY MORTAR
Domenico Liberatore 1, Nicola Masini 2, Luigi Sorrentino 3, Vito Racina 4, Luca Frezza 5,
and Maria Sileo 6
1
Dept. of Structural and Geotechnical Engineering, “Sapienza” University of Rome Via Antonio Gramsci 53, 00197 Rome, Italy
e-mail: domenico.liberatore@uniroma1.it
2
CNR-IBAM (Italian Research Council, Institute for Archaeological and Monumental Heritage) C.da S. Loja, 85050 Tito Scalo (PZ), Italy
e-mail: n.masini@ibam.cnr.it
3
Dept. of Structural and Geotechnical Engineering, “Sapienza” University of Rome Via Antonio Gramsci 53, 00197 Rome, Italy
e-mail: luigi.sorrentino@uniroma1.it
4
MonitorING s.r.l.
Via della Meccanica 13, 85100 Potenza, Italy e-mail: vitosch@tiscali.it
5
Dept. of Structural and Geotechnical Engineering, “Sapienza” University of Rome Via Antonio Gramsci 53, 00197 Rome, Italy
e-mail: lucafrezza86@virgilio.it
6
CNR-IBAM (Italian Research Council, Institute for Archaeological and Monumental Heritage) C.da S. Loja, 85050 Tito Scalo (PZ), Italy
e-mail: m.sileo@ibam.cnr.it
Keywords: Diagnostic investigations, Mortar, Penetration test.
Abstract. A penetration test for masonry mortar, based on the principle of “static” penetra-tion, is presented in this paper. The pin is driven at constant velocity by a stepper motor con-trolled by a computer. The result of the test is the penetration load, acquired by a load cell, as function of the penetration depth, acquired by an encoder. The penetrometer has been tested on masonry walls with decayed mortar, and the results are correlated with those of a previous percussion penetration test.
1 INTRODUCTION
The response of masonry constructions is noticeably affected by mortar quality, as shown, for instance, by recent seismic events [1, 2]. In this respect, penetration test, thanks to its moderate destructiveness, can provide useful information in the assessment of existing struc-tures.
Penetration tests were originally introduced in geotechnics around 1930. The procedure consists to insert a metal drill into the soil and to measure the corresponding resistance to penetration. The penetrometers can be either static (pressure drills) or dynamic (percussion drills). The static penetration test, known as Cone Penetration Test (CPT), consists of insert-ing a conic drill into the soil at controlled speed, usually 20 mm/s [3]. The dynamic penetra-tion test, or Standard Penetrapenetra-tion Test (SPT), uses a sampler tube, with external diameter 50 mm, internal diameter 35 mm and length approximately 650 mm [4, 5].
In structural engineering, one of the most common tests for the in situ determination of the compressive strength of concrete is the Windsor probe. A metal probe is driven at high speed into the concrete by a calibrated explosive charge. The penetration depth is generally below 10 mm. The measure is the mean value of penetration over 3 blows. Given the resistance to penetration and the Mohs’ hardness of the aggregate, the test estimates the compressive strength of concrete through empiric relations [6, 7].
A penetration test specifically devised for masonry mortars is the PNT-G, which measures the energy spent to make a hole with a normalized drill [8, 9]. Experimental investigations show that the penetration energy is correlated with the compressive strength, for sand mortars with strength less than or equal to 4 MPa. For this test, the penetration depth is about 5 mm. Another test aimed at estimating the compressive strength of mortar is based on the measure-ment of the penetration depth incremeasure-ment of a steel probe for each hammer blow [10].
A similar penetration test, i.e. based on the penetration of a metal pin driven by multiple blows, is aimed at estimating the friction coefficient of mortar of historical masonry, which is often decayed and without cohesion [11, 12]. The penetration depth is as high as 40-50 mm. The test provides the average number of blows required to drive the pin 1 mm. This test over-comes the drawbacks of many foregoing penetrometers, i.e. the high energy of the Windsor penetrometer, which is unsuited to decayed mortars, and the shallow penetration depth of the PNT-G, which only enables to obtain information about a limited depth. Through empirical relations, the test provides the friction coefficient of the mortar, given the joint thickness and the compressive stress along the vertical direction. An experimental database over more 100 buildings has been collected in recent years by means of this test.
A new version of this penetration test is here presented, based on the principle of “static” penetration. The pin is driven at constant velocity into the mortar, and the test provides the penetration load as function of the penetration depth. The penetrometer has been tested on de-cayed mortars, providing preliminary information on their quality. Finally, the new penetra-tion test is compared with the previous percussion test.
2 DESCRIPTION OF THE PENETROMETER
The penetrometer is based on driving a metal pin into the mortar at controlled speed, and on continuously acquiring the applied load. The result of the test is the diagram of the load as function of the penetration depth. The pin can reach 70 mm depth, so as to overcome the sur-face layer, which is mostly decayed because of exposition to atmospheric agents.
The apparatus consists of: 1) penetrometer;
3) lock plate.
The penetrometer (Fig. 1) consists of: pin, drum, cylinder, worm screw, gearmotor, stepper motor, load cell, encoder, connecting cable.
The pin is made of steel, has a diameter equal to 3 mm and a conic tip with angle equal to 27.5°. The pin is lodged into the drum, which slides inside the cylinder. The drum is driven, through the worm, by the gearmotor, which in turn is operated by the stepper motor. The cyl-inder head guarantees the correct alignment of the pin and enables to clamp the penetrometer to the plate, which in turn is anchored to the wall to be tested. The load is measured by a but-ton load cell located between the end of the worm and the drum. The displacement of the pin is measured by the encoder. During the test, the penetrometer is linked to the control unit by a connecting cable.
The control unit (Fig. 2) consists of: computer, batteries, multifunction plug. The control unit, featuring a touch screen, allows specifying the settings of the test (speed, acquisition step, initial and final displacements, maximum load), acquires the data during the test (displace-ment and applied load), pulls back the pin to the home position at the end of the test, records the data on a flash USB unit, enables to manually operate the pin, either at high or low speed, both configurable. During the test, the control unit displays in real-time the displacement of the pin and the applied load.
The batteries allow executing the test without resorting to an alternating current supply. The batteries are charged through a proper cable connected to the multifunction plug.
The plate (Fig. 3) is made of steel and is anchored to the masonry through expansion screws. The penetrometer is bolted to the plate. The penetrometer can be mounted on the plate in five different positions, in order to perform as many penetrations on an individual joint. At the end of the test, the penetrometer is removed from the plate, which in turn is removed from the masonry, together with the expansion screws which can be reused.
Figure 1: Penetrometer. Figure 2: Control unit. Figure 3: Plate.
3 EXPERIMENTAL INVESTIGATION
Two buildings have been investigated: a residential building and a church. The preparation of the test on an individual joint (visual inspection of the panel, determination of the joint, an-choring of the plate) required about 30-45 minutes, and each penetration (clamping of the penetrometer to the plate, penetration, unclamping) about 5 minutes, for a total amount of about 55-70 minutes.
The in situ penetration test is affected by several factors of scatter at different scales. A first group of factors consists of:
- different materials and constructive techniques, depending on the construction of different storeys and/or different portions of the building;
- different degree of masonry decay, depending, e.g., on the exposure to atmospheric agents and past maintenance;
Besides these factors, which can be classified as “global”, there are “local” factors within each wall, depending on the behaviour at the “microscale”, such as the mechanism of stress transfer between the units through the mortar joints, and the degree of confinement of the mortar. Finally, scatter is present between the different penetrations on an individual joint.
The experimental investigation has been performed on a residential building at Avigliano (province of Potenza, Southern Italy) and on the church Madonna del Carmine at Pomarico (province of Matera, Southern Italy). The tested walls have not undergone past strengthening interventions.
For each wall, five penetrations have been performed on a sub-horizontal mortar joint. The test has been done after the removal of the plaster. The penetration speed has been set to 0.20 mm/s, the load has been limited to 1500 N and has been acquired at displacement steps of 0.10 mm; maximum displacement has been varied during the campaign as specified in the fol-lowing.
3.1 Residential building, Avigliano
The building, located in the Municipality of Avigliano, is a private house, with three sto-reys, uninhabited and to be renovated (Fig. 4). The masonry has irregular fabric, with un-dressed limestone units and lime mortar. The mortar is decayed and has poor cohesion.
Figure 4: Residential building, Avigliano.
The penetration test has been carried out on two masonry panels, denoted as panel A and panel B.
The quantities involved in the test are:
u = displacement of the pin; F = applied load;
Fm = mean applied load;
u1 = displacement corresponding to the contact between pin and mortar;
u2 = displacement at the end of the test.
The displacement of the pin inside the mortar joint is ∆u = u2− u1.
The work spent for the displacement of the pin from the displacement u1 to the displace-ment u2 is: u F du u F W u m u = ∆ =
∫
2 ( ) 1 (1)For the test on panel A (Figs. 5-6) the end displacement has been limited to 60 mm. The load has been acquired at displacement step 0.10 mm. In Fig. 7 are reported the diagrams of F as function of u, and in Table 1 the values of u1, u2, ∆u, W, Fm.
Figure 5: Residential building, Avigliano, panel A.
Figure 6: Residential building, Avigliano, panel A, detail after the test.
It can be noticed that the diagrams of the load as function of the displacement are generally increasing, because of the progressive increase of the contact surface between pin and mortar, and because of the penetration of the pin in more and more confined zones of the joint. One or more decreasing branches can be noticed as well, due to the presence of localized voids, or to lateral displacements and rotations of the aggregate induced by the pin.
0 200 400 600 800 1000 0 10 20 30 40 50 60 70 u (mm) F ( N ) 0 200 400 600 800 1000 0 10 20 30 40 50 60 70 u (mm) F ( N ) 0 200 400 600 800 1000 0 10 20 30 40 50 60 70 u (mm) F ( N ) 0 200 400 600 800 1000 0 10 20 30 40 50 60 70 u (mm) F ( N ) 0 200 400 600 800 1000 0 10 20 30 40 50 60 70 u (mm) F ( N )
Table 1: Displacements, work and mean load, residential building, Avigliano, panel A. Test u1 (mm) u2 (mm) ∆u (mm) W (J) Fm (N) 1 22.0 60.0 38.0 17.11 450.18 2 22.0 60.0 38.0 10.58 278.51 3 28.5 60.0 31.5 10.51 333.79 4 33.0 60.0 27.0 4.84 179.30 5 28.0 60.0 32.0 6.12 191.19 Mean = 286.59 Std dev = 111.43
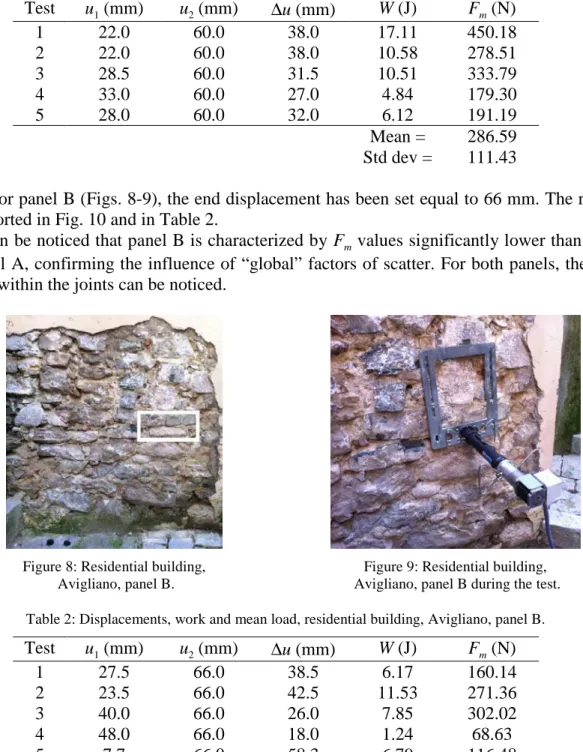
As for panel B (Figs. 8-9), the end displacement has been set equal to 66 mm. The results are reported in Fig. 10 and in Table 2.
It can be noticed that panel B is characterized by Fm values significantly lower than those of panel A, confirming the influence of “global” factors of scatter. For both panels, the high scatter within the joints can be noticed.
Figure 8: Residential building, Avigliano, panel B.
Figure 9: Residential building, Avigliano, panel B during the test. Table 2: Displacements, work and mean load, residential building, Avigliano, panel B.
Test u1 (mm) u2 (mm) ∆u (mm) W (J) Fm (N) 1 27.5 66.0 38.5 6.17 160.14 2 23.5 66.0 42.5 11.53 271.36 3 40.0 66.0 26.0 7.85 302.02 4 48.0 66.0 18.0 1.24 68.63 5 7.7 66.0 58.3 6.79 116.48 Mean = 183.73 Std dev = 100.00
0 200 400 600 800 1000 0 10 20 30 40 50 60 70 u (mm) F ( N ) 0 200 400 600 800 1000 0 10 20 30 40 50 60 70 u (mm) F ( N ) 0 200 400 600 800 1000 0 10 20 30 40 50 60 70 u (mm) F ( N ) 0 200 400 600 800 1000 0 10 20 30 40 50 60 70 u (mm) F ( N ) 0 200 400 600 800 1000 0 10 20 30 40 50 60 70 u (mm) F ( N )
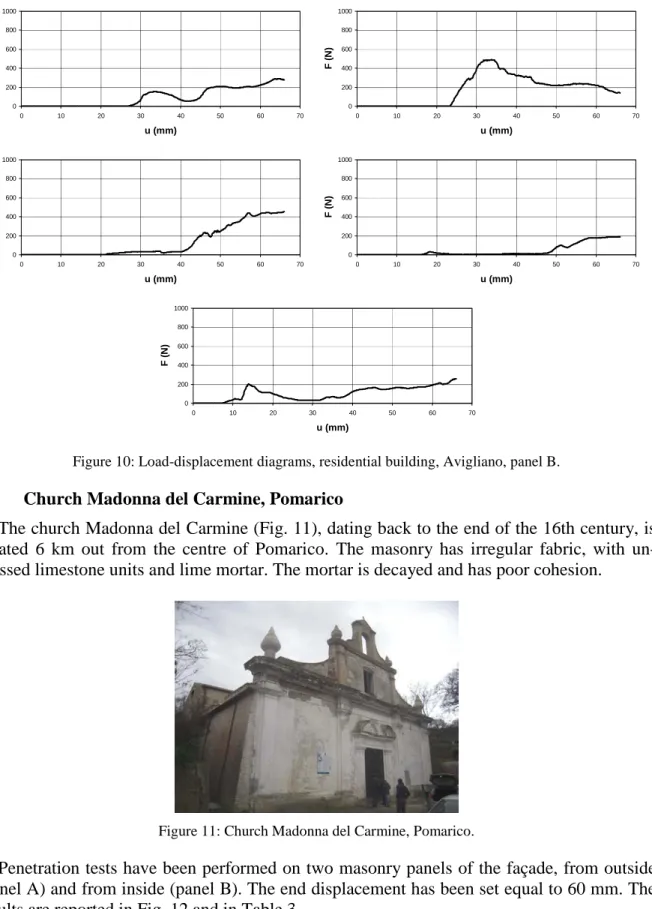
Figure 10: Load-displacement diagrams, residential building, Avigliano, panel B.
3.2 Church Madonna del Carmine, Pomarico
The church Madonna del Carmine (Fig. 11), dating back to the end of the 16th century, is located 6 km out from the centre of Pomarico. The masonry has irregular fabric, with un-dressed limestone units and lime mortar. The mortar is decayed and has poor cohesion.
Figure 11: Church Madonna del Carmine, Pomarico.
Penetration tests have been performed on two masonry panels of the façade, from outside (panel A) and from inside (panel B). The end displacement has been set equal to 60 mm. The results are reported in Fig. 12 and in Table 3.
0 200 400 600 800 1000 0 10 20 30 40 50 60 70 u (mm) F ( N ) 0 200 400 600 800 1000 1200 0 10 20 30 40 50 60 70 u (mm) F ( N ) 0 200 400 600 800 1000 0 10 20 30 40 50 60 70 u (mm) F ( N ) 0 200 400 600 800 1000 0 10 20 30 40 50 60 70 u (mm) F ( N ) 0 200 400 600 800 1000 0 10 20 30 40 50 60 70 u (mm) F ( N )
Figure 12: Load-displacement diagrams, church Madonna del Carmine, Pomarico, panel A.
Table 3: Displacements, work and mean load, church Madonna del Carmine, Pomarico, panel A.
Test u1 (mm) u2 (mm) ∆u (mm) W (J) Fm (N) 1 6.0 60.0 54.0 11.83 219.09 2 6.0 60.0 54.0 24.59 455.34 3 9.0 60.0 51.0 16.34 320.32 4 7.0 60.0 53.0 14.54 274.33 5 0.0 60.0 60.0 11.08 184.61 Mean = 290.74 Std dev = 105.63
The same settings have been used for the test on panel B. The last penetration has been in-terrupted at displacement u2 = 33.5 mm, when the load was approaching the maximum load (1500 N). The results are reported in Fig. 13 and in Table 4.
Table 4: Displacements, work and mean load, church Madonna del Carmine, Pomarico, panel B.
Test u1 (mm) u2 (mm) ∆u (mm) W (J) Fm (N) 1 0.0 60.0 60.0 24.14 402.31 2 0.0 60.0 60.0 18.63 310.45 3 11.0 60.0 49.0 13.08 266.92 4 8.0 60.0 52.0 17.03 327.58 5 6.0 33.5 27.5 9.32 338.81 Mean = 329.21 Std dev = 49.17
0 200 400 600 800 1000 0 10 20 30 40 50 60 70 u (mm) F ( N ) 0 200 400 600 800 1000 0 10 20 30 40 50 60 70 u (mm) F ( N ) 0 200 400 600 800 1000 0 10 20 30 40 50 60 70 u (mm) F ( N ) 0 200 400 600 800 1000 0 10 20 30 40 50 60 70 u (mm) F ( N ) 0 200 400 600 800 1000 1200 1400 0 10 20 30 40 50 60 70 u (mm) F ( N )
Figure 13: Load-displacement diagrams, church Madonna del Carmine, Pomarico, panel B.
It can be noticed that the mean values of Fm are similar for the two panels, indicating their substantial homogeneity. In addition, panel B shows a small scatter within the tested joint.
4 CORRELATION OF THE STATIC TEST WITH THE PERCUSSION TEST
The static penetration test can be correlated with the percussion penetration test [11, 12]. In order to perform such correlation, the same walls previously mentioned have been tested with the percussion penetrometer.
The relation between the static test and the percussion test is based on the equivalence of work. The theoretical work of an individual blow of the percussion penetrometer is:
2 2 1 δ K w= (2) where:
K = 4200 N/m (elastic stiffness of the spring);
δ = 20 mm (initial relative displacement of the spring); yielding:
w = 0.84 J.
The effective work spent to displace to pin, with a single blow, is less than the theoretical work because of a number of dissipative phenomena, as:
- the impact between the hammer and the drum of the penetrometer; - the overcoming of the static friction between pin and mortar; - the inner friction of the apparatus.
The effective work can be written as:
w
where η is an efficiency coefficient, less than 1, which is to be calibrated on experimental ba-sis.
Assuming to execute a percussion test in the same point of the static test, the equivalence of work between the two tests yields:
u F w
nη = m∆ (4)
where n is the number of blows of the percussion test. Eq. (4) can be rewritten:
w F u n m η = ∆ (5)
where the ratio n/∆u is the average number of blows per penetration unit of the percussion
test.
Given the mean load Fm of the static test and an estimation of the efficiency coefficient η,
the average number of blows per penetration unit n/∆u of the percussion test can be calculated
according to Eq. (5).
The efficiency coefficient can be estimated according to the following equation, when both the percussion and the static tests are available on the same panel:
n u w Fm ∆ = η (6)
In Tables 5, 6 are reported the results of the percussion tests on the residential building at Avigliano, panels A and B, respectively, and in Table 7 the results on the church Madonna del Carmine, Pomarico, panel A. The tests yield values of n/∆u ranging between 0.66 and 0.69 mm−1, indicating mortars of poor quality.
Table 5: Percussion penetration test, residential building, Avigliano, panel A.
Table 6: Percussion penetration test, residential building, Avigliano, panel B.
Test n ∆u (mm) n/∆u (mm−1) Test n ∆u (mm) n/∆u (mm−1) 1 23 44.2 0.520 1 40 43.7 0.915 2 38 37.0 1.027 2 29 45.1 0.643 3 30 47.6 0.631 3 30 47.6 0.630 4 30 41.5 0.723 4 20 31.5 0.635 5 23 44.7 0.515 5 24 37.1 0.647 Mean = 0.683 Mean = 0.694 Std dev = 0.211 Std dev = 0.124
Table 7: Percussion penetration test, church Madonna del Carmine, Pomarico, panel A.
Test n ∆u (mm) n/∆u (mm−1) 1 32 40.25 0.795 2 30 43.15 0.695 3 26 46.40 0.560 4 28 46.25 0.605 5 30 46.55 0.644 Mean = 0.660 Std dev = 0.090
For the calculation of the efficiency coefficient, according to Eq. (6), the mean values of
Fm and of n/∆u over five penetrations are used.
The results are reported in Table 8. Because the percussion test has been performed on joints different from those of the static tests, the differences between the two tests are also af-fected by “local” factors of scatter. The total scatter of the efficiency coefficient is rather high, and therefore further data are necessary to establish a reliable relation between the two types of test.
Table 8: Efficiency coefficient.
Building Panel η
A 0.500 Residential building, Avigliano
B 0.315 Church Madonna del Carmine, Pomarico A 0.524
5 CONCLUSIONS
A new penetration test has been presented, based on the penetration of a pin inside the ma-sonry mortar at constant speed. The test provides the applied load as function of the displace-ment of the pin. Based on the force-displacedisplace-ment diagram, the work and the mean applied load can be calculated. The test is moderately destructive for the mortar, and non destructive for the units. Therefore, it is suitable for a widespread use.
In situ tests have been carried out on a residential building and a church. Two
sub-horizontal joints have been tested per building, with five penetrations each. The test on an in-dividual joint requires about 55-70 minutes. The test showed to be suitable for historical rub-ble masonry.
The static penetration test has been put in relation with a percussion test, developed in pre-vious studies, by means of the equivalence of the work spent for the displacement of the pin. Whereas the static penetration test directly provides the work, the percussion test requires the estimation of its efficiency coefficient, due to the presence of dissipative phenomena, such as the impact between the hammer and the drum of the penetrometer. The efficiency coefficient has been evaluated for three panels where both types of test have been carried out. Because the values obtained for the efficiency coefficient are rather scattered, further investigations are necessary to obtain a reliable estimation.
ACKNOWLEDGEMENTS
The development of the penetrometer and the research have been funded under the projects: - “AITECH” and “PRO_CULT” of IBAM-CNR (Basilicata Region ERDF 2007-13);
- “Large Equipments 2011” of “Sapienza” University of Rome; the authors are grateful to the holder of the project, Prof. Giorgio Monti;
- “Dipartimento di Protezione Civile – Consorzio ReLUIS”, signed on 2013-12-27, Research Line Masonry Structures.
The penetrometer, conceived and designed by the first two authors, has been made in the mechanical and electromechanical workshops of Mr. Felice Villano and Mr. Carlo Ligrani.
The authors are grateful to Mr. Raffaele Carlucci for the availability of the residential building at Avigliano, and to Prof. Michelangelo Laterza, Ente Diocesi di Matera-Irsina and Municipality of Pomarico for the availability of the church Madonna del Carmine.
Finally, the authors thanks Dr. Omar Al Shawa for his assistance during the preliminary laboratory tests and the drafting of the user’s manual.
REFERENCES
[1] L. Sorrentino, L. Liberatore, L.D. Decanini, D. Liberatore, The performance of churches in the 2012 Emilia earthquakes, Bulletin of Earthquake Engineering, doi:
10.1007/s10518-013-9519-3, 2013.
[2] L. Sorrentino, L. Liberatore, D. Liberatore, R. Masiani, The behaviour of vernacular buildings in the 2012 Emilia earthquakes, Bulletin of Earthquake Engineering, doi:
10.1007/s10518-013-9455-2, 2013.
[3] ASTM Standard D 3441, Standard Test Method for Mechanical Cone Penetration Tests of Soils. ASTM International, West Conshohocken, PA, www.astm.org, 2005.
[4] BS 1377-9, Methods for Test for Soils for Civil Engineering Purposes. In Situ Tests,
BSI British Standards, London, www.bsi-global.com, 1990.
[5] ASTM Standard D 1586, Standard Test Method for Penetration and Split-Barrel Sam-pling of Soils, ASTM International, West Conshohocken, PA, www.astm.org, 1999. [6] ASTM Standard C 803 / C 803-M, Standard Test Method for Penetration Resistance of
Hardened Concrete, ASTM International, West Conshohocken, PA, www.astm.org, 2003.
[7] BS 1881-207, Testing Concrete. Recommendations for the Assessment of Concrete Strength by Near-to-Surface Tests, BSI British Standards, London, www.bsi-global.com, 1992.
[8] N. Gucci, R. Barsotti, A non-destructive technique for the determination of mortar load capacity in situ. Materials and Structures, 28, 276-283, 1995.
[9] N. Gucci, M. Sassu, Resistenza delle murature: valutazione con metodi non distruttivi, il penetrometro PNT-G. L’Edilizia, XVI(2), 36-40, 2002.
[10] R. Felicetti, N. Gattesco, A penetration test to study the mechanical response of mortar in ancient masonry building. Materials and Structures, 31, 350-356, 1998.
[11] D. Liberatore, G. Spera, M. Cotugno, A new penetration test on mortar joints. Proc. of
the RILEM TC177MDT Workshop “On site control and non destructive evaluation of masonry structures and materials”, Mantua, Italy, November 13-14, 2001.
[12] D. Liberatore, G. Spera, V. Racina, Una prova penetrometrica per valutare le caratteri-stiche della malta: prime calibrazioni. Proc. of the 11th Conference “L’Ingegneria