Troubleshooting Performance Problems in SQL
Server 2008
SQL Server Technical Article
Writers: Sunil Agarwal, Boris Baryshnikov, Keith Elmore, Juergen Thomas, Kun Cheng,
Burzin Patel
Technical Reviewers: Jerome Halmans, Fabricio Voznika, George Reynya
Published: March 2009
Applies to: SQL Server 2008
Summary: Sometimes a poorly designed database or a system that is improperly configured
for the workload can cause the slowdowns in SQL Server. Administrators need to
proactively prevent or minimize problems and, when they occur, diagnose the cause and
take corrective action. This paper provides step-by-step guidelines for diagnosing and
troubleshooting common performance problems by using publicly available tools such as
SQL Server Profiler, Performance Monitor, dynamic management views, and SQL Server
Extended Events (Extended Events) and the data collector, which are new in SQL
The information contained in this document represents the current view of Microsoft
Corporation on the issues discussed as of the date of publication. Because Microsoft must
respond to changing market conditions, it should not be interpreted to be a commitment on
the part of Microsoft, and Microsoft cannot guarantee the accuracy of any information
presented after the date of publication.
This white paper is for informational purposes only. MICROSOFT MAKES NO
WARRANTIES, EXPRESS, IMPLIED, OR STATUTORY, AS TO THE INFORMATION
IN THIS DOCUMENT.
Complying with all applicable copyright laws is the responsibility of the user. Without
limiting the rights under copyright, no part of this document may be reproduced, stored in,
or introduced into a retrieval system, or transmitted in any form or by any means (electronic,
mechanical, photocopying, recording, or otherwise), or for any purpose, without the express
written permission of Microsoft Corporation.
Microsoft may have patents, patent applications, trademarks, copyrights, or other intellectual
property rights covering subject matter in this document. Except as expressly provided in
any written license agreement from Microsoft, the furnishing of this document does not give
you any license to these patents, trademarks, copyrights, or other intellectual property.
Unless otherwise noted, the example companies, organizations, products, domain names,
e-mail addresses, logos, people, places, and events depicted herein are fictitious, and no
association with any real company, organization, product, domain name, e-mail address,
logo, person, place, or event is intended or should be inferred.
© 2009 Microsoft Corporation. All rights reserved.
Microsoft, MSDN, SQL Server, Win32, Windows, Windows Server, and Windows Vista
are either registered trademarks or trademarks of Microsoft Corporation in the United States
and/or other countries.
Table of Contents
Introduction... 1
Goals ... 1
Methodology ... 1
Resource Bottlenecks... 2
Tools for Resolving Resource Bottlenecks ...2
CPU Bottlenecks ... 3
Excessive Query Compilation and Optimization ...4
Detection ...5
Resolution ...7
Unnecessary Recompilation ...8
Detection ...9
Resolution ... 12
Inefficient Query Plan ... 13
Detection ... 14
Resolution ... 14
Intraquery Parallelism... 15
Detection ... 17
Resolution ... 20
Poor Cursor Usage... 20
Detection ... 21
Resolution ... 22
Memory Bottlenecks...22
Background ... 22
Virtual Address Space and Physical Memory ... 22
AWE, Locked Pages, and SQL Server ... 22
Memory Pressures ... 24
Detecting Memory Pressures... 25
Tools for Memory Diagnostics ... 25
New DMVs in SQL Server 2008 ... 25
Resource Governor in SQL Server 2008 ... 26
External Physical Memory Pressure... 27
External Virtual Memory Pressure... 29
Internal Physical Memory Pressure ... 29
Caches and Memory Pressure ... 34
Ring Buffers ... 35
Internal Virtual Memory Pressure ... 40
Resolution ... 49
tempdb...52
Monitoring tempdb Space... 54
Troubleshooting Space Issues... 55
User Objects... 55
Version Store... 56
Internal Objects ... 58
Excessive DDL and Allocation Operations ... 61
Resolution ... 62
Slow-Running Queries...62
Blocking... 63
Locking Granularity and Lock Escalation ... 65
Identifying Long Blocks ... 67
Blocking per Object with sys.dm_db_index_operational_stats ... 69
Overall Performance Effect of Blocking Using Waits ... 70
Monitoring Index Usage ... 72
Extended Events ...74
Data Collector and the MDW...81
Appendix A: DBCC MEMORYSTATUS Description...86
Introduction
It’s not uncommon to experience the occasional slowdown of a database running the Microsoft® SQL Server® database software. The reasons can range from a poorly designed database to a system that is improperly configured for the workload. As an administrator, you want to proactively prevent or minimize problems; if they occur, you want to diagnose the cause and take corrective actions to fix the problem whenever possible. This white paper provides step-by-step guidelines for diagnosing and
troubleshooting common performance problems by using publicly available tools such as SQL Server Profiler; System Monitor (in the Windows Server® 2003 operating system) or Performance Monitor (in the Windows Vista® operating system and Windows Server 2008), also known as Perfmon; dynamic management views
(sometimes referred to as DMVs); and SQL Server Extended Events (Extended Events) and the data collector, which are new in SQL Server 2008. We have limited the scope of this white paper to the problems commonly seen by Microsoft Customer Service and Support, because an exhaustive analysis of all possible problems is not feasible.
Goals
The primary goal of this paper is to provide a general methodology for diagnosing and troubleshooting SQL Server performance problems in common customer scenarios by using publicly available tools.
SQL Server 2008 has made great strides in supportability. New dynamic management views (DMVs) have been added, like sys.dm_os_memory_brokers,
sys.dm_os_memory_nodes, and sys.dm_exec_procedure_stats. Existing DMVs such as sys._dm_os_sys_info, sys.dm_exec_requests, and
sys.dm_exec_requests have been enriched with additional information. You can use DMVs and existing tools, like SQL Server Profiler and Performance Monitor, to collect performance related data for analysis.
The secondary goal of this paper is to introduce new troubleshooting tools and features in SQL Server 2008, including Extended Events and the data collector.
Methodology
There can be many reasons for a slowdown in SQL Server. We use the following three key symptoms to start diagnosing problems:
Resource bottlenecks: CPU, memory, and I/O bottlenecks are covered in this paper. We do not consider network issues. For each resource bottleneck, we
describe how to identify the problem and then iterate through the possible causes. For example, a memory bottleneck can lead to excessive paging that ultimately impacts performance.
tempdb bottlenecks: Because there is only one tempdb for each SQL Server instance, it can be a performance and a disk space bottleneck. An application can overload tempdb through excessive DDL or DML operations and by taking too much space. This can cause unrelated applications running on the server to slow down or fail.
A slow-running user query: The performance of an existing query might regress, or a new query might appear to be taking longer than expected. There can be many reasons for this. For example:
o Changes in statistical information can lead to a poor query plan for an existing query.
o Missing indexes can force table scans and slow down the query.
o An application can slow down due to blocking even if resource utilization is normal.
o Excessive blocking can be due to poor application or schema design or the choice of an improper isolation level for the transaction.
The causes of these symptoms are not necessarily independent of each other. The poor choice of a query plan can tax system resources and cause an overall
slowdown of the workload. So, if a large table is missing a useful index, or if the query optimizer decides not to use it, the query can slow down; these conditions also put heavy pressure on the I/O subsystem to read the unnecessary data pages and on the memory (buffer pool) to store these pages in the cache. Similarly, excessive recompilation of a frequently-run query can put pressure on the CPU. New Performance Tools in SQL Server 2008
SQL Server 2008 introduced new features and tools that you can use to monitor and troubleshoot performance problems. We’ll discuss two features: Extended Events and the data collector.
Resource Bottlenecks
The next sections of this paper discuss CPU, memory, and I/O subsystem resources and how these can become bottlenecks. (Network issues are outside of the scope of this paper.) For each resource bottleneck, we describe how to identify the problem and then iterate through the possible causes. For example, a memory bottleneck can lead to excessive paging, which can ultimately impact performance.
Before you can determine whether you have a resource bottleneck, you need to know how resources are used under normal circumstances. You can use the methods outlined in this paper to collect baseline information about the use of the resource (at a time when you are not having performance problems).
You might find that the problem is a resource that is running near capacity and that SQL Server cannot support the workload in its current configuration. To address this issue, you may need to add more processing power or memory, or you may need to increase the bandwidth of your I/O or network channel. However, before you take that step, it is useful to understand some common causes of resource bottlenecks. Some solutions, such as reconfiguration, do not require the addition of more resources.
Tools for Resolving Resource Bottlenecks
One or more of the following tools can be used to resolve a particular resource bottleneck:
Performance Monitor: This tool is available as part of the Windows® operating system. For more information, see your Windows documentation.
SQL Server Profiler: See SQL Server Profiler in the Performance Tools group in the SQL Server 2008 program group. For more information, see SQL Server 2008 Books Online.
DBCC commands: For more information, see SQL Server 2008 Books Online and Appendix A.
DMVs: For more information, see SQL Server 2008 Books Online.
Extended Events: For more information, see Extended Events later in this paper and SQL Server 2008 Books Online.
Data collector and the management data warehouse (MDW): For more information, see Data Collector and the MDW later in this paper and SQL Server 2008 Books Online.
CPU Bottlenecks
A CPU bottleneck can be caused by hardware resources that are insufficient for the load. However, excessive CPU utilization can commonly be reduced by query tuning (especially if there was a sudden increase without additional load or different queries on the server), addressing any application design factors, and optimizing the system configuration. Before you rush out to buy faster and/or more processors, identify the largest consumers of CPU bandwidth and see whether you can tune those queries or adjust the design/configuration factors.
Performance Monitor is generally one of the easiest means to determine whether the server is CPU bound. You should look to see whether the Processor:% Processor Time counter is high; sustained values in excess of 80% of the processor time per CPU are generally deemed to be a bottleneck.
From within SQL Server, you can also check for CPU bottlenecks by checking the DMVs. Requests waiting with the SOS_SCHEDULER_YIELD wait type or a high number of runnable tasks can indicate that runnable threads are waiting to be scheduled and that there might be a CPU bottleneck on the processor. If you have enabled the data
collector, the SQL Server Waits chart on the Server Activity report is a very easy way to monitor for CPU bottlenecks over time. Consumed CPU and SOS_SCHEDULER_YIELD waits are rolled up into the CPU Wait Category in this report, and if you do see high CPU utilization, you can drill through to find the queries that are consuming the most
The following query gives you a high-level view of which currently cached batches or procedures are using the most CPU. The query aggregates the CPU consumed by all statements with the same plan_handle (meaning that they are part of the same batch or procedure). If a given plan_handle has more than one statement, you may have to drill in further to find the specific query that is the largest contributor to the overall CPU usage.
select top 50
sum(qs.total_worker_time) as total_cpu_time, sum(qs.execution_count) as total_execution_count,
count(*) as number_of_statements, qs.plan_handle
from
sys.dm_exec_query_stats qs
group by qs.plan_handle
order by sum(qs.total_worker_time) desc
The remainder of this section discusses some common CPU-intensive operations that can occur with SQL Server, as well as efficient methods for detecting and resolving these problems.
Excessive Query Compilation and Optimization
Query compilation and optimization is a CPU-intensive process. The cost of optimization increases as the complexity of the query and the underlying schema increases, but even a relatively simply query can take 10-20 milliseconds of CPU time to parse and compile.
To mitigate this cost, SQL Server caches and reuses compiled query plans. Each time a new query is received from the client, SQL Server first searches the plan cache
(sometimes referred to as the procedure cache) to see whether there is already a compiled plan that can be reused. If a matching query plan cannot be found, SQL Server parses and compiles the incoming query before running it.
For an OLTP-type workload, the set of queries that are submitted is relatively small and static. Quite commonly the optimal query plan does not depend on the exact value or values used as predicates in the query because the lookups are based on keys. Reusing query plans in this type of workload is very important because the cost of compilation may be as high as or higher than the cost of executing the query itself. However, a data-warehousing workload may benefit greatly from using ad hoc SQL and letting the query optimizer search for the optimal plan for each set of values, because the run time for these queries is typically much longer than the compile time, and the optimal query plan is more likely to change depending on the predicates in the query. Using
parameterized queries or stored procedures for OLTP-based applications substantially increases the chance of reusing a cached plan and can result in substantial reductions in SQL Server CPU consumption. You can enable parameterization at the database or query level by using the PARAMETERIZATION FORCED database option or query hint, respectively. For more information about important limitations, especially if you rely on indexes on computed columns or indexed views, see SQL Server 2008 Books Online. However, the best place to parameterize queries is within the application itself (at design time), which also helps mitigate the risk of SQL injection by avoiding string
concatenation using parameter values. For more information, see the following topics in SQL Server 2008 Books Online:
SQL Injection (http://msdn.microsoft.com/en-us/library/ms161953.aspx)
Using sp_executesql (http://msdn.microsoft.com/en-us/library/ms175170.aspx)
Detection
During compilation, SQL Server 2008 computes a “signature” of the query and exposes this as the query_hash column in sys.dm_exec_requests and
sys.dm_exec_query_stats, and the QueryHash attribute in Showplan/Statistics XML. Entities with the same query_hash value have a high probability of referring to the same query text if it had been written in a query_hash parameterized form. Queries that vary only in literal values should have the same value. For example, the first two queries share the same query hash, while the third query has a different query hash, because it is performing a different operation.
select * from sys.objects where object_id = 100
select * from sys.objects where object_id = 101
select * from sys.objects where name = 'sysobjects'
The query hash is computed from the tree structure produced during compilation. Whitespace is ignored, as are differences in the use of explicit column lists compared to using an asterisk (*) in the SELECT list. Furthermore, it does not matter if one query uses fully qualified name and another uses just the table name as long as they both refer to the same object. All of the following should produce the same query_hash value.
Use AdventureWorks Go
set showplan_xml on
go
-- Assume this is run by a user whose default schema is Sales
select * from SalesOrderHeader h
select * from Sales.SalesOrderHeader h
select SalesOrderID, RevisionNumber, OrderDate, DueDate, ShipDate, Status, OnlineOrderFlag, SalesOrderNumber, PurchaseOrderNumber, AccountNumber, CustomerID, ContactID, SalesPersonID, TerritoryID,
ShipToAddressID, ShipMethodID, CreditCardID, CreditCardApprovalCode, CurrencyRateID, SubTotal, TaxAmt, Freight, TotalDue, Comment, rowguid, ModifiedDate
from Sales.SalesOrderHeader h go
set showplan_xml off
go
Note that the database portion of the fully qualified name is ignored when the
query_hash value is generated. This allows resource usage to be aggregated across all queries in systems that replicate the same schema and queries against many databases on the same instance.
An easy way to detect applications that submit lots of ad hoc queries is by grouping on the sys.dm_exec_query_stats.query_hash column as follows.
select q.query_hash,
q.number_of_entries, t.text as sample_query, p.query_plan as sample_plan
from (select top 20 query_hash,
count(*) as number_of_entries,
min(sql_handle) as sample_sql_handle,
min(plan_handle) as sample_plan_handle
from sys.dm_exec_query_stats
group by query_hash
having count(*) > 1
order by count(*) desc) as q
cross apply sys.dm_exec_sql_text(q.sample_sql_handle) as t
cross apply sys.dm_exec_query_plan(q.sample_plan_handle) as p
go
Queries that have a number_of_entries value in the hundreds or thousands are excellent candidates for parameterization. If you look at the CompileTime and
CompileCPU attributes under the <QueryPlan> tag of the sample XML query plan and multiply those values times the number_of_entries value for that query, you can get an estimate of how much compile time and CPU you can eliminate by parameterizing the query (which means that the query is compiled once, and then it is cached and reused for subsequent executions). Eliminating these unnecessary cached plans has other intangible benefits as well, such as freeing memory to cache other compiled plans (thereby further reducing compilation overhead) and leaving more memory for the buffer cache.
Resolution
SQL Server 2008 also produces a query_plan_hash value that represents a
“signature” of the query plan’s access path (that is, what join algorithm is used, the join order, index selection, and so forth). Some applications might rely on getting a different query plan based on the optimizer evaluating the specific parameter values passed to that execution of the query. If that is the case, you do not want to parameterize the queries.
You can use the query_hash and query_plan_hash values together to determine whether a set of ad hoc queries with the same query_hash value resulted in query plans with the same or different query_plan_hash values, or access path. This is done via a small modification to the earlier query.
select q.query_hash,
q.number_of_entries, q.distinct_plans,
t.text as sample_query, p.query_plan as sample_plan
from (select top 20 query_hash,
count(*) as number_of_entries,
count(distinct query_plan_hash) as distinct_plans,
min(sql_handle) as sample_sql_handle,
min(plan_handle) as sample_plan_handle
from sys.dm_exec_query_stats
group by query_hash
having count(*) > 1
order by count(*) desc) as q
cross apply sys.dm_exec_sql_text(q.sample_sql_handle) as t
cross apply sys.dm_exec_query_plan(q.sample_plan_handle) as p
go
Note that this new query returns a count of the number of distinct query plans (query_plan_hash values) for a given query_hash value. Rows that return a large number for number_of_entries and a distinct_plans count of 1 are good candidates for parameterization. Even if the number of distinct plans is more than one, you can use sys.dm_exec_query_plan to retrieve the different query plans and examine them to see whether the difference is important and necessary for achieving optimal
performance.
After you determine which queries should be parameterized, the best place to
parameterize them is the client application. The details of how you do this vary slightly depending on which client API you use, but the one consistent thing across all of the APIs is that instead of building the query string with literal predicates, you build a string with a question mark (?) as a parameter marker.
-- Submitting as ad hoc query
select * from Sales.SalesOrderHeader where SalesOrderID = 100 -- Submitting as parameterized
You should use the appropriate APIs for your technology (ODBC, OLE DB, or SQLClient) to bind a value to the parameter marker. The client driver or provider then submits the query in its parameterized form using sp_executesql.
exec sp_executesql N’select * from Sales.SalesOrderHeader where
SalesOrderID = @P1’, N’@P1 int’, 100
Because the query is parameterized, it matches and reuses an existing cached plan. If the entire workload for a given database is appropriate for parameterization and you do not have control over (or can’t change) the client application, you can also enable the forced parameterization option for the database. Note the caveats mentioned earlier; this can prevent the optimizer from matching indexed views and indexes on computed columns.
ALTER DATABASE AdventureWorks SET PARAMETERIZATION FORCED
If you can’t parameterize the client application or enable forced parameterization for the entire database, you can still create a template plan guide for specific queries with the OPTION (PARAMETERIZATION FORCED) hint. For more information about the steps required to do this, see Forced Parameterization (http://technet.microsoft.com/en-us/library/ms175037.aspx) in SQL Server 2008 Books Online.
Unnecessary Recompilation
When a batch or remote procedure call (RPC) is submitted to SQL Server, the server checks for the validity and correctness of the query plan before it begins executing. If one of these checks fails, the batch may have to be compiled again to produce a different query plan. Such compilations are known as recompilations. These
recompilations are generally necessary to ensure correctness and are often performed when the server determines that there could be a more optimal query plan due to changes in underlying data. Compilations by nature are CPU intensive and hence excessive recompilations could result in a CPU-bound performance problem on the system.
In SQL Server 2000, when SQL Server recompiles a stored procedure, the entire stored procedure is recompiled, not just the statement that triggered the recompilation. In SQL Server 2008 and SQL Server 2005, the behavior is changed to statement-level recompilation of stored procedures. When SQL Server 2008 or SQL Server 2005 recompiles stored procedures, only the statement that caused the recompilation is compiled—not the entire procedure. This uses less CPU bandwidth and results in less contention on lock resources such as COMPILE locks. Recompilation can happen in response to various conditions, such as:
Schema changes
Statistics changes
Deferred compilation
Temporary table changes
Stored procedure creation with the RECOMPILE query hint or the OPTION (RECOMPILE) query hint
Detection
You can use Performance Monitor and SQL Server Profiler to detect excessive compilation and recompilation.
Performance Monitor
The SQL Statistics object provides counters to monitor compilation and the type of requests that are sent to an instance of SQL Server. You must monitor the number of query compilations and recompilations in conjunction with the number of batches received to find out whether the compilations are contributing to high CPU use. Ideally, the ratio of SQL Recompilations/sec to Batch Requests/sec should be very low, unless users are submitting ad hoc queries.
These are the key data counters:
SQL Server: SQL Statistics: Batch Requests/sec
SQL Server: SQL Statistics: SQL Compilations/sec
SQL Server: SQL Statistics: SQL Recompilations/sec
For more information, see SQL Statistics Object (http://msdn.microsoft.com/en-us/library/ms190911.aspx) in SQL Server 2008 Books Online.
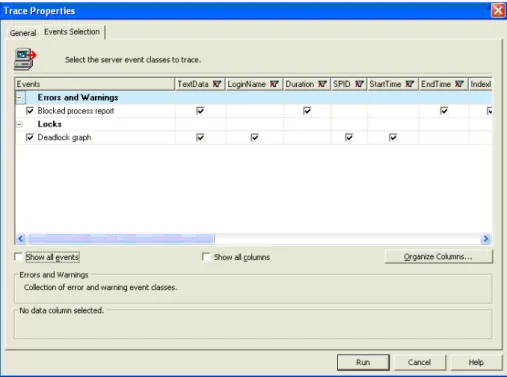
SQL Server Profiler Trace
If the Performance Monitor counters indicate a high number of recompilations, the recompilations could be contributing to the high CPU consumed by SQL Server. Look at the profiler trace to find the stored procedures that are being recompiled. The SQL Server Profiler trace provides that information along with the reason for the
recompilation. You can use the following events to get this information. SP:Recompile / SQL:StmtRecompile
The SP:Recompile and the SQL:StmtRecompile event classes indicate which stored procedures and statements have been recompiled. When you compile a stored
procedure, one event is generated for the stored procedure and one for each statement that is compiled. However, when a stored procedure recompiles, only the statement that caused the recompilation is recompiled. Some of the more important data columns for the SP:Recompile event class are listed here. The EventSubClass data column in particular is important for determining the reason for the recompilation. SP:Recompile is triggered once for the procedure or trigger that is recompiled and is not fired for an ad hoc batch that could likely be recompiled. In SQL Server 2008 and SQL Server 2005, it is more useful to monitor SQL:StmtRecompile, because this event class is fired when any type of batch, ad hoc, stored procedure, or trigger is recompiled.
The key data columns to look at in these events are as follows.
EventClass
EventSubClass
ObjectID (represents stored procedure that contains this statement)
SPID
StartTime
TextData
For more information, see SQL:StmtRecompile Event Class
(http://technet.microsoft.com/en-us/library/ms179294.aspx) in SQL Server 2008 Books Online.
If you have a trace file saved, you can use the following query to see all the recompilation events that were captured in the trace.
select spid, StartTime, Textdata, EventSubclass, ObjectID, DatabaseID, SQLHandle from fn_trace_gettable ( 'e:\recompiletrace.trc' , 1) where EventClass in(37,75,166)
EventClass 37 = Sp:Recompile, 75 = CursorRecompile, 166 = SQL:StmtRecompile
For more information about trace events, see sp_trace_setevent
(http://msdn.microsoft.com/en-us/library/ms186265.aspx) in SQL Server 2008 Books Online.
You could further group the results from this query by the SqlHandle and ObjectID columns, or by various other columns, to see whether most of the recompilations are attributed by one stored procedure or are due to some other reason (such as a SET option that has changed).
Showplan XML For Query Compile
The Showplan XML For Query Compile event class occurs when SQL Server compiles or recompiles a Transact-SQL statement. This event has information about the
statement that is being compiled or recompiled. This information includes the query plan and the object ID of the procedure in question. Capturing this event has significant performance overhead, because it is captured for each compilation or recompilation. If you see a high value for the SQL Compilations/sec counter in Performance Monitor, you should monitor this event. With this information, you can see which statements are frequently recompiled. You can use this information to change the parameters of those statements. This should reduce the number of recompilations.
DMVs
When you use the sys.dm_exec_query_optimizer_info DMV, you can get a good idea of the time SQL Server spends optimizing. If you take two snapshots of this DMV, you can get a good feel for the time that is spent optimizing in the given time period.
select * from sys.dm_exec_query_optimizer_info
counter occurrence value --- --- ---
optimizations 81 1.0
elapsed time 81 6.4547820702944486E-2
In particular, look at the elapsed time, which is the time elapsed due to optimizations. Because the elapsed time during optimization is generally close to the CPU time that is used for the optimization (because the optimization process is very CPU bound), you can get a good measure of the extent to which the compilation and recompilation time is contributing to the high CPU use.
Another DMV that is useful for capturing this information is sys.dm_exec_query_stats.
The data columns to look at are as follows:
Sql_handle
Total worker time
Plan generation number
Statement Start Offset
For more information, see sys.dm_exec_query_stats (http://msdn.microsoft.com/en-us/library/ms189741.aspx) in SQL Server 2008 Books Online.
In particular, plan_generation_num indicates the number of times the query has recompiled. The following sample query gives you the top 25 stored procedures that have been recompiled.
select * from sys.dm_exec_query_optimizer_info
select top 25 sql_text.text, sql_handle, plan_generation_num, execution_count, dbid, objectid from sys.dm_exec_query_stats a
cross apply sys.dm_exec_sql_text(sql_handle) as sql_text
where
plan_generation_num >1
order by plan_generation_num desc
For more information, see Batch Compilation, Recompilation, and Plan Caching Issues in SQL Server 2005
(http://www.microsoft.com/technet/prodtechnol/sql/2005/recomp.mspx) on Microsoft TechNet.
Resolution
If you detect excessive compilation and recompilation, consider the following options:
If the recompilation occurred because a SET option changed, use SQL Server Profiler to determine which SET option changed. Avoid changing SET options within stored procedures. It is better to set them at the connection level. Ensure that SET options are not changed during the lifetime of the connection.
Recompilation thresholds for temporary tables are lower than for normal tables. If the recompilations on a temporary table are due to statistics changes, you can change the temporary tables to table variables. A change in the cardinality of a table variable does not cause a recompilation. The drawback of this approach is that the query optimizer does not keep track of a table variable’s cardinality because statistics are not created or maintained on table variables. This can result in less optimal query plans. You can test the different options and choose the best one.
Another option is to use the KEEP PLAN query hint. This sets the threshold of temporary tables to be the same as that of permanent tables. The EventSubclass column displays “Statistics Changed” for an operation on a temporary table.
To avoid recompilations that are due to changes in statistics (for example, if the plan becomes suboptimal due to change in the data statistics), specify the KEEPFIXED PLAN query hint. With this option in effect, recompilations can only happen to ensure correctness (for example, when the underlying table structure has changed and the plan no longer applies) and not to respond to changes in statistics. For example, a recompilation can occur if the schema of a table that is referenced by a statement changes, or if a table is marked with the sp_recompile stored procedure.
Turning off the automatic updates of statistics for indexes and statistics that are defined on a table or indexed view prevents recompilations that are due to statistics changes on that object. Note, however, that turning off the auto-stats feature by using this method is not usually a good idea. This is because the query optimizer is no longer sensitive to data changes in those objects and suboptimal query plans might result. Use this method only as a last resort after exhausting all other alternatives.
Batches should have qualified object names (for example, dbo.Table1) to avoid recompilation and to avoid ambiguity between objects.
To avoid recompilations that are due to deferred compilations, do not interleave DML and DDL or create the DDL from conditional constructs such as IF statements.
Run Database Engine Tuning Advisor (DTA) to see whether any indexing changes improve the compile time and the execution time of the query.
Check to see whether the stored procedure was created with the WITH RECOMPILE option or whether the RECOMPILE query hint was used. If a procedure was created with the WITH RECOMPILE option, in SQL Server 2008 or SQL Server 2005, you may be able to take advantage of a statement-level RECOMPILE hint if a particular statement within that procedure needs to be recompiled. Using this hint at the statement level avoids the necessity of recompiling the whole procedure each time it executes, while at the same time allowing the individual statement to be compiled. For more information about the RECOMPILE hint, see Query Hints (Transact-SQL)
(http://msdn.microsoft.com/en-us/library/ms181714.aspx) in SQL Server 2008 Books Online.
Inefficient Query Plan
When generating an execution plan for a query, the SQL Server optimizer attempts to choose a plan that provides the fastest response time for that query. Note that the fastest response time doesn’t necessarily mean minimizing the amount of I/O that is used, nor does it necessarily mean using the least amount of CPU—it is a balance of the various resources.
Certain types of operators are more CPU-intensive than others. By their nature, the Hash operator and Sort operator scan through their respective input data. If read-ahead (prefetch) is used during such a scan, the pages are almost always available in the buffer cache before the page is needed by the operator. Thus, waits for physical I/O are minimized or eliminated. If these types of operations are no longer constrained by physical I/O, they tend to manifest themselves in high CPU consumption. By contrast, nested loop joins have many index lookups and can quickly become I/O bound if the index lookups are traversing to many different parts of the table so that the pages can’t fit into the buffer cache.
The most significant input the optimizer uses in evaluating the cost of various
alternative query plans is the cardinality estimates for each operator, which you can see in the Showplan (EstimateRows and EstimateExecutions attributes). Without
accurate cardinality estimates, the primary input used in optimization is flawed, and many times so is the final plan.
For an excellent white paper that describes in detail how the SQL Server optimizer uses statistics, see Statistics Used by the Query Optimizer in Microsoft SQL Server 2005 (http://www.microsoft.com/technet/prodtechnol/sql/2005/qrystats.mspx). The white paper discusses how the optimizer uses statistics, best practices for maintaining up-to-date statistics, and some common query design issues that can prevent accurate estimate cardinality and thus cause inefficient query plans.
Detection
Inefficient query plans are usually detected comparatively. An inefficient query plan can cause increased CPU consumption.
The following query against sys.dm_exec_query_stats is an efficient way to determine which query is using the most cumulative CPU.
select highest_cpu_queries.plan_handle, highest_cpu_queries.total_worker_time, q.dbid, q.objectid, q.number, q.encrypted, q.[text] from (select top 50 qs.plan_handle, qs.total_worker_time from sys.dm_exec_query_stats qs
order by qs.total_worker_time desc) as highest_cpu_queries cross apply sys.dm_exec_sql_text(plan_handle) as q
order by highest_cpu_queries.total_worker_time desc
Alternatively, you can query against sys.dm_exec_cached_plans by using filters for various operators that may be CPU intensive, such as ‘%Hash Match%’, ‘%Sort%’ to look for suspects.
Resolution
Consider the following options if you detect inefficient query plans:
Tune the query with the Database Engine Tuning Advisor to see whether it produces any index recommendations.
Check for issues with bad cardinality estimates.
Are the queries written so that they use the most restrictive WHERE clause that is applicable? Unrestricted queries are resource intensive by their very nature.
Run UPDATE STATISTICS on the tables involved in the query and check to see whether the problem persists.
Does the query use constructs for which the optimizer is unable to accurately estimate cardinality? Consider whether the query can be modified in a way so that the issue can be avoided.
If it is not possible to modify the schema or the query, you can use the plan guide feature to specify query hints for queries that match certain text criteria. Plan guides can be created for ad hoc queries as well as queries inside a stored procedure. Hints such as OPTION (OPTIMIZE FOR) enable you to impact the cardinality estimates while leaving the optimizer its full array of potential plans. Other hints such as OPTION (FORCE ORDER) or OPTION (USE PLAN) provide you with varying degrees of control over the query plan. SQL Server 2008 offers full
DML support for plan guides, which means that that they can be created for SELECT, INSERT, UPDATE, DELETE or MERGE statements.
SQL Server 2008 also offers a new feature called plan freezing that allows you to freeze a plan exactly as it exists in the plan cache. This option is similar to creating a plan guide with the USE PLAN query hint specified. However, it eliminates the need to execute lengthy commands as required when creating a plan guides. It also minimizes the user errors with go along with those lengthy commands. For
example, the simple two-statement batch presented below is all that’s needed to freeze a plan for a query that matches the specified text criteria.
DECLARE @plan_handle varbinary(64);
-- Extract the query's plan_handle.
SELECT @plan_handle = plan_handle FROM sys.dm_exec_query_stats AS qs CROSS APPLY sys.dm_exec_sql_text(sql_handle)
WHERE text LIKE N'Some query matching criteria%';
EXECUTE sp_create_plan_guide_from_handle
@name = N'Sample_PG1',
@plan_handle = @plan_handle,
@statement_start_offset = NULL;
GO
This statement creates a plan guide (Sample_PG1) in the sys.plan_guides table.
Intraquery Parallelism
When generating an execution plan for a query, the SQL Server optimizer attempts to choose the plan that provides the fastest response time for that query. If the query’s cost exceeds the value specified in the cost threshold for parallelism option and parallelism has not been disabled, the optimizer attempts to generate a plan that can be run in parallel. A parallel query plan uses multiple threads to process the query, with each thread distributed across the available CPUs and concurrently utilizing CPU time from each processor. The maximum degree of parallelism can be limited server-wide by using the max degree of parallelism option, on a resource workload group level, or on a per-query level by using the OPTION (MAXDOP) hint.
The decision on the actual degree of parallelism (DOP) used for execution—a measure of how many threads will do a given operation in parallel—is deferred until execution time. Before executing the query, SQL Server determines how many schedulers are underutilized and chooses a DOP for the query that fully utilizes the remaining
schedulers. After a DOP is chosen, the query runs with the chosen degree of parallelism until completion. A parallel query typically uses a similar but slightly higher amount of CPU time as compared to the corresponding serial execution plan, but it does so in a shorter amount of time. As long as there are no other bottlenecks, such as waits for physical I/O, parallel plans generally should use 100% of the CPU across all of the processors.
One key factor (how idle the system is) that led to running a parallel plan can change after the query starts executing. This can change, however, after the query starts
executing. For example, if a query comes in during an idle time, the server might choose to run with a parallel plan and use a DOP of four and spawn up threads on four different processors. After those threads start executing, existing connections can submit other queries that also require a lot of CPU. At that point, all the different threads will share short time slices of the available CPU, resulting in higher query duration.
Running with a parallel plan is not inherently bad and should provide the fastest response time for that query. However, the response time for a given query must be weighed against the overall throughput and responsiveness of the rest of the queries on the system. Parallel queries are generally best suited to batch processing and decision support workloads and might not be useful in a transaction processing environment. SQL Server 2008 implemented significant scalability improvements to fully utilize available hardware with partitioned table queries. Consequently, SQL Server 2008 might use higher amounts of CPU during parallel query execution than older versions. If this is not desired, you should limit or disable parallelism.
Detection
Intraquery parallelism problems can be detected by using the following methods. Performance Monitor
For more information, see the SQL Server:SQL Statistics – Batch Requests/sec counter and SQL Statistics Object
(http://msdn.microsoft.com/en-us/library/ms190911.aspx) in SQL Server 2008 Books Online.
Because a query must have an estimated cost that exceeds the cost threshold for the parallelism configuration setting (which defaults to 5) before it is considered for a parallel plan, the more batches a server is processing per second, the less likely it is that the batches are running with parallel plans. Servers that are running many parallel queries normally have small batch requests per second (for example, values less than 100).
DMVs
From a running server, you can determine whether any active requests are running in parallel for a given session by using the following query.
select
r.session_id,
r.request_id,
max(isnull(exec_context_id, 0)) as number_of_workers,
r.sql_handle, r.statement_start_offset, r.statement_end_offset, r.plan_handle from sys.dm_exec_requests r
join sys.dm_os_tasks t on r.session_id = t.session_id join sys.dm_exec_sessions s on r.session_id = s.session_id
where s.is_user_process = 0x1 group by r.session_id, r.request_id, r.sql_handle, r.plan_handle, r.statement_start_offset, r.statement_end_offset
With this information, you can easily retrieve the text of the query by using sys.dm_exec_sql_text, and you can retrieve the plan by using
sys.dm_exec_cached_plan.
You can also search for plans that are eligible to run in parallel. To do this, search the cached plans to see whether a relational operator has its Parallel attribute as a nonzero value. These plans might not run in parallel, but they can to do so if the system is not too busy.
--
-- Find query plans that can run in parallel -- select p.*, q.*, cp.plan_handle from sys.dm_exec_cached_plans cp
cross apply sys.dm_exec_query_plan(cp.plan_handle) p cross apply sys.dm_exec_sql_text(cp.plan_handle) as q
where
cp.cacheobjtype = 'Compiled Plan' and
p.query_plan.value('declare namespace
p="http://schemas.microsoft.com/sqlserver/2004/07/showplan"; max(//p:RelOp/@Parallel)', 'float') > 0
In general, the duration of a query is longer than the amount of CPU time, because some of the time was spent waiting on resources such as a lock or physical I/O. The only scenario where a query can use more CPU time than the elapsed duration is when the query runs with a parallel plan such that multiple threads concurrently use CPU. Note that not all parallel queries demonstrate this behavior (where the CPU time is greater than the duration).
select qs.sql_handle, qs.statement_start_offset, qs.statement_end_offset, q.dbid, q.objectid, q.number, q.encrypted, q.text from sys.dm_exec_query_stats qs
cross apply sys.dm_exec_sql_text(qs.plan_handle) as q
where
qs.total_worker_time > qs.total_elapsed_time
SQL Trace
Look for the following signs of parallel queries, which could be either statements or batches that have CPU time greater than the duration.
select
TextData
from
::fn_trace_gettable('c:\temp\high_cpu_trace.trc', default)
where
EventClass in (10, 12) -- RPC:Completed, SQL:BatchCompleted and CPU > Duration/1000 -- CPU is in milliseconds, Duration in microseconds oOr can be Showplans (un-encoded) that have Parallelism operators in them
select
EventClass, TextData
from
::fn_trace_gettable('c:\temp\high_cpu_trace.trc', default)
where
Resolution
Any query that runs with a parallel plan is one that the optimizer identifies as expensive enough to exceed the cost threshold of parallelism, which defaults to 5 (roughly a 5-second execution time on a reference computer). Any queries identified through the previous methods are candidates for further tuning.
Use the Database Engine Tuning Advisor to see whether any indexing changes, changes to indexed views, or partitioning changes could reduce the cost of the query.
Check for significant differences in the actual versus the estimated cardinality, because the cardinality estimates are the primary factor in estimating the cost of the query. If any significant differences are found:
o If the auto create statistics database option is disabled, make sure that there are no MISSING STATS entries in the Warnings column of the Showplan output.
o Try running UPDATE STATISTICS on the tables where the cardinality estimates are off.
o Verify that the query doesn’t use a query construct that the optimizer can’t accurately estimate, such as multistatement table-valued functions or CLR functions, table variables, or comparisons with a Transact-SQL variable (comparisons with a parameter are okay).
o Evaluate whether the query could be written in a more efficient fashion using different Transact-SQL statements or expressions.
Poor Cursor Usage
Versions of SQL Server prior to SQL Server 2005 only supported a single active
common per connection. A query that was executing or had results pending to send to the client was considered active. In some situations, the client application might need to read through the results and submit other queries to SQL Server based on the row just read from the result set. This could not be done with a default result set, because it could have other pending results. A common solution was to change the connection properties to use a server-side cursor.
When a server-side cursor is used, the database client software (the OLE DB provider or ODBC driver) transparently encapsulates client requests inside special extended stored procedures, such as sp_cursoropen or sp_cursorfetch. This is referred to as an API
cursor (as opposed to a Transact-SQL cursor). When the user executes the query, the
query text is sent to the server via sp_cursoropen; requests to read from the result set result in a sp_cursorfetch instructing the server to send back only a certain
number of rows. By controlling the number of rows that are fetched, the ODBC driver or OLE DB provider can cache the row or rows. This prevents a situation where the server is waiting for the client to read all the rows it has sent. Thus, the server is ready to accept a new request on that connection.
Applications that open cursors and fetch one row (or a small number of rows) at a time can easily become bottlenecked by the network latency, especially on a wide area network (WAN). On a fast network with many different user connections, the overhead required to process many cursor requests can become significant. Because of the overhead associated with repositioning the cursor to the appropriate location in the result set, per-request processing overhead, and similar processing, it is more efficient for the server to process a single request that returns 100 rows than to process
100 separate requests that return the same 100 rows one row at a time.
Detection
You can use the following tools to troubleshoot poor cursor usage. Performance Monitor
By looking at the SQL Server:Cursor Manager By Type – Cursor Requests/Sec counter, you can get a general feel for how many cursors are being used on the system. Systems that have high CPU utilization because of small fetch sizes typically have hundreds of cursor requests per second. There are no specific counters that list the fetch buffer size.
DMVs
You can use following query to determine the connections with API cursors (as opposed to Transact-SQL cursors) that are using a fetch buffer size of one row. It is much more efficient to use a larger fetch buffer, such as 100 rows.
select cur.*
from
sys.dm_exec_connections con
cross apply sys.dm_exec_cursors(con.session_id) as cur
where
cur.fetch_buffer_size = 1
and cur.properties LIKE 'API%' -- API cursor (Transact-SQL cursors always
have a fetch buffer of 1)
SQL Trace
Use a trace that includes the RPC:Completed event class search for sp_cursorfetch statements. The value of the fourth parameter is the number of rows returned by the fetch. The maximum number of rows that are requested to be returned is specified as an input parameter in the corresponding RPC:Starting event class.
Resolution
Determine whether cursors are the most appropriate means to accomplish the processing or whether a set-based operation, which is generally more efficient, is possible.
Consider enabling multiple active results (MARS) when connecting to SQL Server 2008.
Consult the appropriate documentation for your specific API to determine how to specify a larger fetch buffer size for the cursor:
o ODBC - SQL_ATTR_ROW_ARRAY_SIZE
o OLE DB – IRowset::GetNextRows or IRowsetLocate::GetRowsAt
Memory Bottlenecks
This section specifically addresses low memory conditions and ways to diagnose them as well as different memory errors, possible reasons for them, and ways to
troubleshoot.
Background
It is quite common to refer to different memory resources by using the single generic term memory. As there are several types of memory resources, it is important to understand and differentiate which particular memory resource is referred to.
Virtual Address Space and Physical Memory
In the Windows operating system, each process has its own virtual address space (sometimes referred to as VAS). The set of all virtual addresses available for process use constitutes the size of the virtual address space. The size of the virtual address space depends on the architecture (32-bit or 64-bit) and the operating system. In the context of troubleshooting, it is important to understand that virtual address space is a consumable memory resource and an application can run out of it, especially on 32-bit platform while physical memory may still be available.
For more information about virtual address space, see Process Address Space
(http://technet.microsoft.com/en-us/library/ms189334.aspx) in SQL Server 2008 Books Online and Virtual Address Space
(http://msdn.microsoft.com/library/en-us/memory/base/virtual_address_space.asp) in the Win32® and COM Development documentation in the MSDN® Library.
AWE, Locked Pages, and SQL Server
Address Windowing Extensions (AWE) is an API that allows a 32-bit application to manipulate physical memory beyond 4 GB memory limit. The AWE mechanism
technically is not necessary on 64-bit platform. It is, however, present there. Memory pages that are allocated through the AWE mechanism are referred as locked pages on the 64-bit platform.
On both 32-bit and 64-bit platforms, memory that is allocated through the AWE mechanism cannot be paged out. This can be beneficial to the application. (This is one of the reasons for using AWE mechanism on 64-bit platform.) This also affects the amount of RAM that is available to the system and to other applications, which might
have detrimental effects. For this reason, in order to use AWE, the Lock Pages in Memory privilege must be granted for the account that runs SQL Server.
From a troubleshooting perspective, an important point is that the SQL Server buffer pool uses AWE allocated memory; however, only database (hashed) pages can mapped or unmapped to take advantage of using additional memory allocated through AWE. Memory allocated through the AWE mechanism is not reported by Task Manager or in the Process: Private Bytes performance counter. You need to use counters that are specific to SQL Server counters or dynamic management views to obtain this
information.
For more information about AWE mapped memory, see Managing Memory for Large Databases (http://msdn.microsoft.com/en-us/library/ms191481.aspx) and Memory Architecture (http://msdn.microsoft.com/en-us/library/ms187499.aspx) in SQL Server 2008 Books Online, and Large Memory Support
(http://msdn.microsoft.com/en-us/library/aa366718.aspx) in the Win32 and COM Development documentation in the MSDN Library. For more information about Physical Address Extension (PAE), 4-gigabyte tuning (/3GB, /USERVA boot options), and AWE, see Physical Address
Extension (http://msdn.microsoft.com/en-us/library/aa366796.aspx) in the Win32 and COM Development documentation in the MSDN Library.
The following table summarizes the maximum memory support options for different configurations of SQL Server 2008. (Note that a particular edition of SQL Server or Windows may put more restrictive limits on the amount of supported memory.) Table 1
Configuration User VAS Max physical
memory
AWE/locked pages support Native 32-bit on 32-bit operating
system
with /3GB boot parameter1
2 GB 3 GB 64 GB 16 GB Yes Yes
32-bit on x64 operating system (WOW)
4 GB 64 GB Yes
32-bit on IA64 operating system (WOW)
2 GB 2 GB No
Native 64-bit on x64 operating system
8 terabytes 2 terabytes Yes
Native 64-bit on IA64 operating system
7 terabytes 2 terabytes Yes
Current maximum memory limit depends on the Windows edition and service pack. For more information, see Memory Limits for Windows Releases
(http://msdn.microsoft.com/en-us/library/aa366778.aspx) in the Win32 and COM Development documentation in the MSDN Library.
1
For more information about boot parameters, see Using AWE
(http://technet.microsoft.com/en-us/library/ms175581.aspx) in SQL Server 2008 Books Online.
Memory Pressures
Memory pressure indicates that a limited amount of memory is available. Identifying when SQL Server runs under memory pressure will help you troubleshoot memory-related issues. SQL Server responds differently depending on the type of memory pressure that is present. The following table summarizes the types of memory
pressures and their general underlying causes. In all cases, you are more likely to see time-out or explicit out-of-memory error messages.
Table 2
Pressure External Internal
Physical Physical memory (RAM) running low. This causes the system to trim working sets of currently running processes, which can result in overall slowdown.
SQL Server detects this condition and, depending on the
configuration, it might reduce the commit target of the buffer pool and start clearing internal caches.
SQL Server detects high memory consumption internally, causing redistribution of memory between internal components.
Internal memory pressure may be a result of:
Responding to the external memory pressure
(SQL Server sets lower memory usage caps).
Changed memory settings (for example, max server memory).
Changes in memory distribution of internal components.
Virtual Running low on available memory commitment (the difference between Memory:Commit Limit and Memory:Committed Bytes) is low (could be due to lack of space in the system page files). This can cause the system to fail memory allocations. This condition can result in the whole system responding very slowly or even bring it to a halt.
Running low on VAS (direct allocations, DLLs loaded in SQL Server VAS, high number of threads) or VAS fragmentation (a lot of VAS is available but in small blocks).
SQL Server detects this condition and can release reserved regions of VAS, reduce buffer pool commit target, and start shrinking caches.
Windows has a notification mechanism that reports if physical memory is running high or low. SQL Server uses this mechanism in its memory management decisions. For more information, see QueryMemoryResourceNotification in the Win32 and COM Development documentation in the MSDN Library.
Table 3
Pressure External Internal
Physical 1. Find major system memory consumers.
2. Attempt to eliminate (if possible).
3. Check for adequate system RAM and consider adding more RAM (usually requires more careful investigation beyond the scope of this paper).
1. Identify major memory consumers inside SQL Server.
2. Verify server configuration. 3. Further actions depend on
the investigation: check for workload; possible design issues; other resource bottlenecks.
Virtual 1. Increase swap file size. 2. Check for major physical
memory consumers and follow steps of external physical memory pressure.
Follow steps of internal physical memory pressure.
Detecting Memory Pressures
Memory pressure by itself does not indicate a problem. Memory pressure is a necessary but not a sufficient condition for the server to encounter memory errors later on.
Working under memory pressure could be a normal operating condition for the server. However, signs of memory pressure can also indicate that the server is running close to its capacity and the potential for out-of-memory errors exists. In the case of a normally operating server, you can use information about memory pressures as a baseline for determining reasons for out-of-memory conditions later.
Tools for Memory Diagnostics
The following tools and sources of information can be used for memory troubleshooting:
General system and SQL Server state and memory-specific DMVs.
The DBCC MEMORYSTATUS command.
SQL Server ring buffers.
Performance counters.
The SQL Server error log, and Windows application and system logs. You can use Log File Viewer in SQL Server Management Studio to look at Windows and SQL Server error logs in one place in a time-synchronized fashion. Log File Viewer is accessible through Object Explorer. For connected database servers, expand
Management, and then click SQL Server Logs. For more information, see Log File Viewer (http://msdn.microsoft.com/en-us/library/dd206996.aspx)in SQL Server 2008 Books Online.
New DMVs in SQL Server 2008
Several new dynamic management views (sometimes known as DMVs) in SQL Server 2008 simplify retrieval of information that can be helpful with memory troubleshooting.
In some cases, newly introduced DMVs provide information that was previously
available only in DBCC MEMORYSTATUS output. The following list provides a summary of new DMVs for memory troubleshooting:
sys.dm_os_memory_brokers provides information about memory allocations using the internal SQL Server memory manager. The information provided can be useful in determining very large memory consumers.
sys.dm_os_memory_nodes and sys.dm_os_memory_node_access_stats provide information about physical non-uniform memory access (NUMA) memory nodes and node access statistics grouped by the type of the page.
(sys.dm_os_memory_node_access_stats is populated under dynamic trace flag 842 due to its performance impact.)
sys.dm_os_nodes provides information about CPU node configuration for SQL Server. This DMV also reflects software NUMA (soft-NUMA) configuration.
sys.dm_os_process_memory provides overview information about SQL Server memory usage.
sys.dm_os_sys_memory provides overview information about the system memory usage.
sys.dm_resource_governor_configuration, sys.dm_resource_governor_resource_pools, and
sys.dm_resource_governor_workload_groups provide information about the state of the Resource Governor feature of SQL Server 2008. Some of the configuration parameters of Resource Governor affect how SQL Server allocates memory; you should check these parameters during memory troubleshooting. For more information about these DMVs, see SQL Server 2008 Books Online.
Resource Governor in SQL Server 2008
Resource Governor is a new feature of SQL Server 2008 Enterprise that enables you to modify SQL Server memory allocation policies. When you troubleshoot memory-related errors, remember that out-of-memory errors can be related to the configuration of Resource Governor. Specifically:
The out-of-memory error message (701) now always includes a reference to the Resource Governor resource pool, regardless of whether Resource Governor is used or present or not. This reference does not necessarily indicate a problem with your Resource Governor configuration; it refers to the fact that the failed memory allocation happened as part of particular resource pool (which can be the "internal" predefined resource pool on editions where Resource Governor is not present).
Reducing MAX_MEMORY_PERCENT for a Resource Governor resource pool can cause out-of-memory errors in the pool even if memory is otherwise available.
MIN_MEMORY_PERCENT values greater than zero on some resource pools can lower the amount of memory that is available to other resource pools, causing effects that are similar to lowering MAX_MEMORY_PERCENT. For more
information about effective maximums, see Resource Governor Concepts (http://msdn.microsoft.com/en-us/library/bb934084.aspx) in SQL Server 2008 Books Online.
There is a set of memory brokers for each Resource Governor resource pool, which are reflected in the output of the sys.dm_os_memory_brokers DMV and the output of DBCC MEMORYSTATUS. Internal memory pressure might be localized to a particular Resource Governor resource pool, depending on the load and configuration of that pool. Memory usage of query compilation, execution, and caches is partitioned on a per-resource-pool basis.
Commands such as DBCC FREESYSTEMCACHE and DBCC FREEPROCCACHE take pool_id as a parameter, enabling part of the cache to be cleared, corresponding to a particular resource pool.
A set of DMVs that you can use in memory troubleshooting
(sys.dm_exec_cached_plans, sys.dm_os_memory_cache_entries, sys.dm_exec_query_resource_semaphores,
sys.dm_exec_query_memory_grants, sys.dm_exec_requests, and sys.dm_exec_sessions) are augmented with pool_id and/or group_id columns that reflect the Resource Governor configuration.
External Physical Memory Pressure
Look at the Memory: Available [M, K]Bytes performance counter. If the available memory amount is low, external memory pressure might be present. The exact value depends on many factors, such as the total amount of installed physical memory or the architecture (32-bit or 64-bit); however, you can start looking into this when the value drops below 50-100 MB. As with any troubleshooting strategy, keeping a baseline of a normally operating system provides you with a good reference value to look for.
If external memory pressure exists and you are seeing memory-related errors, you will need to identify major consumers of the physical memory on the system. To do this, look at the Process: Working Set performance counters and identify the largest consumers.
The total use of physical memory on the system can be roughly accounted for by summing the following counters:
Process object, Working Set counter for each process
Memory object
o Cache Bytes counter for system working set
o Pool Nonpaged Bytes counter for size of unpaged pool o Available Bytes
o Modified Page List Bytes counter
If there’s no external pressure, the Process: Private Bytes counter should be close to the size of the working set (Process: Working Set), which means that no memory is paged out.
Note that the corresponding performance counters do not count memory that is allocated through AWE mechanisms. Thus the information is insufficient if AWE is enabled or locked pages are used. In this case, you need to look at the memory distribution inside SQL Server to get a full picture. You can use the
sys.dm_os_memory_clerks DMV as follows to find out how much memory SQL Server has allocated through the AWE mechanism.
from
sys.dm_os_memory_clerks
Note that in SQL Server, currently only buffer pool clerks (type =
‘MEMORYCLERK_SQLBUFFERPOOL’) use this mechanism, and they only do so if AWE is enabled.
In the 64-bit version of SQL Server, if the "lock pages in memory" privilege is granted to the account running SQL Server 2008 or SQL Server 2005 and the edition (Enterprise or Developer) allows the use of locked pages, SQL Server allocates memory using the AWE mechanism. There is no need to set the awe enabled option explicitly. Memory allocated through the AWE API will be reflected in the output of the previous query. In SQL Server 2008, you can obtain this information simply by querying the
sys.dm_os_process_memory DMV.
The physical_memory_in_use column indicates total memory usage of the server including allocation through large page and AWE APIs. The
large_page_allocations_kb and locked_pages_allocations_kb columns show the amount of memory allocated using large page and AWE APIs, respectively.
process_physical_memory_low = 1 indicates that the process is responding to physical memory low notification. A memory_utilization_percentage value below 100% under normal load may warrant investigation if the server is under external memory pressure.
Similarly, you can use the sys.dm_os_sys_memory DMV in SQL Server 2008 to assess the system state.
select
total_physical_memory_kb / 1024
as
phys_mem_mb,
available_physical_memory_kb / 1024
as
avail_phys_mem_mb,
system_cache_kb /1024
as
sys_cache_mb,
(kernel_paged_pool_kb+kernel_nonpaged_pool_kb) / 1024
as
kernel_pool_mb,
total_page_file_kb / 1024
as
total_page_file_mb,
available_page_file_kb / 1024
as
available_page_file_mb,
system_memory_state_desc
from
sys
.
dm_os_sys_memory
This query returns information about the state of the system (totals and available numbers) as well as the global state if the system detects low, high, or steady memory conditions. The "Available physical memory is low" indicator in the
system_memory_state_desc column is another sign of external memory pressure that requires further investigation. Relieving external memory pressure by identifying and eliminating major physical memory consumers (if possible) and/or by adding more memory should generally resolve problems related to memory.
External Virtual Memory Pressure
You need to determine whether page file(s) have enough space to accommodate current memory allocations. To check this, look at the following counters: Memory: Commit Limit, Paging File: %Usage, Paging File: %Usage Peak. Commit Limit is the amount of virtual memory that can be committed without extending page file space.
You can roughly estimate the amount of memory that is paged out per process by subtracting the value of Process: Working Set from the Process Private Bytes counters.
If Paging File: %Usage Peak is high, check the System Event log for events that could indicate page file growth or notifications of “running low on virtual memory”. You may need to increase the size of your page file(s). High Paging File: %Usage
indicates a physical memory over commitment and should be considered together with external physical memory pressure (large consumers, adequate amount of RAM
installed).
In SQL Server 2008 you can assess the state of the page file limits from corresponding columns of the sys.dm_os_sys_memory DMV. total_page_file_kb matches the Commit Limit performance counter. available_page_file_kb represents available memory commitment. Note that the difference between these two values does not reflect actual page file usage. It equals to the current commit charge value for the system.
Internal Physical Memory Pressure
Because internal memory pressure is set by SQL Server itself, a logical step is to look at the memory distribution inside SQL Server by checking for any anomalies in buffer distribution. Normally, the buffer pool accounts for the most of the memory committed by SQL Server. To determine the amount of memory that belongs to the buffer pool, take a look at the DBCC MEMORYSTATUS output. In the Buffer Pool section, look for the
Target value. The following shows partial output of DBCC MEMORYSTATUS output on idle server.