22nd ARRB Conference – Research into Practice, Canberra Australia, 2006
LONG TERM ROAD PERFORMANCE ESTIMATES AND
TREATMENT STRATEGIES IN TASMANIA
Tyrone Toole and Norbert Michel, ARRB Group, Australia
Barry Walker and Ian Booth, Roads and Transport Division,
Department of Infrastructure Energy and Resources, Tasmania,
Australia
ABSTRACT
Tasmania’s Department of Infrastructure, Energy and Resources (DIER) has recently produced its strategic road asset management plan and is developing its capability to employ the HDM-4 road investment tool to enhance existing pavement management systems.
As part of the input to the development of their strategic plan, DIER engaged ARRB to configure and calibrate HDM-4 and to apply it in a strategic analysis of long term budget needs and performance trends.
Whilst the outcome of the project was considered valuable, it was understood that certain aspects of the analysis were based on assumptions related to typical surfacing lives and the associated deterioration and works effects models.
In order to improve the basis for the analysis, further studies were undertaken to investigate:
• improved surface performance predictions and treatment strategies
• improved works effects models
• migration of the current HDM-4 V1.3 analyses to the newly released HDM-4 version 2.0
• the suitability of the asset valuation procedures in HDM-4 to assist DIER with conducting its annual valuations.
This paper describes the results of the studies and their implications for long term strategic planning of road assets in Tasmania.
INTRODUCTION
Background to the DIER/ARRB relationship
The Department of Infrastructure, Energy and Resources (DIER) first introduced the PIARC-owned Highway Development and Management tool HDM-4 (Kerali 2000) soon after its release and has used this and similar technology for a number of studies with the assistance of ARRB. A major road deterioration (RD) and works effects (WE) model calibration and subsequent application in a strategic analysis of the state road network was undertaken in 2003 (Toole et al. 2004, Michel et al. 2004a and 2004b). This study (Phases 1 & 2), provided a comprehensive performance-based calibration of the HDM-4 RD models which were subsequently applied in supporting the development of DIER’s Road Asset Management Strategy. It also helped establish a significant level of competency in HDM-4 amongst DIER’s asset management team. Whilst the latter study has helped DIER in achieving its objectives, both DIER and ARRB agreed that it was constrained by a dependency on scheduled resurfacing treatments. This arose because of the lack of consistent data to model surface cracking, and because other aspects of
surfacing performance, particularly skid resistance, had not been investigated in detail. Reliance on works effects models from neighbouring Victoria also meant that further room for improvement existed in the overall analysis framework which could affect long term outcomes. Furthermore, the size of the analyses being undertaken using HDM-4 can consume considerable resources in preparing input files and manipulating output data, and benefits could be gained from more efficient handling.
Consequently, in July 2004, DIER re-engaged ARRB (Phase 3) to help provide: • improved surface performance predictions and treatment strategies
• improved works effects models
• a full specification for (HDM-4 related) asset management tools.
However, rather than proceeding directly with delivering a set of fully operational tools, it was proposed that a provisional specification for the software be first developed and that this be considered within the context of an eventual migration to HDM-4 Version 2.0, which was advised for release in 2005/06.
Finally, in late 2005, as the HDM-4 V2.0 software was released, DIER again engaged ARRB (Phase 4) to help provide:
• a mechanism to migrate the Department from the currently configured HDM-4 V1.3 to the newly released HDM-4 V2.0 in early 2006
• a detailed investigation of the asset valuation techniques available to road network managers, including that which is currently supplied in HDM-4 V2.0.
This association between DIER and ARRB has progressed and strengthened steadily over the last three years and has resulted in a number of very detailed technical reports and processes which have facilitated the large scale network calibration of HDM-4 and a number of strategic level analyses of network funding needs and consequent pavement performance.
Scope of this paper
This paper provides an overview of the HDM-4 development and strategic application of the tool to supplement DIER’s local practices to achieve pavement preservation and other important objectives. It outlines the practices and techniques used to support the Strategic Asset Management Plan and work programming methodologies.
HDM-4 has been calibrated and configured for use in the strategic planning process to provide medium to long-term predictions of network performance and funding estimates for a range of different scenarios. High-level management strategies and optimum pavement maintenance programs have been developed within specified budget constraints. The objective was to identify pavement management investment strategies that:
• take road agency needs into account
• provide an objective analysis of funding needs
• strategically meet community needs.
DIER has developed a set of asset management procedures, program development rules and intervention criteria, based largely on the work carried out in the various phases described above, that supports this strategic investment.
ADAPTING AND CALIBRATING HDM-4 FOR TASMANIA
A high degree of reliability in the modelling process is required for pavement performance predictions and long term budget forecasts. It was considered very important, early in the development of the HDM-4 implementation, to incorporate locally derived values where feasible for the system configuration and performance models rather than utilising results of studies elsewhere or default system values.
The relationships for crack initiation, rutting and roughness progression were calibrated by employing time-series data from 80 pavement management sections chosen as being representative of the road network (Toole et al. 2004). The analysis stage was based on running a set of unique project analyses, using the HDM-4 analysis framework and software, on each of the identified calibration sites. An appropriate maintenance standard was applied to each of the sites, in accordance with road maintenance practices. The calibration of the HDM-4 road deterioration models was primarily focussed on roughness and rutting progression, as well as identifying the occurrence of crack initiation. Calibration sets were developed for each road category and applied in the strategic analysis.
It was found that the parameter values for rut depth progression were close to the HDM-4 default values of 1.0. Roughness progression parameters however, were almost 30% of the default values.
The analysis concluded that the calibration factors for road roughness were similar for each road class. While this outcome was somewhat unexpected, the annual increase in roughness was found to vary between road categories. The lowest categories of roads (Categories 4 and 5) were found to deteriorate at approximately three times the rate of high category roads (Category 1). This strong time-dependency, as opposed to traffic-dependency, is caused by the influence of drying and wetting cycles on thin pavements built on natural subgrades.
A further research project (Phase 3) was initiated (Toole et al. 2005) to better develop the calibration of the cracking models. Crack initiation and progression models were developed to better account for the variety of data collected using different methodologies ranging from visual assessment, e.g. the manual Rocond method (RTA, 1990) to automated digital capture, e.g. the RoadCrack system (Pratt and Ferguson 2004).
The calibration process is conducted by comparing HDM-4 predictions against the measured condition data history imported into a specifically designed calibration spreadsheet through an iterative process of adjusting key calibration factors within the HDM-4 models (Michel et al. 2004a). These are manipulated to reflect the pavement deterioration characteristics of the road section for which the condition history exists as demonstrated in Figure 0.1 below.
HDM-4 Sect. ID: A2069 (37) 2.48-3.61 Site 025.0
HDM-4 Sect. Name: South Arm Region S
Treatment Codes
Code Treatment
AC Dense Graded Asphalt ACO Open Graded Asphalt CONST Construction of a new road
FS Flush (spray) Seal PS Prime and Seal PR Primer Seal FS2 Two Coat Flush Seal RECON Reconstruction of road
SAM Strain Alleviating Membrane HP Digouts / Millouts
PMB Polymer Modified Binder Seal W/R Widen and/or realign STAB Stabilisation of pavement
MA Microasphalt (Slurry) Initial Conditions Cycle 1 Cycle 2 Treat Year 1995 Treat Type AC AC Pvmt AMGB AMGB SNP 2.478 2.478 CBR 10 10 AADT 2450 CV% 0.0% 0.0% Grwth% 4.0% 4.0% Class 5 5 YE4 274 IRIi 2.1 Rdi (mm) 2.5
New Calibration Factors
Cycle 1 Cycle 2 Kcia 1 Kcpa 0.7 Kgm 0.3 Kgp 0.3 Krid 0 Krst 1 Krpd 0
Predicted Ann. Roughness Prog.
Cycle 1 Cycle 2
IRI prog. 0.00 NRM prog. -1.26
Predicted Load ESAL (millions/ELANE)
Cycle 1 Cycle 2
YE4 0.04
Start Ch. End Ch. Date Comp. Treatment Description Cost
2.48 3.61 February-96 ACI Asphalt - interlayer 2.48 3.61 February-84 FS Flush (spray) Seal 2.48 3.61 February-69 FS Flush (spray) Seal
2.48 3.61 February-65 PS Prime and Seal
2.48 3.61 February-65 CONST construction of a new road on virgin ground
SITE025.0 Roughness History & HDM-4 Predictions
ACI 0 0.5 1 1.5 2 2.5 3
Dec-93 Dec-95 Dec-97 Dec-99 Dec-01 Dec-03
Roughne
ss (IR
I)
RIMSI History Cycle 1 Calibration Cycle 2 Calibration Treatments
SITE025.0 Rutting History & HDM-4 Predictions
ACI 0 2 4 6 8 10 12
Dec-93 Dec-95 Dec-97 Dec-99 Dec-01 Dec-03
M e an Rut D ept h ( m m)
RIMSI History Cycle 1 Calibration Cycle 2 Calibration Treatments
SITE025.0 Cracking History & HDM-4 Predictions
ACI 0 0.2 0.4 0.6 0.8 1 1.2 1.4
Dec-93 Dec-95 Dec-97 Dec-99 Dec-01 Dec-03
Cr a cki n g (% A rea)
RIMSI History Cycle 1 Calibration Cycle 2 Calibration Treatments
Figure 0.1: Example of spreadsheet used to calibrate key pavement distresses in HDM-4 with measured historical data
Pavement roughness, rutting and cracking were the three key road deterioration parameters that were targeted in the calibration process. These were chosen as they are the most important of the pavement performance parameters and interact in the modelling process; the logic being that cracks initiate, ruts accelerate and these combine to impact roughness. They are also the main triggers for treatment intervention, as well as being the most common data parameters collected.
PHASES 1 & 2 – HDM-4 STRATEGIC ANALYSIS
A strategic approach to infrastructure management
Strategic management of the road network in Tasmania must align with the long term vision and goals through the State Government’s Tasmania Together and more specifically Connecting Tasmania – Tasmanian Road Hierarchy and Targets.
Relevant strategies and plans developed to guide investment include:
• The Strategic Asset Management Plan
• Road Safety Strategy and Program
• Regional Integrated Transport Plans.
DIER has a Strategic Asset Management Plan (SAMP) that sets out the strategies for managing road and bridge assets to deliver the appropriate levels of service for each category of road. The SAMP considers high demand and technological drivers, including:
• significantly increasing heavy freight task
• increasing tourism and light freight demand
• demand for safer roads and environmental responsibility
• infrastructure technology and road use technology.
DIER is committed to the following key infrastructure management outcomes:
• the provision of a safe asset for all users
• a road network that enables the freight industry to operate in an efficient manner
• minimising future maintenance liability due to unsustainable maintenance practices
• minimising exposure to litigation due to nonfeasance
• ensuring maintenance practices are environmentally sustainable and meet all legislative requirements
• the continued development of a funding framework and rationale that will ensure levels of funding are sustainable.
HDM-4 strategic analysis of long term budget needs
The HDM-4 analyses undertaken for DIER explored a number of different case studies that were created to represent the following strategies:
i) DIER’s Pavement Management Strategy (DIER-PMS), which represents an analysis of the performance and budget requirements associated with implementing DIER’s guidelines on resurfacing and reinstatement and typical routine maintenance standards ii) Economic Strategy (ES), which is based on an analysis of alternative standards that aim
to maximise net economic benefits, or minimise total transport costs, and provide an alternative to DIER’s PMS solutions. The standards are primarily roughness-driven with
supplementary interventions for reseals based on surface age to maintain minimum surface texture and skid resistance requirements and to address surface cracking iii) Constant Intervention Limit (CIL), in which the cost and performance implications of the
roughness-based standards applied uniformly across the network were determined. These comprise a constant intervention limit of 4.2 IRI (110 NRM) to identify candidate treatment segments, with an absolute upper limit of 5.3 IRI (140 NRM). They do not differentiate on the basis of road class or traffic level and in this comparison all other interventions are based on the DIER treatment selection guidelines.
The results of the above analyses were also compared with those from a set of trial works program analyses, since the latter were considered to be a best estimate of the actual needs being based on physical segments, rather than an aggregated set of representative sections. The road network used for the strategic analyses comprised a set of 532 representative road sections that were formed by aggregating approximately 2500 individual PMS segments. The aggregation criteria comprised pavement type, road category and ranges of traffic, condition (in terms of IRI) and surface age.
The categorisation process involved the following parameters:
• surface class, comprising bituminous surface class only
• road class, comprising 4 classes, namely A representing Category 1 road, B representing Category 2, C representing Category 3 and D representing Categories 4 and 5
• speed flow type, comprising five types, namely single lane road, intermediate road, two lane road, two lane wide road and four lane road
• pavement type, comprising either STGB (surface treatment on granular base) or AMGB (asphalt mix on granular base)
• AADT, comprising seven traffic ranges from extremely low (AADT < 200) to extremely high (AADT >15,000)
• roughness, comprising seven roughness bands from extremely good (< 2.3 IRI (60 NRM)) to extremely bad (>6.9 IRI (160 NRM))
• surface age, comprising four categories representing four year age bands.
Strategic analysis results and outcomes
Total Annual Undiscounted Financial Costs 0.00 5.00 10.00 15.00 20.00 25.00 30.00 35.00 40.00 45.00 2004 2005 2006 2007 2008 2009 2010 2011 2012 2013 2014 2015 2016 2017 2018 Year A$ (millio n )
DIER SurfAge Strat New CC with PMS2-R DIER SurfAge Strat New CC with ES6 revised
Tasmania Strategic Network
Total Annual Undiscounted Financial Costs
0.00 10.00 20.00 30.00 40.00 50.00 60.00 70.00 80.00 2004 2005 2006 2007 2008 2009 2010 2011 2012 2013 2014 2015 2016 2017 2018 Year A $ (m ill io n )
DIER Constant Intervention Limit DIER PMS2-R Immediate
Tasmania Strategic Network
(a) Annual costs: DIER-PMS and ES (a) Annual costs: DIER-PMS and CIL
Total Cumulative Undiscounted Financial Costs
0.00 20.00 40.00 60.00 80.00 100.00 120.00 140.00 160.00 180.00 2004 2005 2006 2007 2008 2009 2010 2011 2012 2013 2014 2015 2016 2017 2018 Year A$ ( m illio n )
DIER SurfAge Strat New CC with PMS2-R DIER SurfAge Strat New CC with ES6 revised
Tasmania Strategic Network Total Cumulative Undiscounted Financial Costs
0.00 50.00 100.00 150.00 200.00 250.00 2004 2005 2006 2007 2008 2009 2010 2011 2012 2013 2014 2015 2016 2017 2018 Year A $ (m illio n )
DIER Constant Intervention Limit DIER PMS2-R Immediate
Tasmania Strategic Network
(b) Cumulative costs: DIER-PMS and ES (b) Cumulative costs: DIER-PMS and CIL
Annual Average Network Roughness
0.0 0.5 1.0 1.5 2.0 2.5 3.0 3.5 4.0 2004 2005 2006 2007 2008 2009 2010 2011 2012 2013 2014 2015 2016 2017 2018 Year IRI
DIER SurfAge Strat New CC with PMS2-R DIER SurfAge Strat New CC with ES6 revised
Tasmania Strategic Network
Annual Average Network Roughness
0.0 0.5 1.0 1.5 2.0 2.5 3.0 3.5 4.0 2004 2005 2006 2007 2008 2009 2010 2011 2012 2013 2014 2015 2016 2017 2018 Year IR I
DIER Constant Intervention Limit DIER PMS2-R Immediate
Tasmania Strategic Network
(c) Performance trends (length weighted annual average roughness): DIER-PMS and
ES
(c) Performance trends (length weighted annual average roughness): DIER-PMS and
CIL
Figure 0.1: Comparison of strategies: Undiscounted financial costs and performance trends
The results confirm that both the DIER-PMS and ES give similar results in terms of both undiscounted financial costs and overall performance on a network wide basis. CIL standards require almost 60% more financial resources with only a slight improvement in average performance. In each case, the differences in NPV terms were established to be marginal. The following fundamental issues/observations were noted throughout the project and require consideration in the overall context of road infrastructure management:
• DIER’s desire to offer safe, high friction surfaces to road users requires significant investment, and limits the possibility for budget reductions without substantially reducing levels of service.
• The outcome is clearly driven by the assumption that reseals for skid resistance are required at approximately 13 year intervals.
• Deterioration trends were shown to be relatively slow with minor need for major interventions over the next fifteen years. Consequently, average network roughness levels are shown to increase by some 0.8 IRI (22 NRM) over 15 years. The need for major interventions is expected to increase with time and a repeat of the analysis would be justified at periodic intervals, say every 5 years. This is also justified on the basis of likely changes in the freight task.
• Both the DIER Pavement Management Strategy and the Economics-based Strategy provided very similar results in terms of both budget needs and performance outcomes. The total budget requirement for periodic maintenance and reinstatement is approximately $150 million over fifteen years. Up to 80% of this budget is required for resurfacing needs. • Application of the Constant Intervention Level standards would require a 60% increase in
the total budget, this resulting from the use of common roughness-based intervention limits for all traffic levels. The average road condition shows a deteriorating trend for most classes of road, again reflecting the fact that the current state is substantially below intervention for the engineering strategies tested and below optimum economic intervention levels. However, the upper limits of roughness are generally lower and road users may be interested in benefiting from such a strategy although this might only be achieved through additional revenue or a redistribution of funds.
• Comparisons made between the strategy analyses described here and a trial program analysis performed by ARRB and DIER independently confirmed that the results were within approximately 15% of each other for the full analysis period, and almost identical for year 1 and years 1 – 5. This result helped provide confidence in the techniques used to prepare the strategy analysis and in the final outcomes.
• An examination of the effect of extending the resealing cycle to 16 years from the current 13 years identified potential road agency cost savings of approximately $15 million, or 30% of the predicted budget need for the 3 regions.
Finally, as noted earlier, crucial to any analysis outcome is the likely changes (or not) in the traffic composition, in particular the impact of heavy vehicles. Future estimates of damage are clearly less certain as the analysis period is lengthened, as they are based on extrapolating modelled trends to date. Thus a balance needs to be struck to prevent misuse of findings to date, as any changes between the actual and predicted funding estimates are magnified as the modelling period increases.
PHASE 3 – SURFACE PERFORMANCE AND WORKS EFFECTS
Development of the DIER annual resurfacing program
DIER develops its resurfacing program through a combination of:
• identifying sites, or PMS segments, by screening the data available in RIMSi against DIER’s treatment guidelines
• visual assessment and reports from regional field staff.
This information is used to draw up a long list of sites which are then inspected by senior personnel from which a short list of candidate sites is prepared.
Treatment selection rules
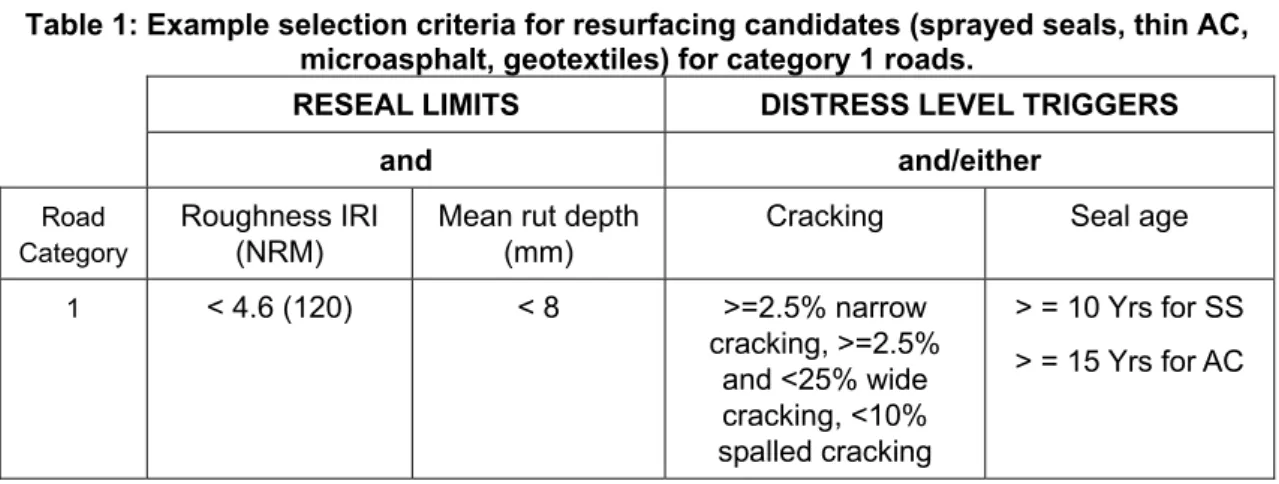
Resurfacing candidates are selected on the basis of reseal limits which comprise:
• upper values of rutting and roughness for each road category and specific distress level triggers based on cracking or seal age as summarised in Table 1.
The rules are initially applied to data for each pavement management segment, which represents homogeneous lengths of road with a common history, traffic and other features. They are the basic unit for pavement analysis at a network level.
Table 1: Example selection criteria for resurfacing candidates (sprayed seals, thin AC, microasphalt, geotextiles) for category 1 roads.
RESEAL LIMITS DISTRESS LEVEL TRIGGERS
and and/either Road
Category
Roughness IRI (NRM)
Mean rut depth (mm)
Cracking Seal age
1 < 4.6 (120) < 8 >=2.5% narrow cracking, >=2.5% and <25% wide cracking, <10% spalled cracking > = 10 Yrs for SS > = 15 Yrs for AC
By identifying candidates for treatment, the treatment rules may be considered as DIER’s desirable intervention guidelines, and are referred to as the DIER Pavement Management Strategy. These candidate sites are selected through an initial data screening process. Thorough site inspections are then carried out to verify the suitability of the selected sites.
Implied surfacing lives
An analysis of ‘implied’ surfacing lives, meaning that the selected candidate sites are truly representative of a rational needs based program, can provide the basis for planning and budgeting purposes even in circumstances where forward predictions are modelled using tools such as HDM-4.
This is because no single method of estimating needs will be ‘correct’ due to the many factors that affect surfacing performance, and the fact that multiple distresses may occur together which complicates the planning process. Differences also occur in practice between expert opinion and the level of analysis performed in tools such as RIMSi and HDM-4. The need for an ‘expert-eye’ is in fact well accepted amongst road authorities as adding considerable value. The data relating to the 2004 candidate reseal program has therefore been evaluated on the basis that it will help establish the principal factors affecting surfacing lives. The following observations have been drawn from the available data:
• The median surfacing life was estimated as being approximately 15 years, with bituminous surface dressings (termed ‘flush seals’) possessing a median life of 15 years, and asphaltic concrete surfacings a median life of approximately 16.5 years. This is some two years greater than assumed in earlier HDM-4 analysis and would tend to reduce the resurfacing budget component.
• Sites located in the North West and South have median lives of slightly less than 15 years, whereas the North East sites have a median life of 16 years.
• The median lives of road surfacings based on stone type ranged from 12 to 18 years. Dolerites and basalts possessed the shortest lives (13 years) followed by conglomerates (15 years) and river wash gravels (18 years). The latter aggregates, which are derived from quartzites, are also more abundant in the west of the State. (Note: Shingles were removed from the analysis due to the small sample size).
The finding that aged or cracked surfacings are identified as being approximately 18 years old is some 6 years less than that estimated from applying the latest version of the ‘ARRB oxidation model’ (Oliver, 2005), therefore it is clear that current lives are a result of a combination of distress factors. It is likely therefore that use of a single year’s data provides a censored dataset, and consideration of an alternative method of estimating average lives is necessary.
Improved prediction of surfacing lives
In addition to the analysis of surfacing lives based on the proposed DIER resurfacing program and earlier data, the study was expected to produce improved models for predicting surfacing life within the HDM-4 tool. The aim is to apply a set of condition responsive based interventions for planning purposes, which for pavement surfacing distress may include -
• pavement cracking
• skid resistance and surface texture.
However, the ability to model future conditions requires the main factors which affect changes in measured condition to be clearly identified, with the aim being to provide a quantitative basis for budget estimates, priorities and potential benefits of alternative investment strategies. The approach then must take account of whether the available data contains sufficiently clear trends or patterns to establish useful relationships, and whether these can be applied to produce meaningful results.
Improvements in the ability to predict surfacing lives for maintenance planning purposes was investigated using available data on pavement cracking which required:
• transforming time-series cracking data available from successive surveys undertaken on the HDM-4 calibration sites, and a number of additional sites, to a standard HDM-4 equivalent measure
• using the transformed data as a basis for calibrating the HDM-4 models for all cracking.
Correlation between cracking assessment methods and conversion of
time series trends
The calibration of the HDM-4 cracking model required a field study to be undertaken to examine the correlation between the various methods used by DIER to collect cracking data and a reference method which aims to produce HDM-4 equivalent values for ‘all cracking’, defined as cracks > 1mm in width, and ‘wide cracking’, defined as cracks > 3 mm width or spalled.
As noted in Table 2, the methods used by DIER have varied and therefore the need was to establish a set of relationships between a selection of these methods and the ‘HDM-4 method’.
Table 2: Crack assessment methods employed by DIER
Year Method
1998 and pre-1998 Rocond (RTA)
1999, 2000 and 2002 Modified Rocond90 (windscreen method)
2001 RoadCrack (2 channel)
2004 Roadcrack (4 channel)
In order to establish a set of relationships, a field study was undertaken in December 2004 in which a number of 100 m sections were assessed on foot using a HDM-4 method and the original Rocond method.
The ‘Modified Rocond90’ method which employs a windscreen survey was not investigated directly. However, the results of work reported by ARRB has demonstrated that a considerable proportion of the total amount of cracking (typically 75%) is not observed using such methods, and that it is mainly spalled cracks and the most severe cracked areas which are identifiable. Consequently, such data is not ideally suited for calibration purposes, although it may be valuable for identifying defective sections.
The 2-channel RoadCrack data was not used because it selects only a portion of the lane and a conversion study was not performed using this apparatus.
Therefore, for the purposes of this investigation, the historical data which was considered most valuable was the 1998 and pre-1998 Rocond data and the 2004 RoadCrack data.
Correlation between Rocond and HDM-4
The correlation between Rocond and HDM-4 was made by comparing ratings made on a number of the sections using both methods, and by considering the fundamental basis of each method. From this, the following conclusions were drawn –
• the extent of cracking reported by Rocond is identical to that of HDM-4, as it aims to record the damaged area
• whilst not identical, the severity classification overlaps substantially and can be compared as follows -
Rocond HDM-4 Slight (S) (< 2 mm) Narrow Cracking Moderate (M) (2 mm – 5 mm) Wide Cracking
Extreme (X) (> 5 mm) Spalled Cracks
• although the extent of cracking by both methods is similar, the Rocond method classifies the extent in terms of single integers which when combined with the severity rating may be interpreted as shown in the following example
Rocond HDM-4 S0 – Slight cracking with extent < 1% 0.5 % narrow
cracking S1 – Slight cracking with extent 1 – 5% 2.5% narrow cracking S2 – Slight cracking with extent 5 – 15% 10% narrow cracking S3 – Slight cracking with extent > 15% 25% narrow cracking
Consequently, a general conversion has been developed as a means of computing equivalent HDM-4 values from Rocond readings.
Thus, in terms of the two HDM-4 cracking parameters, all (ACA) and wide cracking (ACW), the following definitions apply –
• ACA is the sum of the areas of all recorded cracking, namely narrow, wide and spalled
• ACW is the sum of the areas of wide and spalled cracks.
Correlation between HDM-4 and 4-channel RoadCrack
A correlation between HDM-4 and the 4-channel RoadCrack device used in 2004 was established through a field exercise in which the HDM-4 procedure was applied to 40 sections of road whose distress varied from no visible cracks to an extent of 55% of the surface area affected.
All categories of roads were covered in the exercise. The sections were all located in the Hobart area for logistical convenience.
The results are shown in Figure 0.1, where a strong correlation between the two measurement procedures is evident. HDM-4 Cracking v RoadCrack y = 0.0038x2 + 1.1954x R2 = 0.7582 0.00 10.00 20.00 30.00 40.00 50.00 60.00 0.00 10.00 20.00 30.00 40.00
RoadCrack (% Cracked Frames)
H D M -4 (% Vi si b le C rack in g ) HDM-4 v RoadCrack Poly. (HDM-4 v RoadCrack)
Figure 0.1: Relationship between RoadCrack and HDM-4 crack assessment methods
General observations
Whilst the relationship shown in the above figure is recommended for use, various observations and comments relevant to the correlation are noted below.
• Inspection of Sites with a high Channel D (particularly longitudinal cracking) reading for RoadCrack were usually related to a narrow lane width leading to the white line
(probable) or seal joint being identified as a crack.
• Whilst the above was considered to be generally true, on sites located on the Southern Outlet road high Channel D values were obtained despite a 3m+ lane width. The white line in this case was also discontinuous, which adds to the confusion behind these results. Further inspections of a greater number of sites are necessary to gain a larger sample size of longitudinal cracking in error.
• More stringent quality control on acceptance of data from RoadCrack which flags any data discrepancies is required to limit errors. It might also be possible to flag any
potential problems during collection which may show when centrelines (or any lines) are crossed. This also raises another interesting issue of when Roadcrack crosses
intersections etc where it would inevitably come in contact with more reflective line marking
• The most predominant mode of cracking detected during visual inspections was crocodile cracking.
• Visually determined class 1 cracks (1mm and below) should be considered when establishing a relationship between RoadCrack and manual methods as maintenance treatments are usually planned in response to any visible cracking. Clearly distinguishing the class of cracks should however involve use of a ‘Go/No Go’ Gauge (or feeler gauge) if a high degree of consistency is required (see Austroads (2005) draft cracking guidelines).
• If the visual observations made for the edge and centre areas of the pavement are removed from the data when determining a relationship, the coefficient of determination improves. However, the aim is to estimate the repair quantity, therefore it is advised that any RoadCrack readings should always be correlated with a full-width manual
assessment.
Calibration of HDM-4 cracking models
Having established a basis for converting available cracking data to a reference method, the available data for over 40 of the long term deterioration sites was employed as a means of calibrating the HDM-4 relationships for all cracking. The results confirmed that a wide range of calibration factors exists for both crack initiation (Kcia), ranging from 0.5 to 2 or more, and crack progression (Kcpa), ranging from approximately 0.1 to more than two.
The results were then examined by considering a number of general factors which are not directly modelled, but which may affect the value of the calibration factors applied in particular practical situations. The factors examined included road category, ‘old’ road class, deterioration cycle, pavement type and regional location.
Based on the scope of the database and the size of the sample related to the general factors, separate calibration factors are recommended to be applied on the basis of pavement type as follows –
Pavement Type Crack initiation Crack progression
Asphalt mix on granular base 1.3 0.8
Surface treatment on granular
base 1.1 0.3
Whilst recognising the variable performance of the road surfacings, the results provide a quantitative basis for performance estimates to supplement the age-based estimates used in earlier analysis.
Description and specification of works standards
This section describes the range of treatments commonly applied by DIER. The detailed investigation conducted identified numerous equation formats and coefficients used to estimate the effect of pavement works in previous studies. The effects of different treatments were then compared to those derived from previous studies initiated by DIER.
Treatment types
DIER, depending on road conditions, applies the following list of treatments to repair pavement defects:
• routine pavement maintenance
• sprayed seal (texture)
• sprayed seal (cracking)
• thin asphalt surfacing/overlay
• structural asphalt overlay
• stabilisation
• granular overlay - (no widening required)
• granular overlay - (widening required).
Effect of works on post-treatment conditions
The effect of works on post-treatment conditions is critical to any analysis. The most critical relationship is that between roughness before treatment (RIb) and roughness after treatment (RIa). Within HDM-4, the relationships can be specified in the form of an equation, termed the derived method, or as a user-specified after works condition. The former is preferable as it has general application, whereas the latter is only applicable where a fixed after works condition can be expected, as in the case of new construction.
A number of rules were used in the analyses conducted in Phases 1 and 2 of the HDM-4 study for determining the resets to roughness values after works. These rules varied by road class, treatment type etc. The following comments are relevant:
• Finished standards differ for each road category and treatment.
• For both rutting and roughness the post works values for structural overlays (thickness 80 mm), stabilisation and granular overlays were reduced to a constant post works value.
• For reseals the post works rut depth and IRI were determined using HDM-4 default relationships.
• For thin overlays the HDM-4 default model was used to reset the rut depth, and the roughness reset is based on the HDM-4 generalised bi-linear overlay effects relationship. The coefficients were based on studies conducted in Victoria (ARRB 2003a).
• Initial surface texture and skid resistance values differed for reseals and asphalt surfacings.
Analysis data and information sources utilised
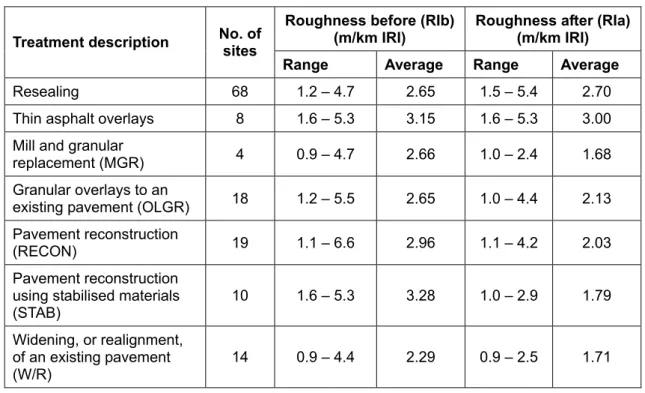
This study (Phase 3) examined the effect of works on re-setting the pavement roughness after treatment. It included the treatments listed in Table 3, which also contains a summary of the scope of the data.
Table 3: Scope of the works effects data Roughness before (RIb)
(m/km IRI) Roughness after (RIa)(m/km IRI)
Treatment description No. of sites
Range Average Range Average
Resealing 68 1.2 – 4.7 2.65 1.5 – 5.4 2.70
Thin asphalt overlays 8 1.6 – 5.3 3.15 1.6 – 5.3 3.00 Mill and granular
replacement (MGR) 4 0.9 – 4.7 2.66 1.0 – 2.4 1.68
Granular overlays to an
existing pavement (OLGR) 18 1.2 – 5.5 2.65 1.0 – 4.4 2.13 Pavement reconstruction
(RECON) 19 1.1 – 6.6 2.96 1.1 – 4.2 2.03
Pavement reconstruction using stabilised materials
(STAB) 10 1.6 – 5.3 3.28 1.0 – 2.9 1.79
Widening, or realignment, of an existing pavement (W/R)
14 0.9 – 4.4 2.29 0.9 – 2.5 1.71
The information used comprised data drawn from DIER’s own RIMSi covering works that were undertaken in the period since 1997. The resurfacing data is predominantly taken from the 2001 surfacing program (mainly reseals). The data had previously been assembled by DIER in an internal study (Williams, 2004).
The results are compared with data obtained from the results of DIER’s own internal studies (Haertel, 1993 and Williams, 2004). This allows an element of benchmarking and illustration of the various factors and findings identified in earlier studies.
Findings of the study
The data was examined firstly in scatter plots. Simple linear regression relationships were developed for each set of data. Grouping of results then took place where this seemed appropriate in terms of the future application of the information.
These relationships are simple in form and do not contain any explanatory independent variables other than the roughness before treatment, RIb. This is because of the lack of variation in thickness data or the absence of any information on thickness.
The findings can be summarised as follows:
1. Reseals – There is no post works effect on roughness.
2. Thin overlays – There is little or no effect on roughness, although findings from other
States, particularly for urban situations, and from overseas experience suggest a potential for a significant reduction. The results have therefore been classified as being
inconclusive at this stage.
3. Major treatments (except granular overlays) – A significant reduction in roughness
was demonstrated. However, the results for granular overlays are considered inconclusive and require further investigation.
4. Road category – Road category was not identified as a significant factor, with the full
considering the way in which the network is structured and the way road categories have been defined on this mature road network.
Comparison with previous DIER studies
DIER has conducted two previous studies of works effects, the first in 1993 (Haertel, 1993) and more recently in 2004 (Williams, 2004). The latter study was also the source of the majority of data analysed in this study, and therefore the results should be comparable, barring any corrections identified through the data assembly and review process.
In the two earlier studies, the data was examined to determine typical improvements (in absolute and % terms), whereas in this study the analysis was extended to generate statistical relationships in a form that could be applied within HDM-4.
The resulting improvements in roughness determined from a simple analysis of average improvements for each class of treatment is shown in Table 4 for each of the studies.
Table 4: Improvement in roughness following treatment
From the above, the following observations have been drawn:
1. Reseals – Little or no measurable improvement was identified in the later work, although
a modest improvement amounting to 6% was identified in 1993. The difference is small and is likely to be a result of preparatory works.
2. Asphalt surfacing (or thin overlays) – The results of the 1993 study and this study are
similar, but, somewhat surprisingly, the 2004 study results are considerably different although they are reportedly based on the same data set as this study. No obvious explanation is available.
3. Mill and granular overlay – The 2004 results show a greater improvement (almost
double) that obtained in this study. This treatment was not evaluated in 1993.
4. Granular overlay – The 2004 results show a greater improvement (almost double) that
obtained in this study. Differences are not easily explained. This treatment was not evaluated in 1993.
5. Reconstruction – Improvements from all three studies are relatively similar, with a
marginally better result having been obtained in 1993.
6. Stabilisation: This was evaluated in the later studies only, and produced similar results.
This study Williams (2004) Haertel (1993)
Treatment (see Table 4.1 for
full description) IRI % IRI % IRI %
Reseal 0 0 0 0 0.10 6 Asphalt surfacing 0.15 5 0.97 25 0.18 9 MGR 0.98 37 2.20 53 - - OLGR 0.52 19 1.06 31 - - RECON 0.93 31 1.11 36 1.44 40 STAB 1.49 45 1.36 33 - - W/R 0.58 25 0.10 6 - -
7. Widening or realignment – This was evaluated in the later studies only. Results differ, with this study suggesting a greater improvement.
8. New construction – Average reported values for the 2004 and 1993 studies are 1.66 IRI
and 1.74 IRI respectively. Values below 1.5 IRI were achieved for Category 1 roads, whereas higher values of approximately 2 IRI apply to other road categories. No results were reported from this study.
Finally, as a general rule, the results from this study have been selected as the most relevant for future application. This is because the data received more careful preparation by DIER to ensure the reporting of before and after treatment measurements represented the same sections of road, this having been identified as a potential source of error during data preparation.
PHASE 4 – MIGRATION TO V2.0 AND ASSET VALUATION
Migration to HDM-4 V2.0
The latest phase of the work undertaken between DIER and ARRB has involved the migration of DIER’s current HDM-4 version 1.3 analysis system to the newly released HDM-4 version 2. There are a number of changes that have occurred to the HDM-4 database and interface structure, additional functionality and modelling capability, hence the main tasks to be carried out are notably:
• restructuring of the road network file and the incorporation of multiple separate calibration sets, including any modifications implied from the research studies carried out in 2004/05 regarding seal life, and any internal changes to the HDM models
• redesigned works standards interface, which also allows DIER to modify earlier intervention standards given the greater flexibility now available in the system, and incorporation of latest findings on works effects
• restructuring of traffic data inputs, through incorporation in the road network file
• specification of traffic growth sets
• extension of program/strategy analysis to include the automatic analysis of multiple budget constraints
• ability to value road assets within the tool directly using user selected rules (see below). In tackling the above, DIER and ARRB have collaborated to migrate the 2003/04 strategic analysis and associated files, using an intermediate spreadsheet where appropriate. The strategic analysis was then re-run to validate the migration, and the net result was very similar.
Exploring the feasibility of implementation of an asset valuation
methodology
This explored DIER’s need to address the valuation of pavement assets, including surfacing, with a stated preference to use the new HDM-4 version 2 functionality, most other elements being addressed satisfactorily by the Department. The resulting output of this task was expected to be a paper defining and exploring the feasibility of applying HDM-4 to this task and identifying the types of outputs etc. that would aid DIER in their yearly evaluation process. For road pavement assets, the range of best practice approaches are listed below, and are available at the HDM-4 user interface, from which choices will need to be made.
1. straight-line depreciation 2. production-based depreciation
3. condition-based depreciation.
With the release of HDM-4 V2.0, the software uses methods (2) and (3) above, noting that pavement structural layers and surfacing layers are analysed and reported as a single element. At present though, it has been established that it may be beneficial to value the layers separately, and therefore such an alternative has been presented to the HDMGlobal technical team for implementation in a future update to version 2.
Finally, reporting of this component of the study provided:
• guidance on the configuration of HDM-4 version 2 to value road pavement assets, incorporating DIER’s PMS network file?
• a comparison of the current in-built method with a proposed method based on Austoads recommendations splitting the structural and surface elements, including a trial analysis using the 2003/04 HDM-4 data base
• recommendations and appropriate set up within HDM-4 version 2
• recommendations on the use of asset valuation data in association with other work program and net benefit calculations in guiding asset management decisions.
CONCLUSIONS
The main findings of the study are as follows:
Road deterioration calibration factors and rates
Calibration factors have been determined based on sites distributed throughout Tasmania which span a range of road categories, traffic levels and condition states considered representative of the DIER’s network. Calibration sets were developed for each road category and applied in the strategic analysis. The parameter values for crack initiation and rut depth progression were close to the default values. Roughness progression parameters were almost 30% of the default values.
Outcome of the strategy analysis
Deterioration trends were shown to be relatively slow with little need for major interventions over the next fifteen years. Consequently, average roughness levels would increase by some 0.8 m/km IRI over 15 years. The need for major interventions is expected to increase with time and a repeat of the analysis would be justified at periodic intervals, say every 5 years. Both the DIER PMS and ES strategies provided very similar results in terms of both budget needs and performance outcomes. The total budget requirement for periodic maintenance and reinstatement is approximately $150 million over fifteen years. Up to 80% of this budget is required for reseals applied at 13 year intervals to maintain minimum skid resistance levels and to address cracking and other age-related distresses.
Implied surfacing lives
Based on an analysis of candidate resurfacing sites, the overall median life of bituminous surface treatments was found to be 15 years. The median life of Asphalt surfacings was 16.5 years.
Effect of failure mode
Where surfacings were not replaced for other reasons, aged or cracked surfacings were found to possess a median life of 18 years. This is some six years less than the median value (24
years) estimated using the ARRB oxidation model based on sites distributed throughout Tasmania, therefore it is clear that current lives are a result of a combination of distress factors.
Correlation between crack assessment methods
A transformation procedure was established through field studies between the manual Rocond90 system and the HDM-4 method chosen as the reference method.
A statistical relationship was established between the output of the 4-channel RoadCrack automated crack detection system used by DIER and the HDM-4 method. This provides a basis for using the high-quality data available from RoadCrack in a consistent manner, although care is required to ensure reading anomalies emanating from the crack detection process are identified as part of a pre-processing and quality assurance phase.
The results were then applied in determining appropriate HDM-4 calibration factors for the initiation and progression of structural cracking.
Adaptation of HDM-4 version 2
The final phase of the project demonstrated the effective conversion of HDM-4 version 1.3 files to version 2, and their application in strategy analysis and asset valuation. The strategy analysis provided comparable results with earlier work. Experience gained applying the asset valuation functionality confirmed the performance of the system, and has led to proposals for an alternative (third) methodology to be incorporated in a future release of the software.
REFERENCES
ARRB (2003a). Improved HDM-4 model calibration factors and application guidelines for sealed roads in Victoria. Final Project Report. Part 1: Project Implementation and Results of Road Deterioration and Works Effects Studies. ARRB Contract Report RC2464-2. ARRB Transport Research Ltd, Vermont South, Victoria, Australia
AUSTROADS/AAPA (2003). Guide to the selection of road surfacings. Revised edition. Austroads and Australian Asphalt Paving Association. Sydney.
Haertel, E (1993). Roughness of new work. Internal Report. Department of Transport and Works, Hobart, Tasmania.
Kerali, H R (2000). Overview of HDM-4. HDM-4 Documentation Series, Volume 1. PIARC, Paris.
Michel, N, R Roper and T Toole (2004a). Implementation of HDM-4 in DIER, Tasmania: Calibration processes for sealed roads. ARRB Contract Report RC3296-2. ARRB TR: Vermont South, Victoria, Australia.
Michel, N, R Roper and T Toole (2004b). Implementation of HDM-4 in DIER, Tasmania: Technical applications framework and tools for strategic analysis. ARRB Contract Report RC3296-3. ARRB TR: Vermont South, Victoria, Australia.
Oliver, J W H (2005). Improved distress-viscosity model for reseal intervention. Draft Austroads Report. ARRB Group Ltd: Vermont South, Victoria, Australia.
PRATT, D N and R A FERGUSON (2004). Simultaneous collection of pavement condition parameters by automated means for road asset management. Proceedings of the Sixth International Conference on Managing Pavements, Brisbane, October, 2004.
RTA (1990). Rocond 90 – Road Condition Manual. Roads and Traffic Authority, New South Wales.
Toole, T, N Michel and R Roper (2004). Implementation of HDM-4 in DIER, Tasmania: Project Summary and Results of Strategy Analysis. ARRB Contract Report RC3296-1. ARRB TR: Vermont South, Victoria, Australia.
Toole, T, N Michel and M George (2005). Consolidation of HDM-4 Applications in Tasmania (Phase 3) - Part 1: Improved performance predictions and treatment strategies for road surfacings. ARRB Contract Report RC3809-1. ARRB TR: Vermont South, Victoria, Australia. VICROADS and RTA (1995). Guide for the measurement and interpretation of skid resistance using SCRIM. VicRoads, Victoria and Roads and Traffic Authority, New South Wales.
Williams, M (2004). Works effects resulting from pavement works. Internal Report. Department of Infrastructure, Energy and Resources, Hobart, Tasmania.
AUTHOR BIOGRAPHIES
Tyrone Toole – Chief Consultant, Asset Management, ARRB Group. Tyrone has over 25 years
experience in a wide range of highway engineering and management projects, and in institutional development and training in over 20 countries. He has specific experience in research and the provision of advice in the management and design of low and high volume roads in developed, developing and emerging countries.
Having joined ARRB in 2001, he continues to contribute as a leading international expert on the development of road management guidelines, carrying out and guiding studies in numerous countries. He has lead ARRB’s contribution to training and dissemination of HDM 4 and undertaken studies in road asset management and performance for Australian road authorities and internationally.
Norbert Michel has a Bachelor of Science and a Bachelor of Civil Engineering from Monash
University. In 2000, he joined the Asset Management team at ARRB as a Research Engineer. He is now Senior Asset Engineer responsible for the coordination and development of ARRB’s in-house tools and commercial software solutions. He has extensive experience in developing, using and calibrating the ARRB PLCC Model, PLATO, HDM-4 and developed a Local Road Management System (developed for Indonesia) to evaluate pavement performance and network needs. He has used @Risk and Evolver to determine the uncertainty associated with these tools. He has contributed to projects across asset management, transport economics and traffic & safety.
Barry Walker – Manager, Asset Management, Roads and Transport Division, Department of
Infrastructure Energy and Resources, Tasmania
Ian Booth – Senior Technical Officer, Asset Management, Roads and Transport Division,