The H
I
mass function of group galaxies in the ALFALFA survey
Michael G. Jones ,
1‹Kelley M. Hess,
2,3‹Elizabeth A. K. Adams
2,3and Lourdes Verdes-Montenegro
11Instituto de Astrof´ısica de Andaluc´ıa (CSIC), Glorieta de la Astronom´ıa s/n, E-18008 Granada, Spain
2Kapteyn Astronomical Institute, University of Groningen, Landleven 12, NL-9747AD Groningen, the Netherlands 3ASTRON, the Netherlands Institute for Radio Astronomy, Postbus 2, NL-7900AA Dwingeloo, the Netherlands
Accepted 2020 March 17. Received 2020 March 17; in original form 2019 October 9
A B S T R A C T
We estimate the HI mass function (HIMF) of galaxies in groups based on thousands of ALFALFA (Arecibo Legacy Fast ALFA survey) HIdetections within the galaxy groups of four widely used SDSS (Sloan Digital Sky Survey) group catalogues. Although differences between the catalogues mean that there is no one definitive group galaxy HIMF, in general we find that the low-mass slope is flat, in agreement with studies based on small samples of individual groups, and that the ‘knee’ mass is slightly higher than that of the global HIMF of the full ALFALFA sample. We find that the observed fraction of ALFALFA galaxies in groups is approximately 22 per cent. These group galaxies were removed from the full ALFALFA source catalogue to calculate the field HIMF using the remaining galaxies. Comparison between the field and group HIMFs reveals that group galaxies make only a small contribution to the global HIMF as most ALFALFA galaxies are in the field, but beyond the HIMF ‘knee’ group galaxies dominate. Finally, we attempt to separate the group galaxy HIMF into bins of group halo mass, but find that too few low-mass galaxies are detected in the most massive groups to tightly constrain the slope, owing to the rarity of such groups in the nearby Universe where low-mass galaxies are detectable with existing HIsurveys.
Key words: galaxies: groups: general – galaxies: luminosity function, mass function – radio lines: galaxies.
1 I N T R O D U C T I O N
Over the past few decades, the HIMF (HImass function; the number
density of galaxies in the Universe as a function of their HImass)
has gone from being highly uncertain to well known, at least in the
nearby Universe, due mostly to the two largest blind HIsurveys to
date, HIPASS (HIParkes All Sky Survey; Barnes et al.2001; Meyer
et al.2004) and ALFALFA (Arecibo Legacy Fast ALFA survey;
Giovanelli et al.2005; Haynes et al.2011,2018). Hence, the most
recent studies of the HIMF have focused on its potential variation
with environment (Moorman et al.2014; Jones et al.2016,2018;
Said, Kraan-Korteweg & Staveley-Smith2019) and have begun to
push the measurement domain beyond z≈ 0 (Hoppmann et al.
2015).
In addition to blind measurements of the HIMF over wide fields
(Zwaan et al.1997; Rosenberg & Schneider 2002; Zwaan et al.
2003, 2005; Martin et al. 2010; Jones et al. 2018; Said et al.
2019), there have been a number of measurements of the HIMF
in specific galaxy groups (Verheijen et al.2001; Kovac, Oosterloo
E-mail:mjones@iaa.es(MGJ);hess@astro.rug.nl(KMH)
& van der Hulst 2005; Freeland, Stilp & Wilcots2009; Kilborn
et al.2009; Stierwalt et al.2009; Davies et al.2011; Pisano et al.
2011; Westmeier et al.2017). While the former have shown that the
HIMF in the local Universe follows a Schechter function (Schechter
1976) shape (a declining power law with increasing HImass that
is truncated by an exponential decay at the ‘knee’ mass) with a
low-mass slope parameter,α, of approximately−1.3 and a ‘knee’
mass just below 1010M
, the latter studies have almost universally
found the low-mass slope in galaxy groups to be flat (α≈ −1) down
to about logMHI/M∼7. However, these samples have typically
consisted of 1–20 groups containing a total of 30–300 HIdetections,
compared to the many thousands of detections in blind, wide-field surveys.
There is now a considerable body of evidence, both from
simulations (Bah´e & McCarthy2015; Marasco et al.2016; Jung
et al.2018) and observations (Hess & Wilcots2013; D´enes et al.
2016; Jaff´e et al.2016; Odekon et al.2016; Brown et al.2017),
indicating that galaxies are ‘pre-processed’ in groups, depleting
their HIcontent and suppressing their star formation rate, before
they fall into clusters. Hence, the difference between the HIMF found in groups and in wide-field surveys is not entirely unexpected
as the HI-rich galaxies typically detected by blind 21 cm surveys
2020 The Author(s)
are mostly thought to be field galaxies in their own distinct haloes
(e.g. Guo et al.2017), whereas most galaxies in groups are, by
definition, satellites. However, it is somewhat intriguing that no conclusive evidence for a flattening slope going from low to higher
density environments has been found (e.g. Moorman et al.2014;
Jones et al.2016).1Furthermore, there are a few groups that do not
fit the apparent trend of the other studies and have been found to have low-mass slopes even steeper than the global measurements
in HIPASS and ALFALFA (Stierwalt et al. 2009; Davies et al.
2011).
There appear to be two possible resolutions to these potentially conflicting results: (1) that the environment metrics used to study environmental dependence of the HIMF in wide-field surveys, did not adequately separate group and cluster environments from the field population, thereby preventing any shift in the low-mass slope from being detected, or (2) that there is a methodological inconsistency in how the wide-field survey HIMFs and those of
individual groups were calculated, and the difference in α is
not actually as large as has been reported. One potential source of inconsistency between group and field HIMFs could be that ALFALFA and HIPASS are both surveys conducted with single dish telescopes, whereas most group HIMFs have been measured using interferometric observations of individual groups. Though unlikely, this raises the possibility of differences in the completeness corrections used, for example because interferometers suffer from surface brightness sensitivity limitations, but for both Parkes and Arecibo the vast majority of galaxies are point-like when observed at 21 cm, resulting in a simpler sensitivity limit. On the other hand, there are also reasons to suspect the first potential resolution. While the void-wall and nearest neighbour environment metrics
used by Moorman et al. (2014) and Jones et al. (2016) were
shown to separate regions of different galaxy environments on relatively large scales, it is not necessarily the case that groups would be concentrated in one region of the metrics’ parameter space.
In this paper, we aim to resolve this tension by using the ALFALFA source catalogue to calculate the average group galaxy HIMF based on the many groups contained in the ALFALFA survey volume. This approach sidesteps both of the issues discussed above, as the data set was observed with a single dish and by matching ALFALFA detections to optical group catalogues we can also avoid complications with more general environment metrics. In addition, this approach results in a group galaxy sample of thousands, rather than tens or hundreds, meaning that the resulting group galaxy HIMF is one of the most robust measurement to date.
Section 2briefly outlines the ALFALFA survey and Section 3 presents the four different group catalogues that we use. Section 4 describes our approach to calculating the HIMF for this data set, our results are presented and discussed in Section 5, and finally
we conclude in Section 7. Throughout this paper, we assumeH0=
70 km s−1Mpc−1and that the absolute magnitude of the Sun is 4.67
in therband. Distances are approximated asczcmb/H0.
1We note here that Said et al. (2019) did recently find such a trend in the HIZOA (HIZone Of Avoidance) survey (Staveley-Smith et al.2016), but they used HIneighbours to define environment and it is unclear how well this correlates with the local galaxy or total mass density. In addition, Zwaan et al. (2005) used a similar metric but found the opposite trend. More work is needed to fully understand these results.
2 T H E A L FA L FA S U RV E Y
The ALFALFA survey (Giovanelli et al.2005) is a blind 21 cm radio
survey covering approximately 6900 deg2of sky out to a maximum
redshift of 0.06. The survey was conducted over about 4500 h of observing time with the 305 m Arecibo telescope in Puerto Rico. It followed a double-pass drift scan observing strategy using the seven beam ALFA (Arecibo L-band Feed Array) instrument, covering the
survey area in equally spaced declination strips. The final HIsource
catalogue (Haynes et al.2018) contains over 30 000 extragalactic
HIsources, 25 434 of which are classified as ‘code 1’, meaning they
are high signal-to-noise detections with extremely high reliabilities
and a well-defined completeness limit (Haynes et al.2011,2018).
The survey area is split into two continuous regions, one in the
Northern Spring sky (approximately 7.5 h<RA<16.5 h) and one
in the Fall sky (approximately 22 h<RA<3 h), both range from 0◦
to+36◦in declination. As the group catalogues that we will make
use of are based on SDSS spectroscopic galaxy catalogues, there is only appreciable overlap with ALFALFA in the Spring portion of the survey. It is therefore the code 1 sources in the Northern Spring sky that we will use throughout this paper to make all our estimates of the group galaxy HIMF.
For any measurement of the HIMF, a key quantity for each galaxy
is its HImass. To estimate the HImass, we use the standard
expression MHI
M =2.356×10
5
DMpc2 S21, (1)
where DMpc is the distance to the galaxy in Mpc andS21 is its
integrated flux in Jy km s−1. In this case, we do not adopt the
ALFALFA distance estimates for the galaxies assigned to groups (see below), instead we take the redshift relative to the cosmic
microwave background (CMB) rest frame (zcmb) reported in each
group catalogue and calculate the Hubble–Lemaˆıtre flow2 (H
0=
70 km s−1Mpc−1) distance to each group. The same distance is
assumed for all members of a group.
3 G R O U P C ATA L O G U E S
Several different techniques have been developed in the attempt to identify gravitationally bound collections of galaxies in large spectroscopic redshift surveys. Among the most common in the literature are the friends-of-friends (FoF) group finding algorithm
(e.g. Huchra & Geller1982; Eke et al.2004; Berlind et al.2006;
Crook et al.2007; Tempel et al.2014) and iterative halo-based group
finders (e.g. Yang et al.2007; Lu et al.2016; Lim et al.2017). FoF
uses linking lengths: one in sky projection and one in redshift to associate nearby galaxies with one another. These algorithms have been tested to match the halo multiplicity and halo occupation
properties of galaxies in mock galaxy catalogues from N-body
simulations. FoF algorithms are elegant in their simplicity, however the choice of linking lengths is not unique, and depend on the
scientific motivation (Duarte & Mamon2014). Halo based finders
are an attempt to develop a more physically motivated algorithm, which use the stellar mass of a galaxy (or collection of galaxies) as a proxy for the dark matter halo mass in order to associate galaxies in common dark matter haloes. Such algorithms start with seed groups (e.g. from an FoF algorithm with a short linking length) or individual galaxies, the luminosity of the galaxies in these seeds is then used to estimate the group halo mass, from which relations between
2Previously referred to as the Hubble flow.
a halo mass and its size and velocity dispersion (from theory or simulations) can be used to assign probabilities that other galaxies in the vicinity are also members of the same group. Galaxies above a certain threshold probability are incorporated into the group and the steps are iterated to convergence. In this way the assignment of galaxies to groups is more grounded in a physical model, instead of reliant on, somewhat arbitrary, choices of linking lengths. For further details of this method, we refer the reader to the articles cited above.
Regardless of the method used to find groups and their members, the resulting group catalogues are always either volume-limited and therefore omit low-luminosity (mass) objects at all redshifts because they are not found in the entire volume, or the group catalogues are flux-limited and therefore the group statistics change over the redshift range they cover because the lowest luminosity objects are only visible nearby. In this paper, we examine the HIMF from four different popular group catalogues constructed using either
FoF (Berlind et al. 2006; Berlind 2009; Tempel et al.2014) or
the iterative halo finder (Yang et al.2007; Lim et al.2017). Three
of these group catalogues are volume-limited (Yang et al.2007;
Berlind2009; Tempel et al. 2014), while the last is flux-limited
(Lim et al.2017).
Three of the four catalogues, as published, also include haloes that consist of only one or two galaxies. Individual, well-defined groups typically need at least 10 members to reliably estimate the size and velocity dispersion, but the lowest mass groups only have a handful of members. Therefore, to probe the low-mass, loose group environment we only consider groups with at least three members. Of course, it should be noted that due to differences in the methodology used to construct the groups in the four catalogues, a triplet in one catalogue is not necessarily an equivalent type of object to a triplet in another catalogue.
3.1 Berlind et al. groups
Berlind (2009), hereafterB09, is an application of the FoF algorithm
of Berlind et al. (2006), hereafterB06, used on SDSS DR4 to the
SDSS DR7, which provided spectroscopic coverage complementary with the full ALFALFA coverage. Three volume-limited catalogues
are available online.3We choose the group catalogue whose absolute
magnitude limit inrband is the faintest at−18.0. By including the
faintest galaxies, we probe the lowest mass group regime available. The absolute magnitude limit also effectively sets an upper redshift
atz= 0.042 which is well matched to the ALFALFA selection
function. The authors set an additional lower redshift cut ofz=
0.02 below which they do not trust the SDSS DR7 photometry. As the inner and outer limits of this catalogue were defined using the observed redshifts of the galaxies in the heliocentric frame, which do not directly correspond to (Hubble–Lemaˆıtre flow) distances, we removed small regions on the inner and outer boundaries by redefining the redshift limits of the catalogue in the CMB
reference frame (Lineweaver et al.1996) as 6750 and 12 500 km s−1,
respectively. These redshift criteria cause the velocity dispersion of the Coma cluster to be truncated and we therefore eliminated it from the catalogue entirely.
3The group catalogues were obtained from the website of A. Berlind (http:
//lss.phy.vanderbilt.edu/groups/dr7/), hosted by Vanderbilt University, on 2018 February 5th, although the content remains unchanged to the date of acceptance of this work.
3.2 Tempel et al. groups
Tempel et al. (2014), hereafterT14, provide both flux- and
volume-limited catalogues. In this case, we chose the volume-volume-limited
catalogue with the samer-band absolute magnitude cut-off of−18.0
asB09. The data for this group catalogue come from SDSS DR10,
which has the same coverage as DR7, but the galaxy properties on which the group finder were run are based on data from updated SDSS photometric and spectroscopic pipelines. The first major
differences between theB09andT14catalogues are thatT14uses
different linking lengths. The linking length is barely smaller than
B06in sky projection, but larger by almost a factor of 2 in the radial
direction. None the less,T14is in line with the recommendations
of Duarte & Mamon (2014), and thusB06 is more conservative
and may miss galaxies that are falling in along the line of sight.
The second major difference is thatT14uses a higher redshift
cut-off of z < 0.045, and applies no low-redshift cut-off. As a
result, the T14 catalogue is incomplete for bright, very nearby
objects where SDSS becomes saturated (Tempel, Tago & Liivam¨agi
2012), or where the SDSS pipeline has not targeted objects due to
shredding, etc. The authors attempt to overcome this and SDSS fibre collisions by adding additional redshifts from 2dFGRS (2 degree Field Galaxy Redshift Survey), 2MRS (2MASS, 2 Micron All Sky Survey, Redshift Survey), and RC3 (3rd Reference Catalogue of
bright galaxies). None the less, in fig. 2 ofT14there appears to
be a discontinuity in the number density of galaxies at redshift
of around 4000 km s−1(∼60 Mpc) which might be indicative of
incompleteness at low redshift.
In the case of theT14groups, the minimum redshift corresponds
to a CMB frame recession velocity of just over 1000 km s−1, so
we make a conservative choice and restrict the catalogue to 1500<
czcmb/km s−1<13 500.
3.3 Yang et al. groups
The Yang et al. (2012), hereafterY12, catalogue is an update of the
iterative halo based group finder of Yang et al. (2007), hereafterY07,
from DR4 to the SDSS DR7 data, augmented with redshifts from
2dFGRS, 2MRS, and R3C as withT14. This is the so-called modelB
catalogue. The reference to the new catalogue barely appears as
a footnote in appendix B ofY12, but the catalogue is available
online.4
This catalogue differs from FoF significantly in the philosophy of its construction as well as the types of galaxies and groups it includes. The seed galaxies for the group haloes are effectively
volume-limited but are required to have anr-band absolute
magni-tude limit of−19.5. In addition, only galaxies above this limit are
used to estimate the group halo mass and radius, which is in turn used to assign new members. After the initial seeds are identified, the spectroscopic catalogue used to populate the groups is flux-limited, and any galaxy within the estimated size of the halo is
included in the group, including galaxies fainter than−19.5 mag in
rband. Despite this, theY12catalogue does not include low-mass
groups because galaxies fainter than−19.5 mag cannot be grouped
together: if they do not reside next to a bright galaxy, then they are
treated as centrals in their own haloes. As a result,Y12groups with
4http://gax.sjtu.edu.cn/data/Group.html. Note that this is the new host website to replace the previously published location (S. Lim, private communication).
low membership will on average be higher mass than groups with
the same membership in theB09orT14catalogues.
As with theB06groups, theY07groups have inner and outer
boundaries based on heliocentric redshifts. In this case, we restrict
the catalogue to 3600< czcmb/km s−1<15 000.
3.4 Lim et al. groups
Lim et al. (2017), hereafterL17, is a improvement on the
method-ology developed by Y07 to extend it to poor and low-mass
groups. The paper provides group catalogues for four spectroscopic surveys: 2MRS, 6dFGS (6 degree Field Galaxy Survey), SDSS, and 2dFGRS. For its depth and completeness, we use their group
catalogue for SDSS DR13, so-called SDSS+M. In addition, to
improved photometry and spectroscopy over DR7, some of the fibre collision galaxies now have spectroscopy in DR13, and additional
objects have spectra from the BOSS SDSS survey. As with theY12
andT14catalogues,L17augments SDSS objects without redshifts
with spectroscopy from other surveys including 2dFGRS, 6dFGS, KIAS VAGC (Korea Institute for Advanced Study Value Added Galaxy Catalog), LAMOST (Large sky Area Multi-Object Fiber Spectroscopic Telescope). These augments result in total redshift completeness for galaxies with apparent magnitudes brighter than
17.7 in therband. The catalogue is available online for download
(see footnote 4).
In this case there is no magnitude limit applied to the galaxy catalogue and a preliminary halo mass is assigned to every galaxy. For each halo, the size and line-of-sight velocity dispersion is cal-culated based on the mass of the halo (from the stellar luminosity), and the phase space distribution of galaxies in dark matter haloes is used to associate galaxies into groups. Groups are ranked and assigned masses by halo abundance matching, and the process is iterated again.
At high group masses,L17andY12catalogues have no
signif-icant difference, but critically, theL17catalogue extends to lower
group masses where the abundance of groups is greater. For studies of the impact of environment on something as tenuous as gas discs, a catalogue that extends to lower group masses is critical to understand where environmental effects become important.
As theL17catalogue is not volume-limited, we decided to create
a subcatalogue that would be complete (in a volume-limited sense)
for all the group centrals. We set redshift boundaries as 1000<
czcmb/km s−1<13 500 and used the SDSS spectroscopic survey
completeness threshold magnitude (17.7 inrband) to remove any
groups with centrals less luminous than the corresponding absolute
magnitude at the outer distance boundary,−18.7.
3.5 Assignment of ALFALFA sources to groups
We assign HIdetected galaxies from ALFALFA to galaxy groups
in a two-step process: first by directly matching them using SDSS object IDs to optical galaxies that are known to be group members;
and second through a proximity matching to groups if the HI
detections fall within the group volume, defined by a velocity range and projected radius. The direct matching ensures that known
optical members with an HIcounterpart are included in the group
catalogue. The proximity matching step allows us to include gas-rich galaxies that may not have a stellar counterpart in the group catalogue because they were too optically faint (for example in the flux-limited group catalogues).
3.5.1 Direct matching
When ALFALFA HI detections were extracted during the data
reduction process, the most likely optical counterparts were
identi-fied manually (see Haynes et al.2011, section 4.1). These manual
identifications are then automatically matched to SDSS photometric
and spectroscopic objects where they are available,5 providing a
catalogue of counterparts (Durbala et al., in preparation).
TheB09andY12catalogues were derived from DR7, so as a
first step we retrieved updated object IDs from DR8+through the
SDSS CasJobs. In less than 1 per cent of cases, we did not find
a DR8+counterpart for a DR7 group member. Usually this was
because one galaxy had been shredded into multiple sources in DR7, and this issue had been fixed in the later SDSS photometric pipeline. Given the small number of sources to be effected, we do not expect this issue to have a strong impact on the group statistics.
TheT14andL17catalogues were derived from later SDSS data
releases and their object IDs could be used as provided in the group catalogues.
For each optical group catalogue, we matched the specObjIDs of ALFALFA detections to specObjIDs of the optical members using JOINinASTROPY.TABLE. This resulted in four tables of HI‘direct matches’, one for each group catalogue.
3.5.2 Proximity matching
For the proximity matching, we calculated the volume of every group based on their published physical properties, and assigned an
HIgalaxy to a given group if it fell within that volume and was not
previously assigned to a group by direct matching. To be clear: it
is not necessary in this case for the HIdetection to have an optical
spectroscopic counterpart, it simply needs to fall within the group
environment to be included based on the HIposition and redshift.
However, we note that all of the HIdetections in our subset of
ALFALFA at least have a photometric counterpart in SDSS. To estimate the volumes, we sought to remain consistent with the philosophy that originally went into constructing each group catalogue, and work with the physical properties they provided. In general, we chose values for the projected radius and line-of-sight velocity that included 90–95 per cent of known group
members and prevented as many HIdetections from being matched
to two groups as possible (Fig.1). ForB09andT14these choices
(90 per cent) were more conservative than forY12andL17, and for
bothY12andL17the choices were more conservative in the velocity
dimension (90 per cent) than in projected radius (95 per cent). For
matching with theT14andL17catalogues, we converted ALFALFA
heliocentric velocities to CMB velocities to be consistent with the group catalogues. We describe and further justify our choices below. In the equations, we retain the nomenclature used in the original works.
TheB09catalogue provided the position of the group centroid,
mean redshift, line-of-sight velocity dispersion,σ, and projected
rms radius of the group (R⊥rms). We found that in a number of
cases, the group radius or velocity dispersion was smaller than the FoF linking length, so we set an effective minimum search volume for every group. The group volumes were then calculated from the maximum of the scaled size of the group or a fixed fraction of the
5The SDSS cross-match in Haynes et al. (2011) was based on DR7, while the current version of the ALFALFA cross-match uses the objIDs and specObjIDs corresponding to DR8 onward (DR8+).
Figure 1. The distribution of optical members in each group catalogue,B09,Y12,T14, andL17(top left to bottom right). Each member is shown as a black point in the dimensionless radial and velocity separation directions. In each case the velocity separation is scaled by the group velocity dispersion, however, as each catalogue calculates radii in different ways they are necessarily scaled differently, thus the values are not directly comparable in this dimension (except forL17andY12). The different radii used are described in Section 3.5.2. The dashed vertical lines mark the bounds that contain 90, 95, and 99 per cent of the optical members (red, blue, and green line, respectively), the horizontal dashed ‘tram’ lines enclose the same fractions. Note these bounds were calculated independently in each dimension. In the case ofY12the 99 per cent lines are not shown as a smaller number of outliers shift them well beyond the range plotted.
linking length
Rprox[Mpch−1]=max[1.5R⊥rms,0.5D⊥], (2)
Vprox[km s−1]=cz±max[1.5σ,0.75D]. (3)
D⊥andDare related to the linking lengthsb⊥andbfor a given
sample byD⊥,=b⊥,ng−1/3h−1wherengis the volume density of
galaxies in the sample (equations 3–5 ofB06). For DR7 Mr18,ng
=0.030 13 (see footnote from Section 3.1).
TheT14 catalogue provided the position of the group centre,
mean redshift corrected for the CMB, the velocity dispersion,σ, and
three different radii. These include (1) ‘σsky, the rms deviation of the
projected distance in the sky from the group centre’, (2) an estimate
of the virial radius from the projected harmonic mean distance
between galaxies, and (3) the maximum radius of the group,Rmax.
In general, we found the value forσskycorresponded to roughly
one-third of the maximum radius, and the so-called virial radius
was similar toσsky, but with a large scatter. In the end, we chose
the largest scaled value of the maximum radius which did not result
in a significant number of HIdetections being matched to multiple
groups (≤5 instances for our choice). Similar toB06, the group
volumes were calculated from the maximum of this scaled size of the group or a fixed fraction of the linking length
Rprox[Mpch−1]=max[0.7Rmax,0.5dLL], (4)
Vprox[km s−1]=czcmb±max([1.38σ,0.5vLL]), (5)
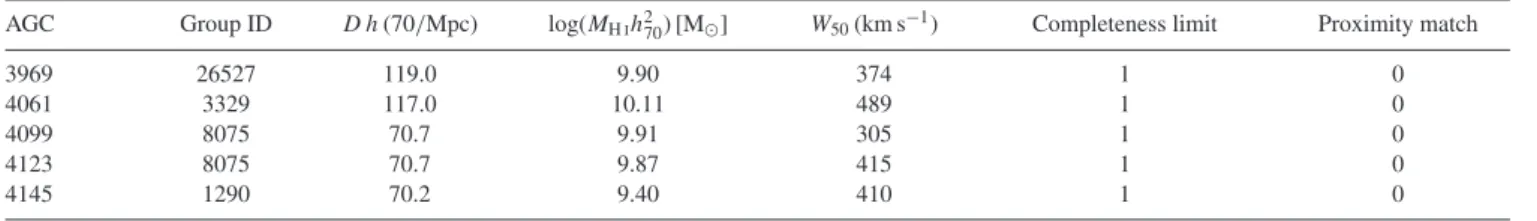
Table 1. Summary of HIassignments to optical group catalogues.
Berlind et al. Yang et al. Tempel et al. Lim et al.
Groups 1322 1579 3909 2231
Minimumczcmb 6750 km s−1 3600 km s−1 1500 km s−1 1000 km s−1 Maximumczcmb 12 500 km s−1 15 000 km s−1 13 500 km s−1 13 500 km s−1
Optical members 8522 14 280 16 363 15 076
Limiting absolute magnitude −18.0 −19.5a −18.0 −18.7a
Minimumr-band luminosity 109.07L
108.21L 109.07L 107.10L Minimum HImassb 109.13M 108.59M 107.83M 107.47M HI–optical matches 1891 2354 2397 3182 HIproximity members 619 476 934 645 Total HImembers 2510 2830 3331 3827
HImembers after cuts 1827 2013 2441 2865
aApplies only to centrals. bAssumingW
50=100 km s−1.
wheredLLis given by equation (2) inT14,vLL=10×dLLand both
are slowly varying functions ofzcmb.
The iterative halo finders did not require a minimum group volume because the parameters reported in the catalogues were based on the estimated properties of the dark matter haloes rather
than the mean positions of the galaxies. For theY12catalogue, the
group volumes were defined by
Rprox[Mpch−1]=0.75r180, (6)
Vprox[km s−1]=cz±1.6σ, (7)
wherer180andσ are given by equations (5) and (6) inY07. The
radius and velocity dispersion of the groups are calculated from the group halo mass, which is in turn estimated using a varying stellar
mass-to-light ratio based on a characteristic luminosity (L19.5). This
provides reasonable estimates for halo mass for high-mass groups, but provides significantly poorer estimates for individual low-mass groups.
For theL17catalogue, the group volumes were defined by
Rprox[Mpch−1]=0.75r180, (8)
Vprox[km s−1]=czcmb±1.57σ, (9)
wherer180 and σ are given by equation (4) in L17. As in Y12,
the radius and velocity dispersion of the groups are dependent on the halo mass, but this time use the stellar mass of all galaxies in the group and includes a correction based on the gap between
the brightest central galaxy and the nth brightest galaxy (based
on conclusions from Lu et al.2016). This corrects the halo mass
for groups that sit close to the flux limit of a shallow survey (see
section 3.2 inL17). The scatter in the stellar mass versus halo mass
as compared to mocks is reduced across the whole group mass range and is significantly more reliable for low-mass groups as compared
toY12.
We see from Fig.1that the shape of the FoF groups are quite
different in phase space than the groups determined by the iterative halo finder. The overall shape of the FoF groups look like a cylinder projected on to phase space. This is consistent with how FoF works: the algorithm looks for companions within a cylindrical volume centred on the seed galaxy. When any new galaxies are found within this volume they are added to the group and the cylindrical volume is re-centred on the new members and the search repeated. By comparison the iterative halo finder groups look like a sphere projected on to phase space. Iterative halo finders also use a cylindrical volume by the nature of observational limitations,
however the search cylinder is centred on the weighted geometric centre of all the group members, and its size is dependent on the stellar mass of the group members. We suspect it is this more adaptive and gradually changing search volume that results in more realistically shaped groups in phase space.
A summary of the number of ALFALFA galaxies assigned to each
group catalogue is given in Table1. After the ALFALFA galaxies
have been assigned to a group their HImasses are recalculated
using the redshift of the relevant group in the group catalogue and the corresponding Hubble–Lemaˆıtre flow distance.
4 HI M A S S F U N C T I O N C A L C U L AT I O N
The HIMF is the number density of galaxies in the Universe
as a function of their HI mass. Like with many astronomical
distributions, the observed distribution of galaxy HImasses is a
highly biased representation of the intrinsic population owing to the influence of selection bias caused by survey sensitivity limits. ALFALFA is no exception to this and although the observed
distri-bution of HImasses peaks within the range 9<logMHI/M<10,
the lowest HImass galaxies, of which only a handful are detected,
are in fact the most numerous. There are two widely used methods
to correct for the survey selection bias, theVmaxmethod (Schmidt
1968) and theVeffmethod (Efstathiou, Ellis & Peterson1988; Zwaan
et al.2003; Martin et al.2010).
Both theVmaxand theVeffmethods are algorithms for estimating
the volume over which galaxies of a given HImass can be detected
within a given survey. By weighting detections in proportion to the inverse of these volumes, the intrinsic number density of galaxies
of a given HImass can be recovered. The distinction between
the two methods lies in how these volumes are estimated. In the
Vmaxmethod, the survey completeness limit is used to determine
the maximum distance that each galaxy could be placed at and still be detected. This distance is then cubed and multiplied by the area of the survey footprint to estimate the volume over which the galaxy can be detected, this volume is then referred to as
the Vmaxfor that galaxy. In theVeffmethod, the two-dimensional
distribution of HImass and HIvelocity width is split into bins
and the maximum likelihood value of each bin is obtained through an iterative procedure. The velocity width dimension can then be summed over to return to HIMF. The effective weighting that is applied to each galaxy can be interpreted as an inverse volume,
which is known as the effective volume orVeff.
In this work, we made use of both of these methods as each has its
advantages. TheVeffmethod is extremely robust against variations
in large-scale structure (LSS) within the survey volume which can
cause bumps in the HIMF calculated with theVmax. However, this
robustness relies on the assumption that the HIMF is universal and
unaffected by environment. Another property of theVeffmethod is
that the normalization of the HIMF cancels in the algorithm and must be applied after the fact. While this can be a disadvantage, in this case the effective survey geometry is extremely complicated and it is much more straightforward to use the summed volume of all the groups at the end to normalize the HIMF than to consider the volume of each group within the calculation. To perform this normalization, we take the projected size of each group and assume
spherical symmetry to calculate their volume. TheVeff values are
then all scaled by a single factor such that the total inferred number density of galaxies matches the observed number density after the observations have been upweighted for incompleteness (refer to
Papastergis2013, Appendix A for further details).
The principal advantage of the Vmax method is its theoretical
simplicity, which permits various post-hoc corrections to be made.
Thus, the Vmax method is useful both as a comparison to the
Veff method and because it can lead to a greater understanding
of the underlying causes of peculiarities in the HIMF. However, ultimately we were unable to make adequate corrections for LSS
in all cases, so the following analysis relies entirely on theVeff
method.6 Although our analysis with the V
max method was not
successful, the attempt led us to explore corrections to the method (aside from LSS corrections) that are broadly applicable to all or most existing methods for estimating the HIMF. These are discussed further in Appendix A.
5 R E S U LT S
In this section, we will first consider the HIMF of each group catalogue in turn, exploring their differences and similarities, before presenting the global results.
5.1 The HIMFs of each group catalogue
Fig. 2 shows the four HIMFs calculated using the Veff method
and the ALFALFA galaxies assigned to groups in each of the four
catalogues. From top left to bottom right they areB09,Y12,T14,
andL17. The lower section of each panel displays the raw number
counts of ALFALFA detections in each HImass bin, and the upper
section shows the HIMF (black solid line) after these counts have
been corrected by theVeff values. The red dotted lines show the
Schechter function fits to the HIMFs, the parameters of which are also quoted in each panel.
TheB09group HIMF (top left panel) shows a striking difference
to the other three in that it is entirely missing sources below
logMHI/M=9. This is the result of the minimum distance
boundary (czcmb>6750 km s−1), which means ALFALFA is unable
to detect lower HImass objects associated with the groups in this
catalogue. This results in a poorly constrained and unrepresentative low-mass slope. Furthermore, as the two shape parameters of the Schechter function are extremely covariant, the ‘knee’ mass should also be treated with an abundance of caution, and the quoted uncertainty is misleading due to this covariance. This HIMF also
6We note here that an unresolved shortcoming of theV
effmethod can lead to suppression of the first (lowest mass) few bins (discussed further in Appendix A1). If this effect is apparent we omit the first two bins when fitting Schechter functions to the data.
displays a clear suppression of the first two (and possibly third) bins, which we exclude from the Schechter function fit. This is also the result of the minimum distance cut, which effectively truncates part of the velocity width distribution in these lowest mass bins. The
Veff method does not suitably correct for this truncation and as a
result the true abundance of galaxies in these bins is systematically underestimated (discussed further in Appendix A1).
Next consider theY12group HIMF (top right panel). Similarly
toB09, the low-mass slope of theY12HIMF is truncated by the
minimum distance cut enforced in this catalogue. However, as the
cut is at a considerably nearer distance (czcmb>3600 km s−1) there
are several well sampled bins on the low-mass slope allowing for a somewhat tighter constraint. The expected suppression of the first few bins is not seen in this case, but given the large uncertainty on those values, it is likely present but not apparent. The ‘knee’
mass is measured to be approximatelym∗ =10.0 (where m∗=
log (M∗/M)), and the low-mass slope is consistent with being flat.
In the case of theT14group HIMF (bottom left panel) there is
ap-parently good sampling of the low-mass slope until logMHI/M≈
8, after which the bins are suppressed by the minimum distance
cut (czcmb>1500 km s−1) effect (and are thus excluded from the
Schechter function fit). While the ‘knee’ mass agrees with that
found in the previous panel (Y12, top right), the low-mass slope is
significantly steeper. In the lower section of the panel, a pronounced bump is also apparent in the raw number counts. This bump can also
be seen in theL17panel (bottom right), but is much less pronounced.
We will return to this point in Section 5.2.
Finally, consider theL17group HIMF (bottom right panel). Of
the four catalogues this was assigned the most HImembers to its
groups and extends to the lowest redshift (czcmb>1000 km s−1).
The ‘knee’ mass again agrees with the previous two measurements, but the low-mass slope is marginally steeper than flat, in agreement
withY12(top right panel), but in tension with T14(bottom left
panel). There is also no apparent suppression of the lowest mass
bins forL17, but a simple calculation explains why. The ALFALFA
50 per cent completeness limit (Haynes et al.2011, equations 4 and
5) for a galaxy of a velocity width of 100 km s−1(fairly broad for
a low-mass galaxy) falls at logMHI/M=7.83 and 7.47 for the
minimum distance cuts in theT14andL17catalogues, respectively.
That means that both of the first two bin in theT14HIMF are
expected to suffer from suppression, while only the first bin of the
L17HIMF is even partially affected.
While the three catalogues with a good sampling of HImasses
all agree thatm∗=10.0, slightly higher than the global ALFALFA
value, theY12andL17groups have a flat low-mass slope, whereas
T14has a steeper slope that is almost consistent (at 1σ) with that of
the global ALFALFA HIMF (Jones et al.2018). It is unsurprising,
but encouraging, thatY12andL17agree as they employ almost the
same methodology;L17essentially being an extension of theY12
catalogue down to lower mass groups. However, the disagreement
in the low-mass slope between these andT14is unexpected and
must be investigated further.
5.2 Impact of the Virgo cluster
ComparingT14andL17(bottom left and right, respectively), the
difference in the low-mass galaxies can already be seen in the histograms of observed counts (before any completeness correction is made). Although these two catalogues cover the same volume
(and thus the same LSS),T14has many more low-mass ALFALFA
galaxies assigned to groups thanL17. The peak bin (just below
logM∗/M =10) has 11 per cent more galaxies in L17, but in
Figure 2. The group galaxy HIMF (upper panels) and corresponding number counts (lower panels) of observed galaxies in each bin. From top left to bottom right, the group catalogues used areB09,Y12,T14, andL17. The HIMFs were estimated following the correctedVeffprocedure described in Section 4. The black error bars and solid lines show the calculated number densities and associated Poisson counting errors, and the red dotted lines show the Schechter function fits. For both theB09andT14HIMF, the two lowest mass bins are excluded from the Schechter function fit as they are likely biased (Appendix A1).
the bins either side of logM∗/M =8 there are 53 HIgalaxies
assigned to groups inT14, compared to only 21 inL17. There is a
bump in the distribution in both histograms around this mass, but
clearly it is much stronger forT14than in L17. A similar bump
in the counts histogram of the full ALFALFA sample is seen at
the same mass (e.g. Martin et al.2010; Jones et al.2018) and is
caused by the presence of the Virgo cluster at a distance where such galaxies are just above the detection threshold, thereby enhancing the number detected. However, this is not the complete picture as
the Virgo cluster is in both catalogues and theVeffmethod corrects
for this enhancement. Therefore, the difference must be in how, and
how many, HIgalaxies are assigned to the groups in the respective
catalogues.
Fig. 3 shows the distribution on the sky of the HI galaxies
assigned toL17andT14groups. The location of the Virgo cluster is
immediately apparent in theT14groups (lower panel). As described
in detail by Mei et al. (2007) this region is extremely complicated
and the cluster proper is surrounded by many in-falling groups.
In the L17catalogue the area surrounding the cluster is broken
up into other, smaller groups, while from T14it has become an
enormous single structure. The latter of these no doubt includes many galaxies that are not truly group galaxies, but just happen to
be in the vicinity of Virgo. Jones et al. (2018) found that the
low-mass slope of the HIMF is particularly steep in this region of the sky, so it is unsurprising that the inclusion of many field galaxies in this region causes the slope to steepen.
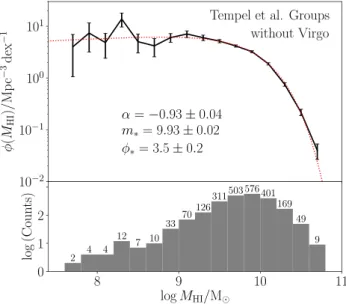
Fig. 4 shows the group galaxy HIMF for the T14 groups,
calculated in the same manner as Fig.2, but with Virgo manually
removed from the sample. This alone removes 162 HIgalaxies,
which has the result of causing the low-mass slope to increase by
approximately 0.2, making it broadly consistent withL17andY12.
As the structure surrounding Virgo in T14 is apparently
Figure 3. Sky plot showing the distribution of HIgroup members in the range 1500< czcmb/km s−1<6000 for theL17(top) andT14(bottom) catalogues.
Figure 4. The HIMF of theT14. group catalogue with the Virgo cluster excluded. Labelling scheme as in Fig.2.
handedly responsible for the steepness of the measured low-mass slope, and the extent of the structure cannot be considered a group, in that it is not plausible that this entire structure resides in a single parent halo, we therefore do not consider the initial result for the
T14group to be valid. We will proceed with the simplistic solution
of manually removing the Virgo cluster, but keep in mind that this is not an ideal solution.
5.3 Global findings
Fig.5shows the 2σ error ellipses of the Schechter function shape
parameters for the HIMFs shown in Figs2and4, as well as for
the full ALFALFA sample (Jones et al.2018), and the 2σerrorbars
of the HIPASS (Zwaan et al.2005) and ALFALFA 40 per cent
(Martin et al.2010) measurements. With Virgo removed from the
T14 groups, all four HIMFs are in agreement at the 2σ level,
preferring a significantly flatter low-mass slope than either HIPASS or ALFALFA as a whole. Although there is considerable scatter in the values of the ‘knee’ mass, the preferred region lies marginally higher than that of the ALFALFA global value and even more so compared to HIPASS. In summary, the differences between the group catalogues notwithstanding, there appears to be a consensus that the group galaxy HIMF low-mass slope is approximately flat and that its ‘knee’ mass is slightly higher than the global value.
6 D I S C U S S I O N
In this section, we briefly estimate the impact of source confusion on our measurements before proceeding to measure the HIMF in different halo mass bins, compare the group and field HIMFs, and discuss why a flattening of the low-mass slope was not seen in
Figure 5. The 2σerror ellipses of the group HIMF Schechter function fits presented in this work and the 2σerrorbars (and error ellipse) of the HIPASS and ALFALFA global fits. The four hatched ellipses correspond to the four groups catalogues, while the solid black ellipse indicates the location of the best-fitting values for the full ALFALFA sample. The grey errorbars mark the location of the fit for the ALFALFA 40 per cent sample, and the dark blue errorbars that of the HIPASS sample. The thick dashed ellipse outline shows the location of the error ellipse for theT14groups without the Virgo cluster.
previous works focusing on local environment and the HIMF in ALFALFA.
6.1 Source confusion
A potential issue for measuring the HIMF in any of the four groups catalogues is that of source confusion. While this has been shown not to be a significant problem for ALFALFA as a whole (Jones
et al.2015), groups represent a much denser environment than the
typical ALFALFA galaxy resides in, which again raises confusion as a concern, especially as the resolution of ALFALFA is around 3.5 arcmin. In Appendix C, we investigate the expected rate of
confusion for theT14catalogue in detail and come to the conclusion
that although a non-negligible fraction of the ALFALFA galaxies
assigned to groups (∼20 per cent) are probably, to some extent,
confused, this is unlikely to have a significant impact on their total
HImass measurements. A large part of the reason for this is because,
in terms of HIdetections, the groups are not nearly as dense as would
be expected. For example, the 2865 (Table1) ALFALFA galaxies
assigned to L17groups are only spread amongst 1457 different
groups, an average of just two HIdetections per group (excluding
the 774 groups with no HIdetections).
6.2 Groups of different halo mass
The group galaxies used to calculate the HIMF here can reside in anything from triplets to clusters, and the group galaxy HIMFs
shown in Fig.2are in this sense averages. However, it is possible
and likely that the HIMF will change its form between these extreme cases as they represent quite different environments.
L17estimated the halo masses of every group in their catalogue
as part of the group finding process. We briefly describe their approach here. Their preferred estimation method was to use a central luminosity–halo mass relation with a correction factor based on the luminosity difference between the central and the fourth
brightest satellite (Lu et al. 2016). If there were fewer than four
satellites then the faintest was used. If only the central was detected then the stellar mass–halo mass relation was used. The halo masses for all groups were then finalized by abundance matching with the
halo mass function of Sheth, Mo & Tormen (2001). These steps
were all repeated in every iteration of their group finding process.
To investigate the impact of halo mass, we split theL17catalogue
into three halo mass bins based on the halo mass estimates in that work. The three mass bins were selected to approximately divide into three different regimes:
(i) logMhaloh/M<13: Below this halo mass environment is not
thought to strongly affect the evolution of galaxies.
(ii) 13<logMhaloh/M<14: This is the broad range that covers
what is generally considered a group, from a structure comparable to the Local Group up to one almost 10 times more massive. In this range tidal interactions and strangulation of small galaxies may influence their properties.
(iii) logMhaloh/M > 14: In this range are groups with many
hundreds of members as well as some clusters. In this regime,
Figure 6. Top panel: The group galaxy HIMF split by group halo mass for theL17groups. Schechter function fits to the data are shown with a blue dotted line (low halo mass bin), a green dash–dotted line (intermediate halo mass bin), and a red dashed line (high halo mass bin).Bottom panel: Histogram showing the raw number counts of galaxies in each halo mass bin with the same styles as above.
an appreciable intragroup medium is expected and ram pressure stripping should also play a role in the evolution of the galaxies.
The HIdetections within each halo mass bin were used to calculate
the HIMF for groups of that halo mass, following the same method as used previously. When normalizing the HIMFs only groups within the same halo mass bin were considered as contributing to the total volume and number counts. The HIMFs in these group
halo mass ranges are shown in Fig.6.
What is immediately evident is that unfortunately the low-mass slope is only well sampled for the lowest halo mass bin, which makes comparison of the slope in more massive groups difficult.
Having said this, there appears to be a suggestion (Table2) that the
low-mass slope actually becomes a rising slope in more massive groups, but the measurements are very uncertain. This is the result of the fact that (in comparison to optical surveys) ALFALFA is a
relatively shallow survey due to the faintness of the HIline. Large
groups and clusters are uncommon and therefore a large volume is required to have a large sample of such objects, however, at large
distances (50 Mpc) ALFALFA cannot detect galaxies along the
majority of the low-mass slope (Fig.7). This also means that the
low-mass slopes of the HIMFs in Fig.2 are also dominated by
the galaxies in nearby and low halo mass groups. Therefore, the low-mass slopes should only be considered representative of such groups. To measure the low-mass slope of more massive groups would require a deeper blind survey or deep targeted observations of many groups.
Unlike the low-mass slope, the ‘knee’ mass is well sampled in all
three halo mass bins. While them∗values in the two lower halo mass
bins are in agreement, the value for the highest bin is considerably
lower. This might be indicating that in groups with logMhaloh/M
>14 the environment is starting to impact the HIcontent of even
L∗galaxies, causing the ‘knee’ mass to drop. However, this result
should not be over interpreted due to the weakly constrained
low-mass slope and the covariance betweenαandm∗.
Finally, we consider the normalizations of these functions. We
see that of the relatively small fraction of HIgalaxies that are in
groups (Table1and Section 6.4), the vast majority are in low-mass
groups, and the fraction decreases as the halo mass of the groups increases. In other words, the richness of high-mass groups does not offset their rarity.
6.3 Local environment
The numerous differences in the four groups catalogues used in this paper (discussed in Section 3) prompt the question of whether or not the galaxy environments in them will be similar. Also Jones
et al. (2016) investigated the HIMF in different environments, but
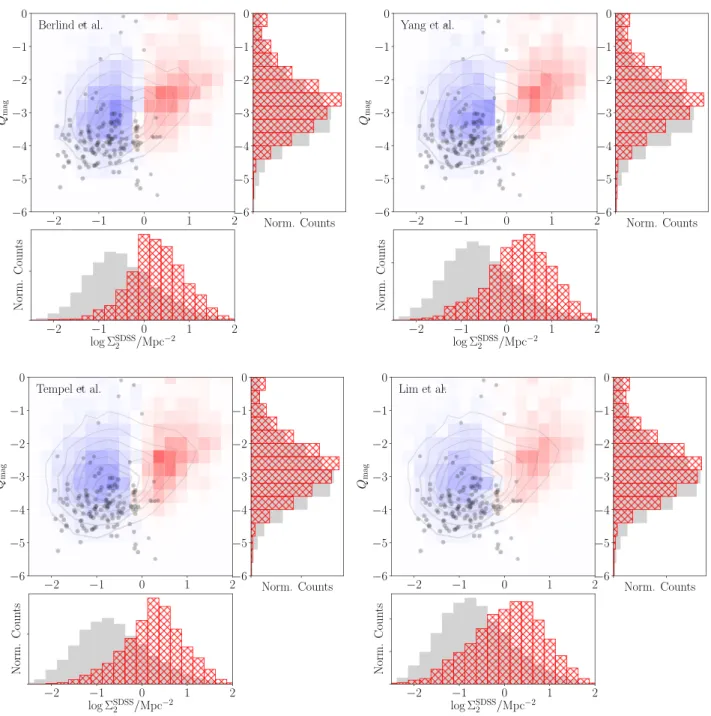
found no evidence for a flattening of the low-mass slope, even in the highest density environments. For the most part, the galaxies used to calculate the group galaxy HIMF here were included in the sample used in that study. This apparent discrepancy requires explanation. To address these issues we calculated the projected second nearest
neighbour density, 2, of all ALFALFA sources, following the
methodology of Jones et al. (2016), and a photometric measure of
the tidal impact of neighbours,Qmag, following a similar
method-ology to Argudo-Fern´andez et al. (2014). Here, we will discuss
the main findings of this analysis; the full details are presented in Appendix B.
Using these two metrics of environment, projected second neigh-bour density and the tidal force parameter (Appendix B), we find that in general the ALFALFA galaxies that we have assigned to groups are concentrated in a high-density, high tidal force region of the parameter space of the two metrics, relative to the ALFALFA population as a whole. This qualitative behaviour is the same for all four group catalogues, indicating that their environments (as measured by these metrics) are comparable.
Jones et al. (2016) separated the ALFALFA 70 per cent catalogue
into quartiles of neighbour density to investigate the impact of environment on the HIMF. As the group galaxies have high values
of this metric (Fig.B1), they mainly would have been concentrated
in the upper two quartiles in that analysis. Therefore, it is surprising that the work did not find any flattening of the low-mass slope in the higher neighbour density quartiles, given that we have measured a flat slope for group galaxies. However, this can be explained by the combination of two factors. First, environment metrics generally have a large scatter and so some field galaxies also fall in the region of the parameter space where the group galaxies are concentrated. Secondly, ALFALFA is comprised mainly of field galaxies. Together these mean that there is no range of the neighbour density metric where group galaxies dominate the population (and thus the HIMF). In other words, neighbour density is not sufficient
to reliably separate (HI-selected) field and group galaxies. This
explains the apparent tension between our present results and those
of Jones et al. (2016), and also suggests that it may be advantageous
to combine multiple environment metrics, to mitigate their large scatter, when studying environmental effects.
While the second nearest neighbour density metric used by Jones
et al. (2016) may not be able to reliably separate group from field
galaxies, that work did demonstrate that different quartiles of nearest neighbour density trace different density structures (their figs 4
and 8). With the lowestobjects being approximately uniformly
distributed, or even avoiding groups and clusters, and the highest
objects clumping around filaments, groups, and clusters. However, although the higher density quartiles are still dominated by field
Table 2. Schechter function fits to group HIMFs split by halo mass.
Halo mass bin Groups HImembers α m∗ φ∗/Mpc−3dex−1
logMhaloh/M<13 1799 1938 −1.02± 0.05 9.97±0.03 5.2± 0.4 13<logMhaloh/M<14 409 788 −0.82± 0.16 9.93±0.07 1.3± 0.2 logMhaloh/M>14 23 139 −0.02± 0.45 9.60±0.12 0.79± 0.11
Figure 7. The distribution of galaxy HImasses as a function of the halo masses of their parent groups (for theL17groups). This distribution has no correction for incompleteness, but highlights that the low-mass slope of the HIMF can only be constrained for low halo mass groups.
objects, it is important to remember that ‘field’ covers a wide range of environments, from objects on the outskirts of groups or filaments, to those in voids. Taken together these two results imply that the flattening of the low-mass slope of the HIMF only occurs for galaxies within the bound volume of a group, and not within the larger scale overdensities that often surround them, in other words, only for satellite objects.
6.4 Field HIMF
The ALFALFA sample is predominantly a field sample of galaxies
as HI-selected galaxies generally reside in low-density
environ-ments (Papastergis et al.2013). However, the global ALFALFA
HIMF (Martin et al.2010; Jones et al.2018) is not, strictly speaking,
the HIMF of field galaxies as all of the galaxies we have assigned to groups are contained within the full sample. Hence, to make a measurement of the field HIMF we must remove the galaxies we have assigned to groups.
To do this we took the ALFALFA Spring sky region of the survey, which covers approximately the same sky area as the group
catalogues. All the ALFALFA galaxies that were assigned to aL17
group were removed and the sample was cut to have the same
redshift limits as that catalogue (1000< czcmb/km s−1<13 500).
This left a total of 10 256 galaxies above the completeness limit.
Comparison with the values in Table1indicates that on average
22 per cent of ALFALFA galaxies reside in groups (as defined
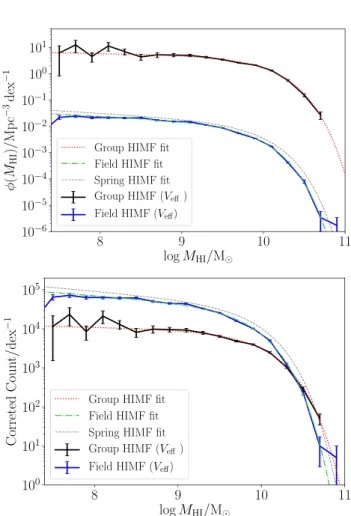
Figure 8. The field HIMF (blue solid line and error bars). Calculated from the ALFALFA galaxies in the Spring sky with theL17groups removed. The green dash–dotted line is the Schechter function fit. The group galaxy HIMF from Fig. 2is shown for comparison (black solid line and error bars) along with its fit (red dotted line). The thin grey dashed line is the best Schechter function fit to the full ALFALFA HIMF for the Spring sky (with the same distance limits as theL17sample).Top: The HIMFs plotted following the standard convention, number density per dex.Bottom: The HIMFs multiplied by the volume they correspond to, giving the total corrected number counts per dex. This gives a fairer impression of how groups and the field contribute to the global galaxy HIMF.
by L17).7 We then proceeded with the standard V
eff method to
calculate the field galaxy HIMF, which is shown by the thick, solid,
blue line in Fig.8. The Schechter function fit parameters for this
field HIMF are:α= −1.16±0.02,m∗=9.81±0.02, andφ∗=
(5.4±0.3)×10−3Mpc−1dex−1. For comparison we also show the
Schechter function fit to the HIMF of all the ALFALFA galaxies in
7This is the observed percentage and is therefore biased towards more massive galaxies. The value fairly including all HI-bearing galaxies would be considerably lower.
the Spring sky within the same redshift limits (α= −1.19±0.02,
m∗=9.89±0.02, andφ∗=(5.9±0.4)×10−3Mpc−1dex−1), and
theL17group galaxy HIMF, as in Fig.2. Note that the former is
not the same as the Spring sky HIMF presented in Jones et al.
(2018) because of the redshift limits used. TheVeff method does
not completely correct for the velocity width dependence of the detection limit for the lowest mass sources, however, over the mass range covered by the group HIMF this does not appear to have led to substantial suppression of the bins (although this does occur to the left of the range plotted).
There are two panels of Fig.8as a direct comparison of the group
and field HIMFs is somewhat subjective, owing to the difference in the physical volumes for which they are relevant. In the upper panel the HIMF is plotted in the normal fashion, that is, as a number density (per dex). In this case the group HIMF is much higher than the field HIMF, but this is simply because groups are dense collections of galaxies compared to the field, so this result comes as no surprise.
If instead the HIMF is multiplied by the total volume to which it applies then the vertical axis instead becomes a corrected number of galaxies, of a given mass, that are within that volume. For the group HIMF this volume is the sum of the volumes of all the groups
(including those with no HIdetections), whereas for the field HIMF
it is the entire survey volume (in the Spring sky, within the redshift range) minus the volume of the groups, although this is a negligible correction. When weighted in this manner we see that actually the group HIMF makes a minimal contribution to the overall HIMF over most of the mass range. However, at the high-mass end the ‘knee’ of the field HIMF falls at a lower mass and the galaxies in
groups become the dominant contribution (Fig.8, lower panel).
7 C O N C L U S I O N S
We have used four popular SDSS galaxy groups catalogues (Berlind
2009; Yang et al.2012; Tempel et al.2014; Lim et al.2017) to
identify ALFALFA HI-detected galaxies in groups and to measure
the HIMF for group galaxies using theVeff method. Differences
in how each group catalogue was constructed lead to differences between the group galaxy HIMFs derived for each, thus there is
no single group galaxy HIMF. While theL17and Y12 HIMFs
are very similar, theT14catalogue includes more low-mass, HI
-rich galaxies and thus a different low-mass slope, whereas theB09
catalogue is cut at a sufficiently high redshift that no low-mass galaxies are included. However, in general we find that the low-mass slope is approximately flat, significantly different from the global ALFALFA HIMF, but in agreement with studies of individual groups, and that the ‘knee’ mass is slight higher than that of the global ALFALFA HIMF.
The group galaxies were removed from the ALFALFA source catalogue in the Northern Spring sky and the field HIMF was
calculated with the remaining galaxies, following theVeffmethod.
We find that the field HIMF is almost equivalent to the global ALFALFA HIMF in the same region of the sky, indicating that group galaxies make only a small contribution to the global HIMF,
or equivalently, that the vast majority of HI-selected galaxies are not
satellites. This is most true for low-mass galaxies, as the relative
contribution of groups increases with increasing HImass, with
group galaxies actually becoming the dominant contribution beyond the ‘knee’.
We estimated the environment of all galaxies in ALFALFA, using the second nearest SDSS spectroscopic neighbour density and a photometric measure of the tidal influence of neighbours. Groups
are concentrated in a higher neighbour density and higher tidal influence region of the parameter space, but still overlap with the general ALFALFA population. Due to the far greater number of field galaxies in ALFALFA than group galaxies, this means that there is no region of this environment parameter space where group galaxies are the dominant population. This likely explains why previous studies of the environmental dependence of the HIMF with ALFALFA have not found significant evidence of a flattening of the low-mass slope, despite it being flat in groups.
Finally, we attempted to divide group galaxies into bins of their host halo masses. However, we find that due to the rarity of high halo mass groups, an insufficient number are nearby, where existing
HI surveys can detect low-mass galaxies, thus we were unable
to confidently make a measurement of the low-mass slope for intermediate- or high-mass groups. Such an analysis will require a
significantly deeper blind HIsurvey such as the upcoming DINGO
and MIGHTEE-HIsurveys that will be carried out with Square
Kilometre Array precursor telescopes. This is also a reminder that the HIMFs calculated for group galaxies in this work contain many different groups, and that the shape of the HIMF is dominated by galaxies in low halo mass groups as these are the most numerous.
AC K N OW L E D G E M E N T S
We acknowledge the work of the entire ALFALFA team for observing, flagging, and performing signal extraction. We thank the anonymous referee for their suggestions that helped to improve this paper. MGJ is supported by a Juan de la Cierva formaci´on fellowship (FJCI-2016-29685) from the Spanish Ministerio de Ciencia, Innovaci´on y Universidades (MCIU). MGJ and LVM also acknowledge support from the grants AYA2015-65973-C3-1-R (MINECO/FEDEAYA2015-65973-C3-1-R, UE) and AYA2015-65973-C3-1-RTI2018-096228-B-C31 (MCIU). The research of KMH is supported by the under the European Union’s Seventh Framework Programme (FP/2007-2013)/ERC Grant Agreement nr. 291531. EAKA is supported by the WISE research programme, which is financed by the Netherlands Organi-sation for Scientific Research (NWO). This work has been supported by the State Agency for Research of the Spanish MCIU through the ‘Centro de Excelencia Severo Ochoa’ award to the Instituto de Astrof´ısica de Andaluc´ıa (SEV-2017-0709). This research was supported by the Munich Institute for Astro- and Particle Physics (MIAPP) which is funded by the Deutsche Forschungsgemeinschaft (DFG, German Research Foundation) under Germany’s Excellence Strategy – EXC-2094 – 390783311.
R E F E R E N C E S
Abolfathi B. et al., 2018,ApJS, 235, 42
Argudo-Fern´andez M. et al., 2014,A&A, 564, A94 Bah´e Y. M., McCarthy I. G., 2015,MNRAS, 447, 969 Barnes D. G. et al., 2001,MNRAS, 322, 486
Berlind A. A., 2009, American Astronomical Society Meeting Abstracts #213, p. 252(B09)
Berlind A. A. et al., 2006,ApJS, 167, 1 (B06)
Brown T., Catinella B., Cortese L., Kilborn V., Haynes M. P., Giovanelli R., 2015,MNRAS, 452, 2479
Brown T. et al., 2017,MNRAS, 466, 1275
Crook A. C., Huchra J. P., Martimbeau N., Masters K. L., Jarrett T., Macri L. M., 2007,ApJ, 655, 790
Dahari O., 1984,AJ, 89, 966
Davies J. I. et al., 2011,MNRAS, 415, 1883
D´enes H., Kilborn V. A., Koribalski B. S., Wong O. I., 2016,MNRAS, 455, 1294