Tracheids in Developing Xylem of Norway Spruce
1[OPEN]
Olga Blokhina,a,2 Teresa Laitinen,b,2 Yuto Hatakeyama,c,2Nicolas Delhomme,dTanja Paasela,b,eLei Zhao,a Nathaniel R. Street ,f Hiroshi Wada,c,3 Anna Kärkönen,b,e,3and Kurt Fagerstedta,3,4,5
aViikki Plant Science Centre, Organismal and Evolutionary Biology Research Program, Faculty of Biological and Environmental Sciences, Helsinki University, Fi-00014 Helsinki, Finland
bViikki Plant Science Centre, Department of Agricultural Sciences, Helsinki University, Fi-00014 Helsinki, Finland
cKyushu Okinawa Agricultural Research Center, National Agriculture and Food Research Organization, Chikugo, 833-0041 Fukuoka, Japan
dUmeå Plant Science Centre, Department of Forest Genetics and Plant Physiology, Swedish University of Agricultural Sciences, 90187 Umea, Sweden
eNatural Resources Institute Finland (Luke), Production Systems, Plant Genetics, 00790 Helsinki, Finland fUmeå Plant Science Centre, Department of Plant Physiology, Umeå University, 90187 Umea, Sweden ORCID IDs: 0000-0003-0808-9663 (O.B.); 0000-0003-0526-4091 (Y.H.); 0000-0002-3053-0796 (N.D.); 0000-0002-7172-8862 (T.P.);
0000-0001-8947-7902 (L.Z.); 0000-0001-6031-005X (N.R.S.); 0000-0003-0510-5744 (H.W.); 0000-0001-8870-3250 (A.K.); 0000-0002-6839-2958 (K.F.).
A comparative transcriptomic study and a single-cell metabolome analysis were combined to determine whether parenchymal ray cells contribute to the biosynthesis of monolignols in the lignifying xylem of Norway spruce (Picea abies). Ray parenchymal cells may function in the lignification of upright tracheids by supplying monolignols. To test this hypothesis, parenchymal ray cells and upright tracheids were dissected with laser-capture microdissection from tangential cryosections of developing xylem of spruce trees. The transcriptome analysis revealed that among the genes involved in processes typical for vascular tissues, genes encoding cell wall biogenesis-related enzymes were highly expressed in both developing tracheids and ray cells. Interestingly, most of the shikimate and monolignol biosynthesis pathway-related genes were equally expressed in both cell types. Nonetheless, 1,073 differentially expressed genes were detected between developing ray cells and tracheids, among which a set of genes expressed only in ray cells was identified. In situ single cell metabolomics of semi-intact plants by picoliter pressure probe-electrospray ionization-mass spectrometry detected monolignols and their glycoconjugates in both cell types, indicating that the biosynthetic route for monolignols is active in both upright tracheids and parenchymal ray cells. The data strongly support the hypothesis that in developing xylem, ray cells produce monolignols that contribute to lignification of tracheid cell walls.
In conifers such as Norway spruce (Picea abies), lig-nin is a major cell wall constituent of secondary xylem (wood), forming approximately 27% of the dry weight (Jaakkola et al., 2007), representing a major sink of carbon from photosynthesis in the form of secondary compounds derived from Phe (Pascual et al., 2016). In wood, the cell wall cellulose and hemicellulose net-work is impregnated with lignin, which sustains structural stability and supports water transport. The current view of the lignification process encompasses many steps, starting with the biosynthesis of mono-lignols in the cytosol and their transport across the plasma membrane. The monolignol transport mecha-nism is still only partly characterized, but the data obtained indicate that ATP-binding cassette (ABC) transporters have an important role (Miao and Liu, 2010; Alejandro et al., 2012). In the cell wall, mono-lignols are exposed to extracellular peroxidases and laccases, the enzymes initiating polymerization of lignin by oxidizing monolignols to phenolic radicals
that couple nonenzymatically (Boerjan et al., 2003; Barros et al., 2015; Laitinen et al., 2017). Until now, it has not been clear whether monolignol biosynthesis in conifers is a cell-autonomous process in xylem tracheids, the main cell type in conifer wood, or whether neighboring cells (i.e. ray parenchymal cells) contribute to the production of monolignols. Cell culture studies with the angiosperm species Zinnia elegans indicate that nondifferentiating cells supply monolignols to differentiating tracheary elements (the good-neighbor hypothesis; Hosokawa et al., 2001; Tokunaga et al., 2005; Pesquet et al., 2013). Also, in inflorescence stems of Arabidopsis ( Arabi-dopsis thaliana), parenchymal cells and developing fibers in the xylem produce monolignols for lignify-ing vessels, whereas in interfascicular fibers, lignifi -cation is a cell-autonomous process (Smith et al., 2013, 2017). In Norway spruce, the ray parenchymal cells do not seem to lignify during the growing sea-son, based on staining with safranin and Alcian Blue 1552 Plant PhysiologyÒ,December 2019, Vol. 181, pp. 1552–1572, www.plantphysiol.orgÓ2019 American Society of Plant Biologists. All Rights Reserved.
for lignin and cellulose, respectively (seefigure 1 in Marjamaa et al., 2003), providing a model system for testing the good-neighbor hypothesis. Also, in Scots pine (Pinus sylvestris), the cell walls of the present year’s ray cells do not lignify (Marjamaa et al., 2003), whereas the onset of lignification in ray parenchyma has been observed in a growth ring adjacent to the heartwood border in Scots pine (Bergström, 2003) andPinus densiflora(Zheng et al., 2014). Therefore, the expression of lignin biosynthesis genes in the present year’s developing ray cells would strongly support the good-neighbor hypothesis in conifers.
Different transcriptomic approaches have been employed to reveal complex regulatory mechanisms and genes behind secondary xylem development (Carvalho et al., 2013; Nakano et al., 2015; Raherison et al., 2015; Zhong and Ye, 2015; Lamara et al., 2016; Barra-Jiménez and Ragni, 2017; Jokipii-Lukkari et al., 2017, 2018). Microarray and mRNA sequencing (RNA-Seq) approaches have identified a set of genes involved in cell wall polysaccharide and lignin syn-thesis as essential for cell wall morphology, compo-sition, and wood quality. It has been shown that the processes are controlled by microRNA at the post-transcriptional level (Carvalho et al., 2013). Recently, an RNA-Seq approach conducted from mRNA iso-lated from xylem and cambium/phloem of Norway spruce collected over a year revealed a specific set of highly coexpressed monolignol biosynthesis genes with a high level of expression in developing xylem during the period of active lignification (Jokipii-Lukkari et al., 2018). Interactions in the transcrip-tional network controlling vascular development have also been studied (Duval et al., 2014; Raherison et al., 2015; Lamara et al., 2016; Jokipii-Lukkari et al., 2018). Identification of groups of transcription factors coexpressed with their potential target genes has
revealed members of two transcription factor families that function as master switches in secondary cell wall development: NAC (NAM, ATAF1/2, and CUC2) and R2R3-MYB. They control gene expression of lower hierarchical level transcription factors as well as those encoding cellulose, hemicellulose, and lignin biosynthesis-related enzymes (Duval et al., 2014; Nakano et al., 2015; Zhong and Ye, 2015). Gene as-sociation analysis of wood properties in white spruce (Picea glauca) has linked the majority of wood trait-associated genes expressed in the secondary xylem with either NAC or MYB transcriptional regulators, suggesting that the regulatory mechanisms identified in model angiosperm systems are conserved in coni-fers (Lamara et al., 2016). For example, overexpression of two MYB genes of loblolly pine (Pinus taeda) in white spruce resulted in overlapping up-regulation of multiple phenylpropanoid pathway genes and en-hanced lignin deposition (Bomal et al., 2008).
A recent gene expression Web resource, NorWood (Jokipii-Lukkari et al., 2017), was created by sequenc-ing Norway spruce mRNA isolated from cryosections cut from the cambium and developing xylem into the previous year’s mature xylem. This database, together with the corresponding Populus tremula AspWoodresource, containing high-spatial-resolution data on gene expression over the corresponding sections (including phloem of European aspen [P. tremula]), have shown large-scale conservation in the transcriptome and coexpression networks of wood-forming tissues of softwood and hardwood species (Sundell et al., 2017). These re-sources represent a powerful community tool for generating evolutionary and developmental insights into the divergence of wood formation between an-giosperms and gymnosperms and for advancing un-derstanding on the regulation of wood development. However, these data do not allow for a separate study on gene expression of different cell types present in spruce xylem (i.e. upright tracheids, ray parenchymal cells [further referred to as tracheids and ray cells, re-spectively], ray tracheids, and epithelial cells of resin ducts; Fig. 1).
An RNA-Seq study of individual cell types separated with laser-capture microdissection (LCM) from the bark of white spruce has revealed that analysis of the transcriptome at the whole-tissue level masks the cell type-specific expression of genes (Celedon et al., 2017). Hence, it is crucial to evaluate gene expression in spe-cific cell types in order to understand the physiological phenomena occurring in those cells. Earlier, LCM was used successfully with other plant tissues (Ruel et al., 2009; Abbott et al., 2010; Hogekamp et al., 2011; Cañas et al., 2014; Nagy et al., 2014). To resolve the possible contribution of ray cells in lignification of tracheids in Norway spruce developing xylem, the LCM protocol for cryosections of developing xylem was first optimized, then ray cells and tracheids were collected separately with LCM (Blokhina et al., 2017). The isolated cells were then used for RNA extraction and transcriptome analysis. Since transcript abundances do not always translate into
1
This work was supported by the Academy of Finland (decisions 251390, 256174, 283245, and 317964 to A.K. and decision 316486 to O.B.) and the Faculty of Biological and Environmental Sciences of the University of Helsinki (to K.F.). T.L. was supported by the Finnish Cultural Foundation, Häme Regional Fund. N.D. was supported by the Knut and Alice Wallenberg Foundation and the UPSC Berzelii Centre. N.R.S. was supported by Trees and Crops for the Future.
2These authors contributed equally to the article. 3These authors contributed equally to the article. 4Author for contact: kurt.fagerstedt@helsinki.fi. 5Senior author.
The author responsible for distribution of materials integral to the
findings presented in this article in accordance with the policy de-scribed in the Instructions for Authors (www.plantphysiol.org) is: Kurt Fagerstedt (kurt.fagerstedt@helsinki.fi).
A.K., K.F., O.B., T.L., Y.H., and H.W. conceived and designed the experiments; O.B., T.L., L.Z., N.D., T.P., A.K., K.F., Y.H., and H.W. performed the research; T.L., O.B., N.D., T.P., A.K., Y.H., and H.W. analyzed the data; N.R.S. contributed to analysis tools; O.B., T.L., N.D., Y.H., H.W., A.K., and K.F. wrote the article with contributions from all the authors.
[OPEN]Articles can be viewed without a subscription.
www.plantphysiol.org/cgi/doi/10.1104/pp.19.00743
protein abundances, enzymatic activities, and hence, to metabolite levels, single-cell metabolome analysis was conducted separately from developing ray cells and tra-cheids using picoliter pressure probe-electrospray ionization-mass spectrometry (picoPPESI-MS; Nakashima et al., 2016) to investigate whether monolignol-related metabolites existed in developing ray cells.
Both the transcriptomic and metabolomic data strongly suggest that developing ray cells contribute to lignifi ca-tion of cell walls of developing tracheids. The analysis also identified a gene set that was expressed only in devel-oping ray cells and not in tracheids. In our work, we have identified yet another role for the multifunctional ray parenchymal cells: participation in the lignification of adjacent tracheids.
RESULTS
The aim of this study was to evaluate whether ray cells contribute to lignification of tracheids according to the good-neighbor hypothesis suggested for angiosperms (Pesquet et al., 2013; Smith et al., 2013, 2017). To address this, global gene expression was investigated separately in upright tracheids and in ray parenchymal cells col-lected by LCM from developing xylem of mature Norway spruce trees grown in Finland. Due to size limitations in the experimental setup, young (approximately 4 years old) Norway spruce trees grown in Japan were used for single-cell metabolomics by picoPPESI-MS. Finally, the obtained results were compared with available Web re-sources to identify cell type-specific gene expression in ray parenchymal cells and xylem tracheids.
Tissue Anatomy of the Xylem of 4- and 40-Year Old Norway Spruce Trees
For practical reasons, spruce trees of different geno-types were used for transcriptomic and metabolomics
analyses. Since trees of different maturity were uti-lized (approximately 40-year-old mature trees and approximately 4-year-old juvenile trees), the anat-omy of xylem was investigated (Fig. 1). Xylem tra-cheids of a juvenile tree stem were narrower compared with those of a mature tree. The ratio of the number of rays to that of tracheids, however, was the same. In differentiating xylem of both juvenile and mature trees, developing resin ducts were present, but only occasionally.
Quality of RNA Extractions
Care was taken to exclude resin ducts and ray tracheids from the dissected material used for RNA isolation (Supplemental Fig. S1). Whole cryosections of developing xylem were also analyzed to address RNA quality issues during LCM (Blokhina et al., 2017) and to serve as a reference transcriptome. RNA of adequate to good quality was isolated from the tracheids and ray cells, with RNA integrity numbers in the range 6.1 to 9.2. Total RNA yield obtained from the microdissected cells was approx-imately 60 ng per sample for rays and tracheids and approximately 90 to 180 ng for the whole sections. The RNA yield per volume of the tissue was 0.5 ng mm23(whole sections), 3.4 ng mm23(tracheids), and 9.6 ng mm23(ray cells).
Gene Expression in Developing Tracheids and Ray Cells In our RNA-Seq analysis, of 70,736 gene models pre-sent in the Norway spruce genome (version 1; Nystedt et al., 2013), 69.5% were expressed in at least some of the sample types analyzed. To evaluate whether differences existed in the most highly expressed genes in tracheids and ray cells, Gene Ontology (GO) category enrichment Figure 1.Photomicrographs of tangential
cry-osections of 4-year-old and 40-year-old Norway spruce stems stained with safranin and Alcian Blue. Note the smaller cell size in the young stem (A) in comparison with the old stem (B). Devel-oping xylem (blue) and mature xylem (red) are stained with Alcian Blue and safranin, for cellu-losic and lignified cell walls, respectively. In B, only the developing xylem is shown. Tracheid (T),
resin duct (RD), and rays (R) are indicated. Bars5
200mm.
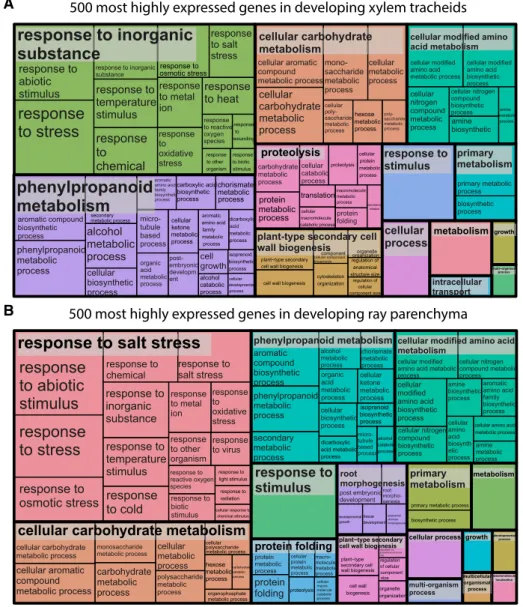
testing was conducted for the 500 most highly expressed genes of both cell types. This analysis revealed that similar cellular metabolism was active in develop-ing tracheids and in developdevelop-ing ray cells (Fig. 2; Supplemental Table S1). For example, genes in-volved in response to various stimuli, and in phe-nylpropanoid, carbohydrate, protein, and amino acid metabolism, as well as in cell wall biogenesis were highly expressed in both cell types.
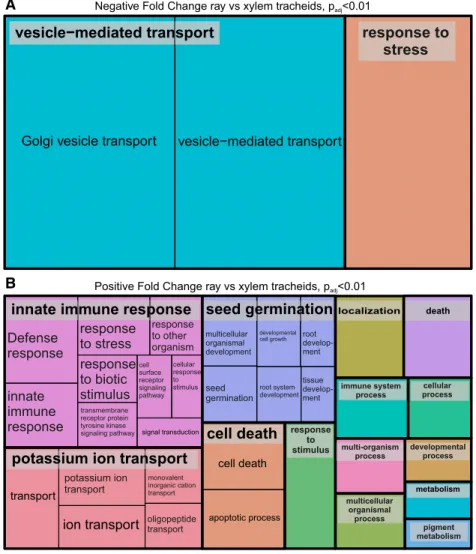
Some differences in transcript abundances were ob-served in the isolated xylem cell types. Of 1,073 differ-entially expressed genes, 541 genes were more highly expressed while expression of 532 genes was less abundant in developing ray cells than in developing tracheids (Padj , 0.01; Supplemental Table S2). Transcripts more abundant in ray cells contained, for example, genes related to immune response and sig-naling, ion transport, and cell death (Fig. 3B), whereas the GO terms vesicle transport and response
to stress were enriched for the genes more highly expressed in tracheids (Fig. 3A).
Lignin Biosynthesis Genes: Shikimate, Phe/Tyr,
Phenylpropanoid, and Monolignol Pathway Genes Were Highly Expressed in Both Ray Cells and Tracheids
To resolve whether developing ray cells synthesize monolignols, special focus was placed on the expres-sion of the genes in the pathways generating mono-lignols. In the Norway spruce genome (version 1), there are over 100 shikimate and aromatic amino acid pathway-related genes leading to Phe and Tyr and over 200 phenylpropanoid and monolignol biosynthe-sis pathway-related genes leading to monolignols (Nystedt et al., 2013). Phenylpropanoid metabolism was active in both developing tracheids and ray cells, as was evident from the GO enrichment of the 500 most
Figure 2. REVIGO Treemaps of 500 most highly expressed genes in developing xylem. The GO enrichment was realized using the Web-based tool agriGO (http:// bioinfo.cau.edu.cn/agriGO/index.php; Du et al., 2010). Developing tracheids (A) and developing ray parenchymal cells (B) are shown. See Supplemental Table S1 for gene identifiers.
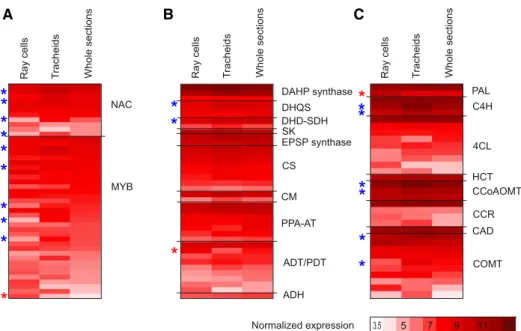
highly expressed genes (Fig. 2; Supplemental Table S1). Expression of the shikimate, aromatic amino acid, phenylpropanoid, and monolignol pathway-related genes was equally active in both cell types (Fig. 4; Supplemental Table S3). In general, enzymes encoded by the same genes were responsible for the phenylpropanoid metabolism in the cell types stud-ied, since only a few genes were differentially expressed (Fig. 4; Supplemental Table S3). Of the 38 most highly expressed shikimate and Phe/Tyr pathway-related genes, transcripts of two (3-DEHYDROQUINATE
SYNTHASEand3-DEHYDROQUINATE DEHYDRATASE/
SHIKIMATE DEHYDROGENASE; fold change 2.2 and 2.4, respectively) were less abundant, and one (AROGENATE
DEHYDRATASE/PREPHENATE DEHYDRATASE; fold
change 2.8) was more abundant in ray cells compared with tracheids (Padj,0.05; Fig. 4; Supplemental Table S3). Eleven of the pathway genes detected in this study have been reported previously as induced twofold or greater under extracellular lignin-forming conditions in a cell culture of Norway spruce (Laitinen et al., 2017).
Most of the phenylpropanoid and monolignol pathway-related genes with expression greater than 5 (normalized using VST; scale 0–14) in at least one of
the sample types analyzed here were equally expressed in both cell types (Fig. 4; Supplemental Table S3). One gene encoding Phe ammonia lyase (MA_10429279g0010) was more highly expressed in ray cells than in tracheids (Padj
# 0.05), whereas few genes had significantly higher ex-pression in tracheids than in ray cells (i.e. twoCINNAMIC
ACID 4-HYDROXYLASE [C4H], two CAFFEOYL-CoA
O-METHYLTRANSFERASE [CCoAOMT], and two
CAFFEATE/5-HYDROXYCONIFERALDEHYDE
O-METHYLTRANSFERASE[COMT]) genes. As syringyl
units synthesized from sinapyl alcohol are not present in spruce lignin, theCOMTsdetected may belong to thefl a-vonoid biosynthesis pathway.
Transcription Factors Regulating Cell Wall Development in Xylem
The NAC transcription factors VASCULAR-RELATED NAC-DOMAIN6 (VND6) and VND7 and MYB tran-scription factor family members MYB46 and MYB83 are known regulators of xylem differentiation and secondary cell wall formation in Arabidopsis (Nakano et al., 2015; Zhong and Ye, 2015; Heo et al., 2017). Of Figure 3. REVIGO Treemaps of differentially
expressed genes. Genes more highly expressed in developing tracheids are shown in A, and those more highly expressed in developing ray
paren-chymal cells are shown in B (Padj,0.01). The GO
enrichment was realized using the Web-based tool agriGO (http://bioinfo.cau.edu.cn/agriGO/ index.php; Du et al., 2010). See Supplemental Table S2 for gene identifiers.
the 11 most highly expressedNACgenes in our data (Fig. 4; Supplemental Table S3), MA_6777g0010, a se-quence homolog of white spruce PgNAC7 that is proposed to be the main master switch regulating secondary cell wall formation in white spruce (Duval et al., 2014), had no significant difference in expression in the sample types studied (normalized expression greater than 7.5). FourNACgenes (MA_95898g0010 [a sequence homolog of PgNAC8], MA_402393g0010, MA_27968g0010, and MA_18153g0010), on the other hand, were two to three times more highly expressed in tracheids than in ray cells (Padj,0.05). From these NAC genes, MA_95898g0010 and MA_402393g0010 were detected in NorWood in the neighborhood of the secondary cell wall cellulose synthase genes (Jokipii-Lukkari et al., 2017), potentially suggesting a regula-tory function. Five of the 34 most highly expressed MYBgenes in this study were more highly expressed in tracheids than in ray cells (twofold to threefold), and one was more highly expressed in ray cells than in tra-cheids (2.5-fold;Padj,0.05; Fig. 4; Supplemental Table S3). Additionally, two MYB genes (MA_962483g0010 and MA_16444g0030) with lower expression levels
(VST, 5) were significantly more highly expressed in ray cells than in tracheids (fold change 2.4 and 5.7;Padj 0.04 and 0.014, respectively; Supplemental Table S3). MA_139238g0010 and MA_62361g0010, which are se-quence homologs of loblolly pinePtMYB8andPtMYB1 regulating secondary cell wall and/or monolignol bio-synthesis (Bomal et al., 2008), on the other hand, were not differentially expressed in the cell types studied. The latter MYB gene, MA_62361g0010, was coexpressed with several secondary cell wall synthesis-related genes, including many monolignol biosynthesis genes in de-veloping wood of Norway spruce (Jokipii-Lukkari et al., 2018), supporting its role in the regulation of monolignol biosynthesis (Bomal et al., 2008).
Expression ofPEROXIDASEandLACCASEGenes in Developing Tracheids and Ray Cells
Unlike cell walls of ray tracheids, which are located on the top and the bottom of uniseriate rays, ray pa-renchymal cells do not lignify during the growing season of Norway spruce (Marjamaa et al., 2003). To Figure 4. Average-normalized expression of genes important in lignification. NAC and MYB transcription factors (A), shikimate,
Phe, and Tyr pathway genes leading to Phe and Tyr (B), and phenylpropanoid and monolignol biosynthesis pathway genes leading to monolignols (C) are shown in ray parenchymal cells, upright tracheids, and whole sections of developing xylem with
ex-pression levels higher than 5 (variance-stabilizing transformation [VST].5) at least in one of the sample types. Red stars count for
significantly higher and blue for significantly lower levels of expression in ray cells than in tracheids (Padj#0.05). Shikimate, Phe,
and Tyr pathway genes are according to Maeda and Dudareva (2012): ADH, arogenate dehydrogenase; ADT, arogenate
dehy-dratase; CM, chorismate mutase; CS, chorismate synthase; DAHP synthase, 3-deoxy-D-arabino-heptulosonate 7-phosphate
synthase; DHD-SDH, 3-dehydroquinate dehydratase-shikimate dehydrogenase; DHQS, 3-dehydroquinate synthase; EPSP
syn-thase, 5-enolpyruvylshikimate 3-phosphate synthase; PDT, prephenate dehydratase; PPA-AT, prephenate aminotransferase; SK,
shikimate kinase. General phenylpropanoid pathway genes are as follows: CCoAOMT, caffeoyl-CoA 3-O-methyltransferase;
C4H, cinnamate 4-hydroxylase; 4CL, 4-coumarate-CoA ligase; HCT, hydroxycinnamoyl-CoA shikimate/quinate hydrox-ycinnamoyl transferase; PAL, phenylalanine ammonia lyase. Monolignol pathway genes are as follows: CAD, cinnamyl alcohol
dehydrogenase; CCR, cinnamoyl-CoA reductase; COMT, caffeate/5-hydroxyconiferaldehydeO-methyltransferase.p-Coumaroyl
shikimate 3-hydroxylase is missing from the figure due to annotation difficulties related to cytochrome P450 genes, as enzyme activity cannot be inferred from the gene sequence. See Supplemental Table S3 for gene identifiers.
investigate the expression of genes encoding oxidative enzymes involved in monolignol oxidation, the ex-pression level ofPEROXIDASEsandLACCASEswere analyzed separately in tracheids and ray cells. In the Norway spruce genome, class III secretory plant per-oxidases occur as a large gene family containing 281 gene models (Nystedt et al., 2013). In the data, 201 putative PEROXIDASE genes had some expression, with 51PEROXIDASEshaving normalized expression over 1 (VST . 1) in any of the samples analyzed (Supplemental Table S4). Similar to the pathway genes leading to monolignols, most of the PEROXIDASE genes had no significant difference in expression be-tween the cell types studied. Of all PEROXIDASEs, MA_91956g0010 had the highest expression in whole sections and in tracheids; furthermore, its expres-sion was higher in tracheids than in ray cells (fold change 3.1;Padj,0.05). MA_10432865g0020 (PaPX2; Marjamaa et al., 2006; Koutaniemi et al., 2007) and MA_10175544g0010, on the contrary, were the most highly expressed PEROXIDASE genes in ray cells and were significantly more expressed in ray cells than in tracheids (fold change 4 and 4.3; Padj , 0.001; Supplemental Table S4). In addition, the expression of four otherPEROXIDASEgenes was higher in ray cells than in tracheids, whereas one additional gene was more highly expressed in tracheids (Padj,0.05). All of thesePEROXIDASEgenes had rather high expression levels in all sample types (normalized expression levels 3.4 to 10.5; Supplemental Table S4).
Out of 100LACCASEgenes expressed in the data set, 53 had normalized expression levels higher than 1 (Supplemental Table S4). Two genes (MA_ 10433259g0010 and MA_10431084g0010) were more highly expressed in tracheids than in ray cells (Padj , 0.05). The otherLACCASEgenes did not have statisti-cally significant expression differences between these cell types.
LCM RNA-Seq Data in Comparison with the NorWood Database
To validate the data obtained in our microdissection analysis, gene expression was compared with that de-termined separately from cryomicroscopy sections of Norway spruce cut over the dividing cambium and developing xylem into the previous year’s mature xy-lem (Jokipii-Lukkari et al., 2017; norwood.congenie. org). More than half of the genes of the 500 genes with the highest expression values in the whole-section samples in this study (Supplemental Table S1) had ex-pression in NorWood and could be found in the clus-tering analysis of Jokipii-Lukkari et al. (2017). One has to keep in mind, however, that only less than half of the expressed genes in our LCM RNA-Seq data were included in the clustering analysis represented in Nor-Wood. Of genes having high expression in the whole-xylem sections, 145 genes belong to the NorWood data cluster related to secondary cell wall formation
(Jokipii-Lukkari et al., 2017). In addition, 112 genes more expressed in tracheids than in ray cells (Supplemental Table S2) were mostly present in this same cluster. Genes more highly expressed in ray cells (Supplemental Table S2), on the other hand, had 46 matches to the cluster xylem expansion and 78 matches to the mature wood and the previous year’s latewood cluster. Many genes more abundantly expressed in ray cells, however, did not fall into any specific cluster. This observation suggests that there are differences in gene expression in developing ray cells as compared with those in the previous year’s mature wood, where the ray parenchymal cells and resin duct epithelial cells are the only living cells.
To investigate the behavior of the cell type-specific gene expression, genes expressed more highly in ray cells (541;Padj,0.01) were used in NorWood to build a net-work having 191 members (threshold 5; Supplemental Table S2). Similarly, when all genes expressed more abundantly in tracheids (532;Padj ,0.01) were used, a network with 452 members was obtained (threshold 5; Supplemental Table S2).
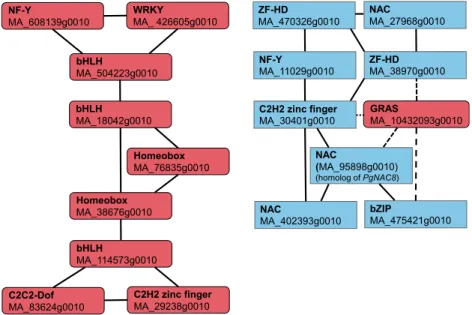
On the basis of the RNA-Seq data, 20 and 10 tran-scription factor genes were significantly more highly expressed in ray cells and tracheids, respectively (Padj, 0.01; Supplemental Table S2). These were used as an input in NorWood (threshold 3), and two coexpression subnetworks, both composed of nine members, were retrieved (Fig. 5; see Supplemental Table S8 for Arabi-dopsis homologs and description). Interestingly, one subnetwork was composed of only ray-enriched genes, whereas the other contained eight transcription factors whose genes were more highly expressed in tracheids, with negative correlation to one ray-enriched GRAS gene (Fig. 5). Next, these transcription factors and all pathway genes from the shikimate pathway down to monolignols with normalized expression over 5 were used as an input in NorWood (threshold 3). A network was created where the transcription factors were con-nected to 84 pathway genes (Supplemental Table S5).
Developing Ray Cells Express a Set of Genes Not Expressed in Tracheids
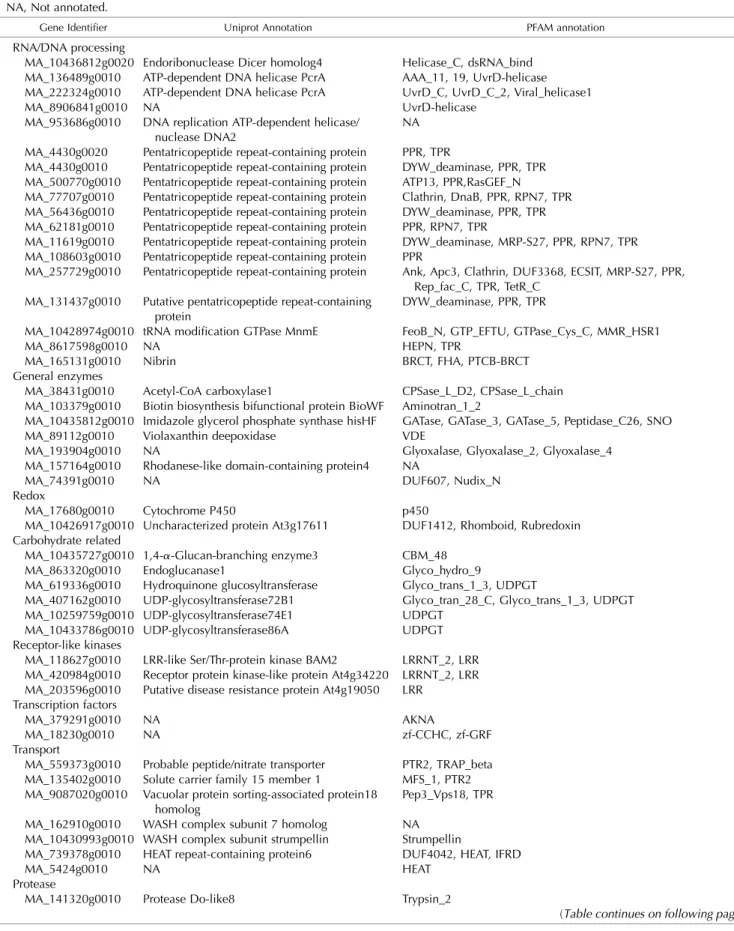
Cell type-specific transcriptomes are known to be masked when an RNA-Seq analysis is conducted from the whole-complex tissue (Celedon et al., 2017). Our experimental setup using LCM to isolate specific cell types of developing xylem allowed the identification of genes that were expressed only in one cell type (i.e. in developing tracheids or in developing ray cells; Supplemental Table S6). None of the genes was solely expressed in tracheids, whereas expression of 69 genes was detected only in ray cells, with no detectable ex-pression in tracheids (Table 1; Supplemental Table S6). The ray-only-expressed genes consisted of three major groups related to (1) RNA/DNA process-ing, transcription, and signaling (e.g. pentatricopeptide repeat-containing proteins, helicases); (2) carbohydrate
metabolism (e.g. glycosyl transferases), and (3) transport. There was no annotation for one-third of these ray-only-expressed genes, suggesting novel and uncharacterized biological functions represented in developing ray cells. Furthermore, a number of genes with normalized expression levels below 1 (VST, 1) in tracheids (88 genes) were overrepre-sented in ray cells (Supplemental Table S6). Annotation of these genes revealed a pattern similar to that in the ray-only-expressed genes: RNA/DNA processing-, tran-scription-, signaling-, and transport-related genes were supplemented with genes encoding proteins related to disease resistance, ubiquitinylation, and lipid metabolism.
In Situ Determination of Cellular Metabolites
In order to investigate whether the transcriptomic results translated to the metabolite level, picoPPESI-MS analysis was conducted separately on ray cells and tracheids of developing xylem of semi-intact plants of Norway spruce with a small part of bark tissue re-moved (Supplemental Fig. S2). The analysis showed that many lignin biosynthesis-related metabolites, in-cluding cinnamic acid orp-coumaraldehyde (mass-to-charge ratio [m/z] 147), p-coumaric acid (m/z 163), caffeic acid (m/z 179), coniferyl aldehyde (m/z 177), coniferyl alcohol (m/z 179), and p-coumaryl alcohol (m/z149), were detected (as [M2H]2, M5molecular mass of chemical species) in both cell types, to-gether with nine organic acids, sugars, most amino acids, glutathione, and abietic acid (Table 2; Fig. 6; Supplemental Fig. S3). Also, coniferin (a glycosylated form of coniferyl alcohol) and p-coumaryl alcohol 4-glucoside were detected as deprotonated forms (m/z 314 and 311, respectively) and as Cl2 adduct ions ([M1Cl]2;m/z377 and 347, respectively) in ray cells as well as in tracheids. The contents of coniferin, p-coumaryl alcohol 4-glucoside, and quinic acid
(m/z 191) were overall greater in ray cells than in tracheids (see [coniferin2H]2, [coniferin1Cl]2, [p-coumaryl alcohol 4-glucoside2H]2, [p-coumaryl alcohol 4-glucoside1Cl]2, and a coniferin-sugar cluster ion {as [M92H]2, M9 5 summation of indi-vidual molecular mass of chemical cluster compo-nent species; [coniferin1Hex2H]2} in Table 2). Conversely, the contents of coniferyl aldehyde (m/z 177), malic acid ([malic acid2H]2;m/z133), and their two malic acid-sugar clusters ([malic acid1Hex2H]2 {m/z 313} and [malic acid1Hex22H]2 {m/z 475}), a-ketoglutaric acid (m/z145), fumaric acid (m/z115), and citric acid (m/z191) were larger in tracheids than in ray cells (Table 2). Using the analytical method, caf-feoylquinic acid, dihydroflavonol, leucodelphinidin, and Met were detected less frequently in both types of cells, whereas no detectable ionized signals were observed, for example, for any CoA conjugates, dihydroconiferin, and a-pinene in either of the cell types (Table 2).
DISCUSSION
Differentiation of xylem in conifers entails large changes in cellular biology, biochemistry, and tran-scriptome remodulation that lead to the formation of a thick secondary cell wall and lignification of xylem tracheids (Meents et al., 2018). In developing xylem of Norway spruce, the cell walls of ray parenchymal cells do not lignify (Marjamaa et al., 2003). They may lignify later during heartwood formation, as in Scots pine (Bergström 2003). The contribution of ray cells in monolignol biosynthesis was studied in this work. Samples for the LCM and metabolomic investigations were taken when secondary growth in Norway spruce was active (end of June in Finland, mid-April in Kumamoto, Japan). In southern Finland, xylem growth and lignification in Norway spruce starts in mid-May and continues until August (Marjamaa et al., 2003).
Figure 5. Coexpression subnetworks of tran-scription factors differentially expressed in de-veloping ray cells and tracheids. Red color indicates transcription factors more highly expressed in ray cells, and blue indicates those
more highly expressed in tracheids (Padj,0.01).
Solid lines indicate positive correlation, and dashed lines indicate negative correlation. Note that MA_95898g0010, which is more highly expressed in tracheids than in ray cells, is a
se-quence homolog ofPgNAC8.
Table 1.Ray-only-expressed genes that have no expression, or have normalized expression level below 1 (VST,1), in upright tracheids in de-veloping xylem of Norway spruce
NA, Not annotated.
Gene Identifier Uniprot Annotation PFAM annotation
RNA/DNA processing
MA_10436812g0020 Endoribonuclease Dicer homolog4 Helicase_C, dsRNA_bind
MA_136489g0010 ATP-dependent DNA helicase PcrA AAA_11, 19, UvrD-helicase
MA_222324g0010 ATP-dependent DNA helicase PcrA UvrD_C, UvrD_C_2, Viral_helicase1
MA_8906841g0010 NA UvrD-helicase
MA_953686g0010 DNA replication ATP-dependent helicase/
nuclease DNA2
NA
MA_4430g0020 Pentatricopeptide repeat-containing protein PPR, TPR
MA_4430g0010 Pentatricopeptide repeat-containing protein DYW_deaminase, PPR, TPR
MA_500770g0010 Pentatricopeptide repeat-containing protein ATP13, PPR,RasGEF_N
MA_77707g0010 Pentatricopeptide repeat-containing protein Clathrin, DnaB, PPR, RPN7, TPR
MA_56436g0010 Pentatricopeptide repeat-containing protein DYW_deaminase, PPR, TPR
MA_62181g0010 Pentatricopeptide repeat-containing protein PPR, RPN7, TPR
MA_11619g0010 Pentatricopeptide repeat-containing protein DYW_deaminase, MRP-S27, PPR, RPN7, TPR
MA_108603g0010 Pentatricopeptide repeat-containing protein PPR
MA_257729g0010 Pentatricopeptide repeat-containing protein Ank, Apc3, Clathrin, DUF3368, ECSIT, MRP-S27, PPR,
Rep_fac_C, TPR, TetR_C
MA_131437g0010 Putative pentatricopeptide repeat-containing
protein
DYW_deaminase, PPR, TPR
MA_10428974g0010 tRNA modification GTPase MnmE FeoB_N, GTP_EFTU, GTPase_Cys_C, MMR_HSR1
MA_8617598g0010 NA HEPN, TPR
MA_165131g0010 Nibrin BRCT, FHA, PTCB-BRCT
General enzymes
MA_38431g0010 Acetyl-CoA carboxylase1 CPSase_L_D2, CPSase_L_chain
MA_103379g0010 Biotin biosynthesis bifunctional protein BioWF Aminotran_1_2
MA_10435812g0010 Imidazole glycerol phosphate synthase hisHF GATase, GATase_3, GATase_5, Peptidase_C26, SNO
MA_89112g0010 Violaxanthin deepoxidase VDE
MA_193904g0010 NA Glyoxalase, Glyoxalase_2, Glyoxalase_4
MA_157164g0010 Rhodanese-like domain-containing protein4 NA
MA_74391g0010 NA DUF607, Nudix_N
Redox
MA_17680g0010 Cytochrome P450 p450
MA_10426917g0010 Uncharacterized protein At3g17611 DUF1412, Rhomboid, Rubredoxin
Carbohydrate related
MA_10435727g0010 1,4-a-Glucan-branching enzyme3 CBM_48
MA_863320g0010 Endoglucanase1 Glyco_hydro_9
MA_619336g0010 Hydroquinone glucosyltransferase Glyco_trans_1_3, UDPGT
MA_407162g0010 UDP-glycosyltransferase72B1 Glyco_tran_28_C, Glyco_trans_1_3, UDPGT
MA_10259759g0010 UDP-glycosyltransferase74E1 UDPGT
MA_10433786g0010 UDP-glycosyltransferase86A UDPGT
Receptor-like kinases
MA_118627g0010 LRR-like Ser/Thr-protein kinase BAM2 LRRNT_2, LRR
MA_420984g0010 Receptor protein kinase-like protein At4g34220 LRRNT_2, LRR
MA_203596g0010 Putative disease resistance protein At4g19050 LRR
Transcription factors
MA_379291g0010 NA AKNA
MA_18230g0010 NA zf-CCHC, zf-GRF
Transport
MA_559373g0010 Probable peptide/nitrate transporter PTR2, TRAP_beta
MA_135402g0010 Solute carrier family 15 member 1 MFS_1, PTR2
MA_9087020g0010 Vacuolar protein sorting-associated protein18
homolog
Pep3_Vps18, TPR
MA_162910g0010 WASH complex subunit 7 homolog NA
MA_10430993g0010 WASH complex subunit strumpellin Strumpellin
MA_739378g0010 HEAT repeat-containing protein6 DUF4042, HEAT, IFRD
MA_5424g0010 NA HEAT
Protease
MA_141320g0010 Protease Do-like8 Trypsin_2
(Table continues on following page.)
Developing Ray Cells Express Genes Encoding the Machinery for Lignin Biosynthesis and Contain Monolignols and Their Glucoconjugates
Ray cells have well-known roles in radial transport of water and nutrients and function as a storage com-partment for starch, lipids, and proteins (Höll, 1975; Witt and Sauter, 1994). In Scots pine, up to 40% of nonstructural carbohydrates are stored in the sapwood parenchyma, making it an important reserve of carbo-hydrates (Jacquet et al., 2014). In angiosperms, ray pa-renchyma acts as an efficient symplastic route for xylem-phloem communication, forming specific con-duits that support transport in longitudinal or radial directions (van Bel, 1990) and sustain xylem hydraulics and growth (Witt and Sauter, 1994). The transport function of rays is also essential for the cambium ac-tivity and for the survival of fusiform initials in the cambium (Lev-Yadun and Aloni, 1995).
The RNA-Seq data obtained strongly suggested that in developing xylem of Norway spruce, ray cells syn-thesize monolignols, since most of the biosynthesis pathway genes were expressed equally highly in both tracheids and ray cells (Fig. 4). Furthermore, coniferyl and p-coumaryl alcohol, some intermediates in their biosynthetic pathway, and their glucoconjugates were detected by picoPPESI-MS analysis in both ray cells and tracheids (Table 2), confirming the transcriptomic re-sults. As cell walls of ray parenchymal cells do not lignify in the growing season, it is probable that mon-olignols are transported to neighboring cells (upright and/or ray tracheids) and used there for cell wall lig-nification. Not only do ray cells possess the machinery
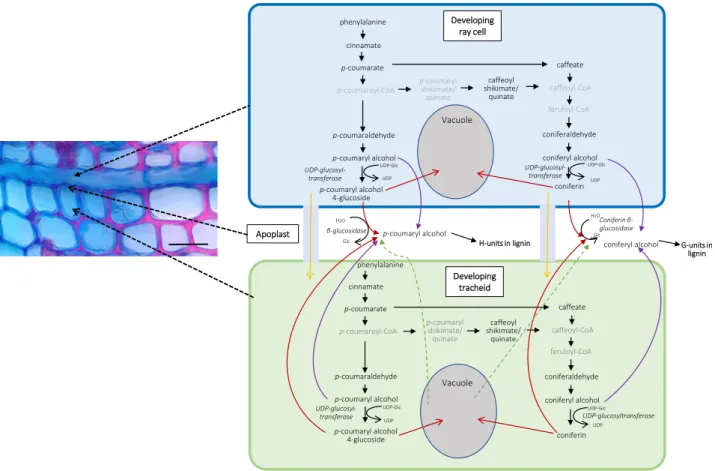
for monolignol biosynthesis but also a number of genes that encode transporter proteins, including several ABC transporters (with no significant difference in ex-pression between tracheids and ray cells). Some of these could encode transporter proteins in the plasma mem-brane, delivering monolignol alcohols to the apoplast of ray cells (Miao and Liu, 2010; Alejandro et al., 2012; Fig. 7). Monolignols would then need to diffuse through nonlignifying ray cell wall to the middle la-mella, where lignification starts, and to adjacent ligni-fying tracheid cell walls. This is apparently occurring in postmortem lignification shown to exist in tracheary elements ofZ. elegansand Arabidopsis (Pesquet et al., 2013; Smith et al., 2013, 2017). Alternatively, there is a possibility that monolignols produced by ray cells are transported to developing tracheids via a symplastic route (Fig. 7). Typically for conifers, rays in Norway spruce are one cell wide (uniseriate), and thus every ray cell is in contact with some tracheid cell (Fig. 1; Spicer, 2014). Pits are present in the cell walls of ray paren-chymal cells that are shared with tracheids (Spicer, 2014). In tomato (Solanum lycopersicum), intracellular injections of a fluorescent dye revealed symplasmic connections between livingfibers and adjacent ray pa-renchymal cells (van der Schoot and van Bel, 1990). Plasmodesmata also exist in pits located between de-veloping, still-living tracheids and neighboring ray cells in conifers (Sokołowska, 2013). These would potentiate symplasmic transport of monolignols from ray cells to developing tracheids. There, the ray-synthesized mon-olignols could be transported to the cell wall via the same system(s) used for tracheid-self-generated mon-olignols. Although tempting to speculate, the data Table 1.(Continued from previous page.)
Gene Identifier Uniprot Annotation PFAM annotation
MA_6458032g0010 Subtilisin-like protease Inhibitor_I9
MA_10427774g0040 NA RINGv
Proteins not characterized or of unknown functions
MA_8138125g0010 NA NA MA_211416g0010 NA NA MA_362689g0010 NA NA MA_10432337g0010 NA NA MA_164263g0010 NA NA MA_54857g0010 NA NA MA_68192g0010 NA NA MA_39199g0010 NA DUF3091 MA_76111g0010 NA NA MA_759716g0010 NA NA MA_10430932g0010 NA NA MA_2523991g0010 NA NA MA_70653g0010 NA NA MA_9999327g0010 NA NA MA_99743g0030 NA NA MA_10343198g0010 NA NA MA_763224g0010 NA NA MA_10110274g0010 NA NA MA_70531g0010 NA DUF1645
MA_8445490g0010 Uncharacterized protein sll1770 NA
MA_9440571g0010 NA NA
Tabl e 2. Lis t of metabo lites detec ted in ray cells and trachei ds using pi coPPESI -MS in neg ative ion mode Asteri sks indicat e sig nificant diff erences between the ra y cells (RC) and tr ac heid s (T R) as follo ws : *, P , 0.05 and ***, P , 0.00 1. Metabolite Molecular Fo rmula Ion Type Detected T h eoretical m/z a Signal Intensity P Relati ve Abundance b P Frequenc y of Detection c MS/MS R esults Shown in RC TR RC TR RC TR Mo nolignol path w ays Cinnami c acid or p -Co umar aldeh yde C9 H8O2 [M 2 H] 2 147.045 3.9. E 1 04 1. 4.E 1 05 0.359 0.019 0. 034 0.416 1111 11 11 p -Co umaric acid C9 H8O3 [M 2 H] 2 163.040 4.1. E 1 04 5. 0.E 1 04 0.749 0.015 0. 024 0.416 11 111 11 11 Supp leme ntal Figure S3A. 1 4-Coumar o yl-Co A C3 0H38N7 O18P3 S [M 2 H] 2 912.145 – – – – – – – – Caffeo yl-Co A C3 0H42N7 O19P3 S [M 2 H] 2 928.140 – – – – – – – – Ferul o yl-Co A C3 1H44N7 O19P3 S [M 2 H] 2 942.155 – – – – – – – – Caffeic aci d C9 H8O4 [M 2 H] 2 179.035 1.0. E 1 05 2. 7.E 1 05 0.392 0.045 0. 168 0.353 11 111 11 11 Supp leme ntal Figure S3A. 2 Caffeo yls hikimic acid C1 6H16O8 [M 2 H] 2 335.077 – – – – – – – – Caffeo ylqu inic acid C1 6H18O9 [M 2 H] 2 353.088 1.1. E 1 04 9. 3.E 1 03 0.912 0.005 0. 006 0.956 11 1 1 Conifer yl aldeh yde C1 0H10O3 [M 2 H] 2 177.056 3.0. E 1 04 1. 2.E 1 05 0.184 0.015 0. 041 0.101 1111 11111 Supp leme ntal Figure S3A. 3 Conifer yl alcohol C1 0H12O3 [M 2 H] 2 179.071 1.1. E 1 06 1. 5.E 1 06 0.705 0.527 0. 446 0.717 11 111 11111 Supp leme ntal Figure S3A. 4 p -Co umaryl alcohol C9 H10O 2 [M 2 H] 2 149.061 1.0. E 1 04 4. 4.E 1 04 0.033 0.005 0. 023 0.050 11 1 1 11 1 Supp leme ntal Figure S3A. 5 Conifer in C1 6H22O8 [M 2 H] 2 341.124 1.5. E 1 05 1. 3.E 1 05 0.872 0.055 0. 029 0.451 1 11 111 Supp leme ntal Figure S3A. 6 Conifer in C1 6H22O8 [M 1 Cl] 2 377.101 5.9. E 1 06 2. 6.E 1 06 0.296 2.415 1. 239 0.368 11 111 11 11 Supp leme ntal Figure S3A. 7 p -Co umaryl alcohol 4-gluco side C1 5H20O7 [M 2 H] 2 311.114 1.3. E 1 04 2. 7.E 1 03 0.480 0.004 0. 002 0.656 11 Supp leme ntal Figure S3A. 8 p -Co umaryl alcohol 4-gluco side C1 5H20O7 [M 1 Cl] 2 347.090 1.0. E 1 05 5. 3.E 1 04 0.494 0.043 0. 027 0.611 1111 111 Supp leme ntal Figure S3A. 9 Dih ydroco niferin C1 6H24O8 [M 2 H] 2 343.140 – – – – – – – – Dih ydroco niferin C1 6H24O8 [M 1 Cl] 2 379.117 – – – – – – – – Shiki mate and aroma tic amino acid path w ays Phosph o enol p yruv ic acid C3 H5O6 P [M 2 H] 2 166.975 2.7. E 1 04 4. 5.E 1 04 0.373 0.014 0. 019 0.575 1111 11 11 D -Erythros e 4-phosp horic acid C4 H9O7 P [M 2 H] 2 199.001 5.0. E 1 04 6. 0.E 1 04 0.833 0.033 0. 020 0.625 1111 11 11 Supp leme ntal Figure S3A. 10 3-Deh ydroqui nic acid C7 H10O 6 [M 2 H] 2 189.041 3.2. E 1 05 8. 9.E 1 05 0.134 0.137 0. 363 0.079 11 111 11111 Supp leme ntal Figure S3A. 11 Shikimat e-3-pho sphoric acid C7 H11O 8P [M 2 H] 2 253.012 – – – – – – – – 5-Eno l p yruv ylshi kimate C1 0H13O1 0P [M 2 H] 2 323.017 – – – – – – – – 3-P hospho ric acid (EPSP) Chorismi c aci d and prephe nic acid C1 0H10O6 [M 2 H] 2 225.041 6.1. E 1 02 1. 5.E 1 04 0.208 0.0004 0. 004 0.172 11 1 1 Supp leme ntal Figure S3A. 12 Fla vonoid pat hw ays ( Tabl e cont inue s on follow ing pag e. )
Tabl e 2. ( Continu ed from prev ious pag e. ) Metabolite Molecular Fo rmula Ion Type Detected T h eoretical m/z a Signal Intensity P Relati ve Abundance b P Frequenc y of Detection c MS/MS R esults Shown in RC TR RC TR RC TR Fla vanone C1 5H12O2 [M 2 H] 2 223.077 – – – – – – – – Sakur anetin or isosak ur ane tin C1 6H14O5 [M 2 H] 2 285.077 – – – – – – – – Dih ydrofla vonols C1 5H12O3 [M 2 H] 2 239.071 5.3. E 1 03 3. 2.E 1 04 0.373 0.003 0. 006 0.582 11 1 11 Leucoc yanid in or mela cacidin C1 5H14O7 [M 2 H] 2 305.067 – – – – – – – – Leucode lphini din C1 5H14O8 [M 2 H] 2 321.062 7.2. E 1 03 1. 4.E 1 04 0.571 0.003 0. 009 0.448 11 1 11 Leucofise tinidin or leuco pelargon i din C1 5H14O6 [M 2 H] 2 289.072 – – – – – – – – Leucope onidin C1 6H18O7 [M 2 H] 2 321.098 – – – – – – – – Or ganic acids Malic acid C4 H6O5 [M 2 H] 2 133.014 6.7. E 1 07 1. 6.E 1 08 0.067 29.866 72.346 0.001*** 11 111 11111 Quinic acid C7 H12O 6 [M 2 H] 2 191.056 2.2. E 1 08 2. 0.E 1 08 0.739 10 0.000 84.992 0.071 11 111 11111 Oxaloa cetic aci d C4 H4O5 [M 2 H] 2 130.999 7.5. E 1 03 5. 6.E 1 05 0.152 0.002 0. 332 0.152 1 11 111 Succini c aci d C4 H6O4 [M 2 H] 2 117.019 1.5. E 1 06 1. 9.E 1 06 0.619 0.683 0. 770 0.743 11 111 11111 Ascorbic acid C6 H8O6 [M 2 H] 2 175.025 4.7. E 1 06 5. 8.E 1 06 0.679 2.385 2. 654 0.828 11 111 11111 3-Phosp hogl yceric acid C3 H7O7 P [M 2 H] 2 184.986 2.9. E 1 05 3. 5.E 1 05 0.606 0.146 0. 181 0.555 11 111 11111 a -K eto glutaric aci d C5 H6O5 [M 2 H] 2 145.014 4.1. E 1 05 6. 8.E 1 05 0.197 0.170 0. 354 0.084 11 111 11111 Fumaric acid C4 H4O4 [M 2 H] 2 115.004 1.7. E 1 06 3. 5.E 1 06 0.160 0.751 1. 525 0.029* 11 111 11111 Citric acid C6 H8O7 [M 2 H] 2 191.020 4.1. E 1 06 2. 4.E 1 07 0.021* 2.052 12.433 0.040* 11 111 11111 Ca rboh ydr ate Hex C6 H12O 6 [M 2 H] 2 179.056 5.5. E 1 06 6. 0.E 1 06 0.716 2.454 2. 776 0.523 11 111 11111 Hex C6 H12O 6 [M 1 Cl] 2 215.033 1.3. E 1 07 1. 6.E 1 07 0.761 5.927 8. 840 0.549 11 111 11111 Hex 2 C1 2H22O1 1 [M 2 H] 2 341.109 1.1. E 1 07 1. 1.E 1 07 0.967 5.847 4. 506 0.528 11 111 11111 Hex 2 C1 2H22O1 1 [M 1 Cl] 2 377.086 2.7. E 1 06 4. 0.E 1 06 0.546 1.161 2. 521 0.292 11 111 11111 P ento se C5 H10O 5 [M 2 H] 2 149.046 5.4. E 1 06 6. 0.E 1 06 0.812 2.394 2. 382 0.982 11 111 11111 P ento se C5 H10O 5 [M 1 Cl] 2 185.022 5.9. E 1 03 4. 2.E 1 04 0.039 0.003 0. 023 0.075 11 1 1 1 Amin o aci ds Ser C3 H7NO3 [M 2 H] 2 104.035 5.4. E 1 04 5. 1.E 1 04 0.911 0.033 0. 021 0.499 11 111 11 11 Pro C5 H9NO2 [M 2 H] 2 114.056 2.9. E 1 05 1. 8.E 1 05 0.578 0.164 0. 056 0.239 11 111 111 V al C5 H11NO 2 [M 2 H] 2 116.072 1.6. E 1 05 1. 4.E 1 05 0.793 0.087 0. 057 0.500 11 111 11 11 T hr C4 H9NO3 [M 2 H] 2 118.051 1.9. E 1 05 1. 6.E 1 05 0.676 0.102 0. 078 0.516 11 111 11111 Leu, Ile C6 H13NO 2 [M 2 H] 2 130.087 3.0. E 1 05 2. 1.E 1 06 0.335 0.156 1. 911 0.334 11 111 11 11 Asp C4 H8N2O 3 [M 2 H] 2 131.046 1.2. E 1 05 1. 2.E 1 05 0.978 0.073 0. 036 0.453 1111 11 11 Asp C4 H7NO4 [M 2 H] 2 132.030 1.0. E 1 06 9. 6.E 1 05 0.875 0.604 0. 485 0.708 11 111 11111 Gln C5 H10N2O 3 [M 2 H] 2 145.062 2.1. E 1 06 1. 3.E 1 06 0.472 1.090 0. 409 0.196 11 111 11111 Glu C5 H9NO4 [M 2 H] 2 146.046 9.9. E 1 05 1. 1.E 1 06 0.752 0.513 0. 537 0.920 11 111 11111 Met C5 H11NO 2S [M 2 H] 2 148.044 1.0. E 1 04 3. 6.E 1 03 0.567 0.005 0. 001 0.430 11 His C6 H9N3O 2 [M 2 H] 2 154.062 8.3. E 1 04 7. 7.E 1 04 0.916 0.041 0. 025 0.448 1111 11111 Phe C9 H11NO 2 [M 2 H] 2 164.072 1.1. E 1 05 2. 4.E 1 05 0.368 0.053 0. 108 0.418 11 111 11111 Arg C6 H14N4O 2 [M 2 H] 2 173.104 2.7. E 1 04 7. 9.E 1 03 0.242 0.018 0. 003 0.153 11 1 11 Tyr C9 H11NO 3 [M 2 H] 2 180.067 1.1. E 1 05 1. 1.E 1 05 0.998 0.057 0. 028 0.410 1111 11 11 Trp C1 1H12N2 O2 [M 2 H] 2 203.083 8.3. E 1 04 1. 2.E 1 05 0.711 0.053 0. 032 0.624 1111 11 11 GAB A C4 H9NO2 [M 2 H] 2 102.056 7.5. E 1 04 4. 1.E 1 04 0.405 0.040 0. 015 0.171 11 111 11 11 ( Tabl e cont inue s on follow ing pag e. )
obtained in our experiments do not allow us to make any conclusion regarding the monolignol form (agly-cone/glycoconjugate) that is transported into the apo-plast in spruce. Expression of MA_8591669g0010, a sequence homolog for CONIFERIN b-GLUCOSIDASE of lodgepole pine (Pinus contorta; Dharmawardhana et al., 1995, 1999), was high in all samples studied in this work (normalized expression levels.7); however, there was a significantly higher expression in tra-cheids than in ray cells (fold change 2.85;Padj,0.05). In NorWood, this gene is highly expressed in develop-ing xylem durdevelop-ing secondary cell wall formation and programmed cell death (Jokipii-Lukkari et al., 2017; norwood.congenie.org), an observation supporting the idea that the enzyme has an important role for coniferyl alcohol liberation from coniferin for lignin biosynthesis. In gymnosperms, coniferin has been shown to accumulate in the cambial zone and the developing xylem during cambium reactivation (Freudenberg and Harkin, 1963; Savidge, 1989; Aoki et al., 2016). In Jap-anese cypress (Chamaecyparis obtusa), coniferin was detected in vacuoles of xylem tracheids at the beginning and in the middle phase of lignification (i.e. during the active formation of secondary cell wall layers), after which it disappears (Morikawa et al., 2010; Tsuyama et al., 2013). Proton gradient-dependent transport of coniferin was detected in membrane vesicles prepared from differentiating xylem of hybrid poplar (Populus sieboldii3Populus grandidentata) and Japanese cypress, but this transport was across the tonoplast and endo-membrane compartments (Tsuyama et al., 2013). It is possible that some glycoconjugates are stored in the vacuole, to be used for cell wall lignification later once the vacuole disrupts (Meents et al., 2018; Fig. 7). Al-ternatively, they are used as defense compounds in case of pathogen attack (Wang et al., 2013). In a feeding experiment with lodgepole pine seedlings, radiolabeled Phe was not incorporated into coniferin; however, the secondary cell walls of tracheids were strongly labeled (Kaneda et al., 2008). The data suggest a direct route from coniferyl alcohol to the lignin polymer. Also, ray cells had heavy labeling, but inhibitor experiments suggested that most label in ray cells incorporated into proteins. Some label, however, was also incorporated into phenylpropanoids in ray cells, indicating their participation in monolignol production (Kaneda et al., 2008). The effects of osmotic potential differences and/ or wounding in the experiments by Kaneda et al. (2008), done with cut tissue sections immersed in 0.2 M Suc solution, could have affected the metabolome of the cells. In this respect, our in situ picoPPESI-MS ap-proach, with careful consideration of the plant water status, minimizes the effect of tissue disturbance on the metabolome (Supplemental Fig. S4).
In addition to lignin formation, coniferyl alcohol, the main monolignol in Norway spruce, can be utilized for lignan synthesis. Lignans are optically active phenolic dimers and have various antioxidant effects (Hudgins et al., 2003). They are present in Norway spruce, espe-cially in the knotwood (bases of branches), where they
Tabl e 2. ( Continu ed from prev ious pag e. ) Metabolite Molecular Fo rmula Ion Type Detected T h eoretical m/z a Signal Intensity P Relati ve Abundance b P Frequenc y of Detection c MS/MS R esults Shown in RC TR RC TR RC TR Peptide Glutathio ne C1 0H17N3 O6S [M 2 H] 2 306.077 6.1. E 1 05 8. 1.E 1 05 0.645 0.313 0. 317 0.979 11 111 11111 Terpe noids Abietic acid C2 0H30O2 [M 2 H] 2 301.217 7.7. E 1 06 7. 7.E 1 06 0.996 4.071 4. 575 0.921 11 111 11 11 a -Pi nene C1 0H16 [M 2 H] 2 135.118 – – – – – – – – Clus ter ions Malic acid 1 He x C1 0H18O1 1 [M 2 H] 2 313.078 6.6. E 1 05 9. 0.E 1 06 0.219 0.290 2. 258 0.069 11 111 11111 Malic acid 1 He x2 C1 6H28O1 6 [M 2 H] 2 475.130 2.4. E 1 06 4. 1.E 1 06 0.286 1.093 2. 474 0.152 11 111 11111 Quinic acid 1 Hex C1 3H24O1 2 [M 2 H] 2 371.119 2.6. E 1 07 2. 4.E 1 07 0.858 10.529 12.679 0.666 11 111 11111 Quinic acid 1 Hex 2 C1 9H34O1 7 [M 2 H] 2 533.172 3.1. E 1 07 1. 7.E 1 07 0.298 11.558 9. 478 0.686 11 111 11111 Conifer in 1 He x C2 2H34O1 4 [M 2 H] 2 521.188 1.3. E 1 05 – 0.337 0.039 – 0.323 11 — Conifer in 1 He x2 C2 8H44O1 9 [M 2 H] 2 683.240 1.3. E 1 05 1. 0.E 1 05 0.852 0.041 0. 019 0.528 11 1 1 Malic acid 1 con iferin C2 0H28O1 3 [M 2 H] 2 475.146 1.7. E 1 05 2. 8.E 1 03 0.325 0.052 0. 001 0.306 11 1 Quinic acid 1 coni ferin C2 3H34O1 4 [M 2 H] 2 533.188 2.1. E 1 06 5. 5.E 1 05 0.360 0.733 0. 272 0.432 11 1 11 a All th e th eoretical values ar e qu oted fro m Metlin (ht tp://me tlin.scr ipps.edu /index. php). b V alues were cal culated as a per cen tage of the bas e pea k. c Signal detec ted ( 1 ); signal not detec ted ( 2 ). Frequ encies of det ection ( x ) in eight to nine indi vidu al measu remen ts are indi cated as foll o ws: 11111 , 80% , x , 10 0%; 1111 , 60% , x , 80%; 111 , 40% , x , 20%; 11 , 20% , x , 40 %; 1 ,0 % , x , 20%.
accumulate in large amounts and protect tissues against microbial attack (Willför et al., 2003, 2005; Piispanen et al., 2008). Small amounts of lignans have also been detected in the sapwood, but the amounts were clearly lower (less than 0.05% [w/w]) than in the knotwood (up to 15% [w/w]; Willför et al., 2005). In our analysis, no lignans (or other dilignols/oligolignols or their glycoconjugates) were reproducibly detected in either of the cell types. Hence, the ray cell-originated coniferyl alcohol seems to be used predominantly in the lignifi -cation of cell walls of upright tracheids and/or those of ray tracheids.
Transcription Factors Regulating Secondary Cell Wall Biosynthesis Have High Expression Levels in Both Upright Tracheids and in Ray Cells
Norway spruce sequence homologs of PgNAC7 (MA_6777g0010) and MYB transcription factorsPtMYB8
and PtMYB1 (MA_139238g0010 and MA_62361g0010,
respectively), suggested by earlier studies to be the main transcriptional regulators for secondary cell wall for-mation in loblolly pine (Bomal et al., 2008; Duval et al., 2014), had high expression in both ray cells and tracheids (Fig. 4; Supplemental Table S3). The transcription factor
encoded by MA_62361g0010 was recently identified as a regulator likely to control seasonal lignification in Norway spruce together with another MYB (MA_9483804g0010) and a transcription factor, Asymmetric Leaves2/Lateral Organ Boundaries (MA_10434782g0020; Jokipii-Lukkari et al., 2018). In our study, all of these genes had high expression in all sample types (normalized expression level . 6.2), with no significant difference in expression between ray cells and tracheids. The observation that the genes en-coding putative central regulators of secondary cell wall biosynthesis also have high expression in ray cells is interesting, as many of these transcription factors not only regulate lignin biosynthesis but also that of the cell wall polysaccharides. It is possible that repressors similar to VND-INTERACTING2 (VNI2; Yamaguchi et al., 2010) are preferentially present in developing ray cells. The absence of a clear VNI2homolog in the spruce genome annotation (highest identity of 60% to At5g13180) prevented this hypothesis from being tested. A previous study that utilized an extracellular lignin-forming cell culture of Norway spruce as a model for lignin biosynthesis had generated a gene coexpression network containing several transcription factors that were discussed as candidate regulators of monolignol biosynthesis (Laitinen et al., 2017). The present RNA-Seq data obtained using cells of developing xylem Figure 6.PicoPPESI-MS negative ion mode mass spectra directly obtained from ray cells (RC) and tracheids (TR) in semi-intact
Norway spruce plants. Data are representative of similar experiments with eight to nine cells in each cell type.
showed that out of theNACandMYB candidate genes identified in the tissue culture study, only oneNACgene, MA_139896g0010, had a moderate expression level in rays and tracheids (normalized expression level of 2.4–2.8). Two genes encoding abscisic stress-ripening protein (MA_60383g0010 and MA_773806g0010), on the other hand, were quite highly expressed (normalized ex-pression levels of 6.6–7.3 and 4.4–5.2, respectively), sup-porting that further studies are needed to resolve the role of this comparatively understudied transcription factor family in wood development. Additionally, two genes encoding (1) an ethylene-responsive transcription factor (MA_98464g0010; normalized expression level of 3.9–6) and (2) a TIFY transcription factor (MA_10427283g0030; normalized expression level of 1.5–2.3) warrant further attention in relation to wood development.
Many Genes Encoding Oxidative Enzymes Are Highly Expressed in Ray Cells
In Arabidopsis, both laccases and peroxidases have been shown to contribute to lignin biosynthesis by
oxidizing monolignols to radicals that couple non-enzymatically (Berthet et al., 2011; Novo-Uzal et al., 2013; Zhao et al., 2013; Shigeto and Tsutsumi, 2016). In a Norway spruce cell culture that produces extracellular lignin (Kärkönen et al., 2002), however, peroxidases seem to have a major role in monolignol activation, as scavenging of apoplastic hydrogen peroxide efficiently hindered extracellular lignin formation (Laitinen et al., 2017). In a recent study in Norway spruce, several
LACCASE genes and threePEROXIDASEgenes were
detected to coexpress with monolignol biosynthesis genes proposed as candidates for seasonal lignifi ca-tion (Jokipii-Lukkari et al., 2018). According to our study, most of the genes identified by Jokipii-Lukkari et al. (2018), and many otherLACCASEand PEROXI-DASEgenes, had no significant difference in expres-sion between developing ray cells and tracheids (Supplemental Table S4), suggesting that the proteins are synthesized in both cell types.PEROXIDASEgenes MA_91956g0010 and MA_10430775g0010, however, had expression levels significantly higher in tracheids as compared with ray cells (2.6- to 3.1-fold;Padj,0.05). The latter gene is strongly up-regulated (fold change Figure 7. Putative lignin biosynthesis route in Norway spruce developing xylem based on single-cell metabolomics. Red arrows
indicate transport of monolignol glucosides through the membrane via, for example, secondary active transport based on a proton gradient. Purple arrows indicate transport of monolignol alcohols through the membrane via, for example, ABC transporters (Miao and Liu, 2010; Alejandro et al., 2012). Yellow arrows indicate transport of monolignol glucosides to a neighboring cell via plasmodesmata. Green arrows indicate liberation of monolignol glucosides into the apoplast after vacuolar collapse. Monolignol
names in gray were not detected. Bar550mm.
20.8) in the lignin-forming cell culture of spruce during lignin formation (Laitinen et al., 2017). Six PEROXI-DASEs, on the other hand, were more highly expressed in ray cells than in tracheids (Padj,0.05; Supplemental Table S4). Among these, MA_10432865g0020 (PaPX2; Marjamaa et al., 2006) was highly expressed in all sample types and was four times more highly expressed in ray cells than in tracheids (Supplemental Table S4). PaPX2 was observed to have the highest expression in the previous year’s late xylem (Jokipii-Lukkari et al., 2017; norwood.congenie.org). In an earlier study of a xylem sample collected in late sum-mer, transcripts of PaPX2 were detected by in situ hybridization in tracheids but not in ray cells (Marjamaa et al., 2006). Additionally, PaPX2 expres-sion is responsive to the pathogenic fungus Hetero-basidium annosumand to developmental stress, being present, for example, during compression wood for-mation (Koutaniemi et al., 2007). Sequence homology comparisons of these Norway spruce peroxidases against Arabidopsis peroxidases with known associ-ation with lignin polymerizassoci-ation (AtPrx2/4/25/52/ 64/71/72; Herrero et al., 2013; Novo-Uzal et al., 2013; Shigeto et al., 2015; Zhong and Ye, 2015) did not identify homologs, as the nucleotide and amino acid sequences of the Norway spruce peroxidases are highly diverged from those of Arabidopsis, with similarities only in the active sites.
As genes encoding many peroxidases and laccases were equally highly expressed in both cell types, it is likely that products of LACCASE and PEROXIDASE genes expressed in ray cells are secreted into the cell wall of ray cells, from where some of them diffuse in the apoplasticfluid into the developing tracheid cell walls, where they function in the oxidative polymerization of coniferyl alcohol. However, a recent study in Arabi-dopsis showed that a lignification-related laccase, LAC4, was mobile in the primary cell wall but non-mobile in the secondary cell wall, suggesting that it was anchored to the secondary cell wall (Chou et al., 2018). Conifer laccases in native, glycosylated form are larger (70–120 kD; Koutaniemi et al., 2015) than peroxidases (35–60 kD; Koutaniemi et al., 2005). It is possible that peroxidases but not laccases are small enough tofit into the cell wall pores of partially lignified cell walls and can therefore move in the apoplastic fluid. Al-ternatively, laccases may be attached to some sec-ondary cell wall components (Chou et al., 2018). Hence, it seems likely that the parenchymatous ray cells are not only participating in tracheid cell wall lignification by synthesizing monolignols but also by producing the enzymes (e.g. peroxidases) acting in the polymerization step.
Developing Ray Cells Express a Set of Genes Not Expressed in Tracheids
Ray cells contained a specific set of genes not expressed in tracheids (Table 1; Supplemental Table
S6). These ray-cell-only-expressed genes included
several putative PENTATRICOPEPTIDE REPEAT
(PPR) protein genes. Additionally, there were sixPPR genes that were expressed in both rays and tracheids, with a low expression level in tracheids (0.09–0.42; Supplemental Table S6). These nucleus-encoded pro-teins influence gene expression in chloroplasts and mitochondria by affecting RNA sequence, turnover, processing, or translation (Barkan and Small, 2014). Thus, they have vital effects on organelle biosynthesis and function. The enriched expression of these genes in ray cells suggests that active biogenesis of organelles occurs in developing ray cells. PPR-defective pheno-types are often associated with retarded growth, seed-ling lethality, or cell wall abnormalities, suggesting that the absence of the PPR-sustained regulation results in shortages in energy supply from mitochondria or chloroplasts (Barkan and Small, 2014). This has been verified with cotton (Gossypium spp.) transformants, where the absence of a mitochondria-targeting se-quence in a PPR gene, Gh_A03G0489, resulted in di-minished fiber wall thickening. The phenomenon is connected with the immature fiberlocus, which is also associated with mitochondrial functioning (Thyssen et al., 2016).
Three UDP-GLYCOSYLTRANSFERASEs were
de-tected among the ray-only-expressed genes (Table 1; Supplemental Table S6). In Arabidopsis, a protein encoded by the xylem-expressed
UDP-GLYCOSYL-TRANSFERASE72B1 has been shown to make
mono-lignol glucoconjugates (Lin et al., 2016). A knockout of this gene led to strong up-regulation of genes involved in monolignol biosynthesis and polymerization, lead-ing to ectopic and excessive lignification, suggesting that the enzyme is important for normal cell wall lig-nification (Lin et al., 2016). Since monolignol alcohols are toxic to plant cells (Väisänen et al., 2015), it is probable that monolignols produced by ray cells are glycosylated before transport into the cell wall of neighboring tracheids, especially if the transport to the neighboring cell occurs via the symplastic way (see above; Fig. 7). However, as coniferin and p-coumaryl alcohol glycoside were detected in both tracheids and ray cells (Table 2), it is likely that the same enzyme catalyzes the conjugation of monolignols to sugar moieties in both cell types.
CONCLUSION
In developing xylem of Norway spruce, ray paren-chymal cells and developing upright tracheids show highly similar expression for most of the genes in the shikimate, Phe, phenylpropanoid, and monolignol pathways. Metabolome analysis of the cell sap of single tracheids and ray cells of semi-intact plants showed the presence of coniferyl andp-coumaryl alcohols and their glycoconjugates, as well as many of the monolignol biosynthesis pathway intermediates in both cell types. Only a few of the highly expressed genes encoding
oxidative enzymes (peroxidases and laccases) differed significantly in expression between these cell types,
whereas the majority of the PEROXIDASE and
LACCASEgenes had no significant difference in ex-pression. These data suggest that, in addition to the well-described functions in storage and radial trans-port, developing ray cells contribute not only to monolignol biosynthesis but also to the machinery for lignin polymerization needed for cell wall lignification in tracheids. The analysis of transcription factor net-works suggests that tracheids and ray cells have some differences in the regulation of expression of genes encoding enzymes leading to phenolic compounds. The LCM approach allowed identification of a set of transcripts in ray cells, with no detectable presence in tracheids. These encoded, for example, putative pen-tatricopeptide repeat proteins and proteins related to carbohydrate metabolism and transport, suggesting an active developing ray cell metabolism. These findings have advanced our understanding of the process of lignification, its regulatory mechanisms, and spatial organization.
MATERIALS AND METHODS Plant Material and Cryosectioning for Transcriptomic Analysis
Cryosections of developing xylem of Norway spruce (Picea abies) were prepared from two approximately 40-year-old trees (clone no. E8504) felled during the active growth season (June 2014 and 2015) in Ruotsinkylä, southern Finland. Trunk discs were immediately frozen in liquid nitrogen and stored at
280°C. Cryosectioning was performed as described previously (Blokhina et al., 2017). Briefly, frozen stem discs were quickly (in approximately 1 min) sawn at room temperature into approximately 0.9-30.9-38- to 10-cm strips. Special care was taken to avoid thawing: the strip was briefly immersed in liquid nitrogen for 5 to 10 s and then sawn into 0.9-30.9-30.9-cm cubes. During sawing, the surface temperature of the blocks, as assessed with a surface ther-mometer, did not rise above250°C. Sawn cubes were immediately mounted in a tissue-freezing medium, and 30- to 40-mm-thick tangential cryosections of developing xylem were cut in the cryotome (Leica, CM 3050 S) at224°C and collected on glass slides (three to four sections per slide). After two consecutive
fixation steps (70% [v/v] ethanol at224°C and 100% ethanol at room tem-perature, in a laminarflow cabinet), sections were dried for 30 to 40 min in aseptic conditions and stored up to a maximum of 1 week in air-tight 50-mL Falcon tubes at280°C prior to LCM. Duringfixation, the cryosections were gentlyflattened with a pipette tip to ensure successful laser dissection. The developing xylem was determined to be approximately 600mm thick with 16 to 18 layers of lignifying cells as described by Blokhina et al. (2017). This parameter was determined separately from a 20-mm cross section stained with a mixture of 0.5% (w/v) Safranine O and 0.5% (w/v) Alcian Blue (1:1 in 50% [v/v] ethanol) for lignin (red) and cellulose (blue), respectively (Fig. 1). During collection of tangential sections for LCM, care was taken not to exceed the determined thickness of developing xylem, and routinely, after adjusting and trimming the block, four sections only (total thickness 120–160mm) were collected from each cube.
LCM
Fixed cryosections were allowed to reach ambient temperature inside Falcon tubes to avoid condensation onto the slides. Dissection of developing ray cells and upright tracheids was performed by the Zeiss PALM MicroBeam LCM system with the following parameters: cut energy 60 to 65; LPC energy 10 to 30; cut speed 20 to 30; focus 65 to 70; and focus delta22. The parameters are slide and cell type specific, and hence, small adjustments were performed when needed. Theflatness of the section was crucial for successful cutting and
catapulting (Blokhina et al., 2017). Ray cells and tracheids were collected sep-arately into 500-mL adhesive cap tubes (Carl Zeiss), and the tubes were snap frozen in liquid nitrogen and stored at–80°C until RNA isolation. Special care was taken to exclude resin ducts and ray tracheids from the dissected cells used for RNA isolation (Supplemental Fig. S1). To avoid RNA degradation, each slide and the adhesive cap tube were used for microdissection for no more than 1.5 h, and RNase-free conditions were maintained throughout the cry-osectioning and the LCM steps. Specific cell types collected during many LCM sessions were used for RNA isolation to achieve the adequate yield of RNA. The average area per each sample where RNA was isolated was 0.2 to 0.4 mm2. RNA from the following samples was prepared for the next-generation se-quencing: ray parenchymal cells (excluding ray tracheids and resin ducts), upright tracheids, and whole sections of developing xylem including all cell types (tracheids, ray parenchymal cells, ray tracheids, and resin duct epithelial cells).
RNA Isolation and Next-Generation Sequencing
Total RNA was isolated with an RNeasy Plant Mini Kit (Qiagen, 74904) according to the manufacturer’s instructions. Final elution of RNA was per-formed with 30mL of RNase-free water, after which RNA was quantified by Qubit Fluorometer v. 1.27. RNA quality was assessed by an Agilent 2100 Bio-analyzer using the Eukaryote Total RNA Pico kit with picogram sensitivity.
RNA from three replicates of ray cells and tracheids, and from four replicates of whole sections of developing xylem, was sequenced. Next-generation se-quencing was performed in the Functional Genomics Unit, Biomedicum Hel-sinki, University of Helsinki in Illumina NextSeq Mid output 23150 bp. The SMARTer Ultra Low Input RNA Kit for Sequencing v. 3 was used to generate high-quality cDNA compatible with the Illumina Nextera XT DNA Sample Preparation Kit.
Preprocessing of RNA-Seq Data and Differential Expression Analyses
The data preprocessing was performed as described at http://www. epigenesys.Eu/en/protocols/bio-informatics/1283-guidelines-for-rna-seq-data-analysis. Briefly, the quality of the raw sequence data was assessed using FastQC (http://www.bioinformatics.babraham.ac.uk/projects/fastqc/). Residual rRNA contamination was assessed andfiltered using SortMeRNA v. 1.9 (Kopylova et al., 2012; settings -n 8 -a 8 -v) using the rRNA sequences provided with SortMeRNA (rfam-5s-database-id98.fasta, rfam-5.8s-database-id98.fasta, silva-arc-16s-database-id95.fasta, silva-bac-16s-database-id85.fasta, silva-euk-18s-database-id95.fasta, silva-arc-23s-database-id98.fasta, silva-bac-23s-database-id98.fasta, and silva-euk-28s-database-id98.fasta). The data were thenfiltered to remove adapters and trimmed for quality using Trimmomatic v. 0.32 (Bolger et al., 2014; settings TruSeq3-PE-2.fa:2:30:10 LEADING:3 SLIDINGWINDOW:5:20 MINLEN:50). After bothfiltering steps, FastQC was run again to ensure that no technical artifacts were introduced. Filtered reads were aligned to the Norway spruce genome v. 1 (retrieved from the ConGenIE resource; Sundell et al., 2015) using STAR v. 2.4.0f1 (Dobin et al., 2013; nondefault settings: –outSAMstrandField intronMotif–
readFilesCommand zcat–outSAMmapqUnique 254–quantMode TranscriptomeSAM– outFilterMultimapNmax 100–outReadsUnmapped Fastx–chimSegmentMin 1–outSAMtype BAM SortedByCoordinate–outWigType bedGraph– alignIntronMax 11000). Reasons for the use of the draft Norway spruce ge-nome are explained in the next paragraph. The annotations obtained from the Norway spruce v. 1.0 GFFfile contain only one transcript per gene model, and as such, did not need to be modified to generate synthetic gene models. This GFFfile and the STAR read alignments were used as input to the HTSeq (Anders et al., 2015) htseq-count python utility to calculate exon-based read-count values. The htseq-read-count utility takes only uniquely mapping reads into account. Statistical analysis of single-gene differential expression between conditions was performed in R v. 3.2.3 using the Bioconductor v. 3.2 (Gentleman et al., 2004) DESeq2 package v. 1.10.1 (Love et al., 2014). False discovery rate-adjustedPvalues were used to assess significance; a common threshold of 1% was used throughout. For the data quality assessment and visualization, the read counts were normalized using a VST as implemented in DESeq2. The biological relevance of the data (e.g. biological replicate similarity) was assessed by principal component analysis and other visuali-zations (e.g. heat maps) using custom R scripts. One of the ray cell samples, S1-ray-cells, had very different characteristics from the other samples; this could be related to technical issues during the sample preparation. As a