R E S E A R C H
Open Access
Assessment of the nevirapine safety signal
using data from the national antiretroviral
dispensing database: a retrospective study
Francis Kalemeera
1*, Assegid T. Mengistu
2and Johannes Gaeseb
3Abstract
Background:Clinical trials showed a higher risk of skin- and liver- related adverse reactions when NVP-based antiretroviral therapy (ART) was initiated in female and male patients with baseline CD4 cell counts≥250 and≥400, respectively. Some studies reported no difference in risk between the high and low CD4 count groups. Consequently, the use of NVP-based ART in all patients with a CD4 cell count <350, was recommended. In 2011, the Pharmacovigilance Centre detected an increase in reports of grade III and IV reactions. The center was required to determine if there was an increase in NVP-related reactions.
Methods:Automated dispensing records from January 2008 to November 2011 were accessed from the National Antiretroviral Dispensing Database (NDB). Records of patients who were initiated on NVP-based ART were selected, and records showing a replacement of NVP with protease inhibitor (PI) were identified. The proportions of grade III and IV reactions were calculated per quarter, and Odds Ratios (OR) were calculated, with the confidence interval set at 95 % and a p-value of <0.05.
Results:From 2008 to 2011 a total of 84,741 patients were started on ART. Of these 67,794 were initiated on NVP-containing ART. Of these, 211 females and 79 males were substituted from NVP to a PI. The OR for females was 2.4 (95 % confidence interval [CI] 1.8–3.1). For males the OR was 2.4 (OR 2.4; 95 % CI 1.4–3.8) which occurred nine months after the change observed in the females. The odds of a NVP-to-PI substitution in females compared to males before the launch of Namibia’s 2010 ART guidelines was the same as the odds after the publication of the guidelines (before, OR 1.6; 95 % CI 1.1–2.5; after, OR 1.6; 95 % CI 1.2–2.2).
Conclusions:There was an increase in substitutions of NVP with a PI following the increase in the CD4 threshold for initiating NVP-based HAART, meaning that there was an increase in grade III and IV reactions associated with NVP. Therefore the NVP-safety signal was confirmed to be a true signal, which contributed to the Ministry’s decision to review the use of NVP.
Keywords:Nevirapine, Reaction ratio, Proportional reaction ratio, Adverse reaction, Signal, Skin, Liver, Grade III, Grade IV
Background
Guidelines on managing NVP-related adverse reactions Nevirapine (NVP) is a non-nucleoside reverse transcriptase inhibitor (NNRTI) used in combination with other anti-retroviral medicines for the treatment of people infected with the human immunodeficiency virus (HIV) [1]. The use of NVP-containing antiretroviral therapy (ART) has
proven its worth as evidenced by the significant reductions in HIV-associated morbidity and mortality in regions where NVP-containing ART regimens were preferred [2]. Never-theless, NVP is known to cause adverse reactions (AR) on the skin and in the liver, which necessitate NVP’s substitu-tion if the reacsubstitu-tion is severe or persists without resolusubstitu-tion. Namibia’s ART guidelines have consistently recommended the continuation of NVP, with observation, for the patient who experienced a grade I AR to NVP; the substitution of NVP with efavirenz for the patient who experienced a grade II AR; and the substitution of NVP with lopinavir/ritonavir
* Correspondence:fkalemeera@unam.na
1School of Pharmacy, Faculty of Health Sciences, University of Namibia,
Windhoek, Namibia
Full list of author information is available at the end of the article
(LPV/r) a protease inhibitor, for the patient who experi-enced grade III or IV ARs to NVP [3] (See Table 1).
NVP-use recommended in ART naïve patients with high baseline CD4 cell counts
NVP’s prescribing information has for long recommended the avoidance of NVP in women and men with CD4 cell counts≥250 and ≥400 cells/mm3 respectively. This safety measure was devised to reduce incidences of serious NVP-related AR on the skin and in the liver [4]. Over the years, this safety measure was countered by a number of studies that have suggested that the incidence of NVP-related skin and liver AR in patients with high baseline CD4 cell counts – ≥250 in females and ≥400 in males– was not different from the incidence in patients with low baseline CD4 counts [5–12]. On the contrary, results from other similar studies maintained that the incidence of NVP-related skin and liver reactions was higher in patients starting NVP-based antiretroviral therapy (ART) at high baseline CD4 cell counts than in patients with low base-line CD4 counts [13–17]. Nevertheless, based on the then available evidence, the World Health Organisation (WHO) recommended the use of NVP-based ART in all patients with a CD4 cell count <350 cells/mm3, includ-ing ART naïve females with a CD4 count >250 but <350cells/mm3 [1]. In 2010, Namibia’s Ministry of Health and Social Services (MoHSS) launched the Third Edition of the National Guidelines for ART, which emu-lated the WHO’s ART guidelines in regards to the threshold CD4 count for initiating ART, and the pre-ferred first line ART regimen, namely: tenofovir (TDF)/ lamivudine (3TC) and NVP [3]. Also, the guidelines rec-ommended close monitoring of liver function and careful examination of skin and mucosal surfaces of patients dur-ing the first weeks of NVP-containdur-ing ART, especially for females with baseline CD4 counts greater than 250 cells/ mm3[1, 3]. (See Table 1).
Detection of a significant increase in spontaneous reports of grade III and IV AR related to NVP: Signal detection About one year after the launch of Namibia’s 2010 ART Guidelines the Therapeutics Information and Pharmacov-igilance Centre (TIPC) carried out an analysis of the
spontaneous AR reports. They compared the numbers and proportions of reports that were received from 2008 to 2010–that is before the 2010 ART guidelines–with those that were received in 2011. The results showed a statisti-cally significant increase in the reports of grade III and IV skin and liver reactions associated with NVP in 2011 com-pared with previous years (2008 to 2010) (p< 0.0001). In contrast to this result, there was no change in the frequency of grade I and II reactions (P= 0.16) between the periods. TIPC concluded that the increase in frequency of NVP-related grade III and IV reactions was a signal of the in-crease in grade III and IV ARs associated with NVP [18]. (See Appendix 1: Table 5 for the results obtained during the signal detection phase of NVP-safety analysis, and Appendix 2: Table 6 for the statistical significance of the results). The skin- and liver- related reactions reports for NVP were compared with EFV-related reaction reports. This comparison showed that there was no change in the EFV-related reports, proving that the increase in reaction reports was unique to NVP. Similarly, the number of re-ports for EFV and NVP were compared with the number of reports for other medicines. This comparison showed that the increase in reports in 2011 was a finding unique to NVP. The within medicine comparison (NVP before and NVP after the 2010 ART guidelines) and the between medicine comparisons were done using Reaction Ratio, and Proportional Reaction Ratio [18]. (See Appendix 3: Tables 7 and 8 for the comparisons between NVP related reaction reports before and after the 2010 ART guidelines, and for the comparison between other medicines and EFV, and NVP).
The need to confirm or dispel the NVP-safety signal: TIPC’s mandate
Since the above findings were based on spontaneous re-ports that were sent to the pharmacovigilance center vol-untarily no conclusions could be drawn about the frequency of grade III and IV reactions at clinic level. (See the legend of Appendix 1: Table 5 for the actual reactions that were reported to TIPC.) The clinical importance [19] of these reactions required the TIPC to carry out further analysis to generate evidence that would confirm or dispel the NVP safety signal.
Table 1Namibia ART guidelines 2008, 2010, and 2014 on the Use of NVP and response to NVP-related adverse reactions
Year of Guidelines CD4 count threshold for ART initiation
Preferred ART regimen Response following NVP-related adverse drug reaction (skin and liver)
Recommended Second Line ART Pre-2008 <200cells/mm3 D4T/3TC/NVP •Grade I observe, add some medicine TDF/3TC/LPV/r 2008 <200cells/mm3 AZT/3TC/NVP TDF/3TC/LPV/r 2010 ≤350cells/mm3 TDF/3TC/NVP •Grade II, replace NVP with EFV TDF/3TC/AZT/LPV/r
•Grade III or IV, replace NVP with LPV/r
2014 ≤500cells/mm3 TDF/FTC/EFV Left blank–focus is placed on NVP AZT/FTC/LPV/r
In this paper we present the objectives methods, and results that were generated from the research activity that TIPC undertook to assess the NVP-safety signal. Also, we present the discussion of the findings, and highlight the associated policy changes that followed. We believe that this paper demonstrates that local phar-macovigilance activities, based on locally generated data are beneficial to local populations.
Objective
The objective of this assessment was to find out if the in-crease in spontaneous reports of grade III and IV reac-tions associated with NVP was a true reflection of an increase in grade III and IV reaction events at clinic level. We set out to estimate the incidence of substitution of NVP with a protease inhibitor (PI) during the period 2008 to 2011 and to determine if any increase detected was sta-tistically significant.
Methods
Automated antiretroviral (ARV) medicine dispensing re-cords for adult patients who were newly started on ART during the period January 1 2008 to November 30, 2011 were accessed from the National Antiretroviral Dispens-ing Database. The proportion of records that showed the substitution of NVP with a PI per quarter from January 2008 to November 2011 was calculated. Comparisons between and within gender were made using the Odds Ratio, Proportional Reporting Ratio, and Reporting Ra-tio, with the confidence interval and statistical signifi-cance set at 95 % and a p-value of <0.05, respectively. (In this paper the substitution of NVP with a PI is fre-quently referred to as a NVP-to-PI substitution. The PI that was mainly used is LPV/r).
Ethical approval
Patient consent was not sought because antiretroviral data was sourced from existing databases and clinical re-cords without requiring additional information directly from patients. ART dispensing data was captured in the national database housed in the Ministry of Health and Social Services’ Division of Pharmaceutical Services. Only TIPC staff members mandated by the MoHSS to implement medicines safety analyses were involved in the medical record abstraction process and in the epi-demiological study considered to be a public health ac-tivity. Confidentiality was observed.
Results Frequency
A total of 84 741 patients were initiated on ART from Janu-ary 2008 to November 2011. Of these, 67 794 were initiated on a NVP-containing regimen. For 290 patients NVP was substituted with a PI (Fig. 1). The period from the start of
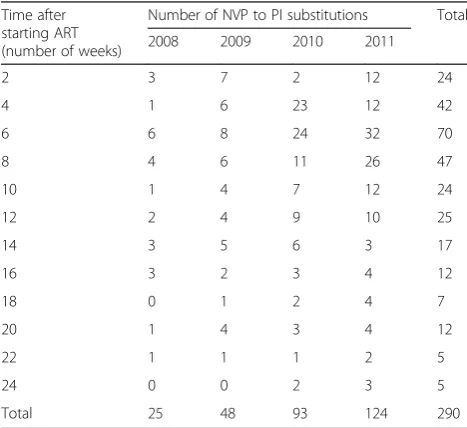
ART to when NVP was replaced with a PI, and the number of patients in whom this happened is shown in Table 2. The mean (and median) ages of the males and females were 41 (39) years and 36 (35) years, respectively.
The Frequency of ART initiation
From the first quarter of 2008 to the third quarter of 2010 the average number of HIV- positive patients who were initiated on ART per quarter was 3 437 (Fig. 2). There was an increase in this number in the third quarter of 2010.
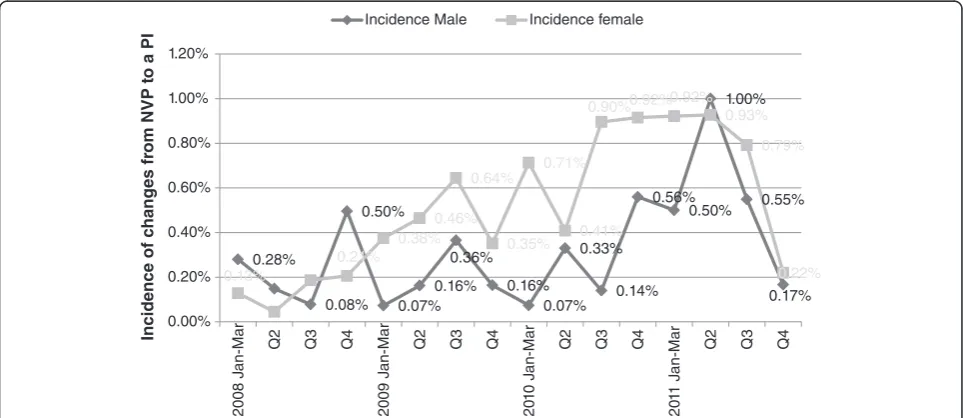
Proportion of patients with a NVP- to-PI substitutions From the second quarter of 2010, the frequency of NVP-to-PI substitutions rose constantly to a peak of 0.95 % in the second quarter of 2011. In the third quarter of 2011 the frequency dropped slightly to 0.70 %, and then sharply by the last quarter of 2011 to 0.20 % (Fig. 2).
Increase in the Use of TDF-based first line HAART
An increase in the use of TDF-based HAART is ob-served in the last two quarters of 2010 (Fig. 3).
Trends in the NVP-to-PI Substitutions according to gender The majority of NVP-to-PI substitutions occurred in fe-males (72.7 %,n= 211).
Females
The proportion of NVP-to-PI substitutions peaked in the third quarter of 2010. The odds of getting a NVP-to-PI substitution in the third quarter of 2010 and after-wards was 2.4 times the odds of getting the same substi-tution in the earlier period (January 2008 to June 2010) (95 % CI 1.8–3.1;p< 0.0001) (Table 3).
Males
The NVP-to-PI substitutions in males fluctuated through the entire period with a spike in the second quarter of 2011 (Fig. 4). The odds of needing a NVP-to-PI substitution from the third quarter of 2010 and after-wards was 2.4 times the odds of getting the same substi-tution in the earlier period (January 2008 to June 2010) (95 % CI 1.4–3.8;p= 0.0002) (Table 3).
Before and after July 2010, the odds of needing a NVP-to-PI substitution in females was 1.6 times that for males (P<0.05) (Table 4).
Discussion
that when a grade III or IV AR–such as Steven-Johnson’s Syndrome, Toxic Epidermal Necrolysis, and very high ala-nine transferase levels in plasma (hepatotoxicity)–occurs, NVP should be substituted with LPV/r [3]. Third: The re-placement of NVP with LPV/r, without any alteration in the nucleoside backbone, within six months of ART was not judged to be treatment failure. Namibia’s 2008 ART guidelines recommended adherence-counselling for pa-tients with poor virologic response before, at, or after six months of ART [3]. Therefore, TDF/3TC/LPV/r was con-sidered to be a first line regimen.
During the period before the publication of Namibia’s 2010 ART guidelines, TDF had been prescribed as part of the nucleoside backbone of first line ART only when zidovudine or stavudine were contraindicated [20]. Im-mediately after the publication of these guidelines, there was a substantial increase in the dispensing of TDF/ 3TC/NVP, the new preferred first line regimen. This im-mediate increase in the dispensing of TDF/3TC/NVP was not surprising, because the coordination between the Division of Pharmaceutical Services (DPS) and the Directorate of Special Programs (DSP) allowed the pub-lication of the guidelines only when the medicines were
Fig. 1Selection of records with a NVP-to-PI substitution
Table 2Number of patients with a NVP-to-PI substitution
Time after starting ART (number of weeks)
Number of NVP to PI substitutions Total 2008 2009 2010 2011
2 3 7 2 12 24
4 1 6 23 12 42
6 6 8 24 32 70
8 4 6 11 26 47
10 1 4 7 12 24
12 2 4 9 10 25
14 3 5 6 3 17
16 3 2 3 4 12
18 0 1 2 4 7
20 1 4 3 4 12
22 1 1 1 2 5
24 0 0 2 3 5
Total 25 48 93 124 290
available at the Central Medical Stores. [The DPS is in charge of the supply chain management of all pharma-ceuticals for the Ministry of Health; and DSP is respon-sible for HIV care and treatment.] Therefore, compliance to the ART guidelines on issues such as the choice of first line ART regimen was facilitated, on the big part,
by availability of the regimen, but also by the training of health care workers (HCW), who work in health facil-ities that provide ART.
The publication of the 2010 ART guidelines was followed by the increase in the number of patients who were newly initiated on ART. The previous guidelines
Fig. 2The figure shows that in the last quarter of 2010, the number of NVP-to-PI substitutions exceeded those in the previous quarters, as did the number of patients newly started on ART (n= 5 352). These substitutions peaked in the first quarter of 2011, but dropped in the subsequent two quarters. In the last quarter of 2011, the number of patients started on ART reverted to the earlier total level (n= 3 025)
recommended that one was eligible for ART when one’s CD4 count was <200cells/mm3. During that period (2008–Early 2010), an average of 3,414 patients were ini-tiated on first line ART per quarter (Range = 613). The 2010 ART guidelines recommended that one was eligible for ART when one’s CD4 count was ≤350cells/mm3. After the 2010 ART guidelines were published, in the fourth quarter of 2010, a total of 5352 were initiated on ART. In the next quarter–Jan-Mar 2011–almost 6000 patients were initiated on ART. The average number of patients newly started on ART for these two quarters – 5,676 – was greater than the average of the previous period by 60 %. A TIPC report concerning the safety of NVP, showed that HIV infected patients were initiated on ART when their baseline CD4 cell count was >200cells/mm3[“Personal Communications” –Dr. Asse-gid Mengistu]. Also, the analysis of NVP-related reaction reports showed that the majority of those who had the baseline CD4 cell counts recorded on the report (n= 55), were females (n= 48). Of these, 60 % had baseline CD4 cell counts >250 cells/mm3. It is likely that the in-crease in the number of patients initiated on ART was a result of initiating NVP-containing ART in patients with a CD4 cell count >200cells/mm3.
The increase in NVP-to-PI substitutions that was ob-served from the third quarter of 2010 to the third quarter
of 2011 started with the use of TDF/3TC/NVP (Fig. 4). Since the new guidelines had lifted the prohibition of the use of NVP in females with baseline CD4 counts >250cells/mm3, plus the fact that female patients were indeed given NVP-containing first line ART with CD4 counts >250cells/mm3, we believed that the increase in NVP-to-PI substitutions was associated with the high baseline CD4 cell count in females. However, the number of patients for whom NVP was replaced with a PI was low, despite the statistical significance. We supposed that the few NVP-to-PI substitutions were because only a handful of female patients had a baseline CD4 cell count >250cells/mm3at the start of TDF/3TC/ NVP. This supposition borrowed evidence from the prospective study that TIPC carried out to assess the safety of first line ART, which showed that indeed many patients were initiated on ART with a CD4 cell count <250cells/mm3 [“Personal Communication” – Dr. Assegid Mengistu]. The reduction in the number of patients newly started on ART, coupled with the decline in the number of NVP-to-PI substitutions, may be due to reversion of HCW to the previous ART guidelines in regards to the safety of NVP.
Our findings were limited by the following reasons. First: We eliminated all records of patients who were changed from NVP to, and remained on EFV. This impacts on the Table 3Comparison of Frequencies of NVP-to-PI Substitutions before and after July 2010: Results According to Gender
No. Started ART before Q3 2010
No. changed from NVP to PI
No. Started ART in and after Q3 2010
No. changed from NVP to PI
Odds Ratio (CI) P-value Females 21 034 74 16 540 137 2.4 (1.8–3.1) <0.0001 Males 13 012 28 9 987 51 2.4 (1.4–3.8) 0.0002
results, because it is possible that NVP was substituted with EFV following ARs of any severity level – grades 1 to 4–without recurrence or escalation of the reaction. For a sustained, unrelenting grade I reaction, or grade II reaction, the substitution of NVP with EFV is appropriate [20]. However, for grade III or IV reactions, the change to EFV is not recommended [21]. On the other hand, it was worth eliminating these since a change from NVP to EFV may have been implemented because of the management of tuberculosis, but this was not verifiable, by virtue of the data source that was employed. Second: we eliminated re-cords of patients who were changed from NVP to LPV/r through EFV. We eliminated these, because we did not know whether the change to LPV/r was due to a reaction associated with EFV or it was the worsening of NVP’s re-action. Therefore, the elimination of records may have downplayed the proportion of NVP related reactions. The increase in the number of NVP-to-PI substitutions could be used to explain the increase in NVP-related skin and liver AR reports that were shown in the analysis of NVP-related AR reports [18]. Another limitation to this study was the lack of baseline CD4 count data. This data would have solidified our argument. Nevertheless, the argument stood the test as the new ART guidelines reverted back to the former safety measures: to avoid NVP in females with baseline CD4 counts above 250cells/mm3.
Conclusion
The incidence of NVP-related reactions of grade III and IV increased with the implementation of Namibia’s 2010 ART Guidelines, which recommended the use of NVP in females with baseline (pre-ART) CD4 cell counts >250 cells/mm3. Therefore, the NVP safety signal was indeed a true signal. We proposed that initiating NVP-containing ART in women with high baseline CD4 counts, that is >250cells/ mm3, was a key factor in the incidence of NVP-related grade III and IV reactions. The decision to halt the initi-ation of NVP-containing ART in all pregnant females in Namibia with high baseline CD4 cell counts was a signifi-cant intervention made by the MoHSS through the use of pharmacovigilance information from TIPC. We published an article on this NVP’s safety concern, in which we recom-mended a review on the use of NVP in Namibia. Namibia’s newest ART guidelines – 2014 guidelines – recommend the avoidance of NVP-containing ART in females and
males with a baseline CD4 count >250 and 400 cells/mm3, respectively. We cannot claim that our findings were the sole reason for the change in guidelines, but we can say that they were contributory. National pharma-covigilance activities can be protective to patients, thus there is need for governments to strengthen local pharmacovigilance practice.
Appendix 1
Table 4Number of NVP-to-PI Substitutions for females vs. males before and after the Launch of the 2010 ART Guidelines
Period Males Females Odds Ratio (CI) P
-value No. started on ART No changed from NVP to PI No. started on ART No. changed from NVP to PI
July 2010 and after 9,987 51 16,540 137 1.6 (1.2–2 .2) 0.003 Before July 2010 13,012 28 21,034 74 1.6 (1.1–2.5) 0.03
Table 5Number of adverse reactions related to antiretrovirals, nevirapine, and other medicines in 2011 and in the Previous Years (2008 - 2010)
Adverse Reaction Reports 2011 2008–2010 (previous years)
RR
n= 481 n= 593 Adverse reaction
related to antiretroviral medicines
389 (80.9 %) 482 (81.3 %) 1
Total NVP reactions (related to skin and liver) Adverse reactions attributed
to NVP
208 (43.2 %) 99 (16.7 %) 2.6 NVP skin reactions
All skin reactions 150 (31.2 %) 70 (11.8 %) 2.6 Severe 109 (22.7 %) 33 (5.6 %) 4.1 Mild/moderate 41 (8.5 %) 37 (6.2 %) 1.4 NVP-liver reactions
All liver reactions 58 (12.1 %) 29 (4.9 %) 2.5 Severe 41 (8.5 %) 13 (2.2 %) 3.9 Mild/moderate 13 (2.7 %) 14 (2.4 %) 1.1 Unknown grade 4 (0.83 %) 2 (0.34 %) -Other antiretroviral
medicine reactions Adverse reactions attributed to other medicines
273 (56.8 %) 494 (83.3 %) 0.7
The severe skin reaction reports in 2011 included: Stevens-Johnson Syndrome
(n= 54), Toxic Epidermal Necrolysis (n= 3), Erythema Multiforme Major (n= 1),
Skin reactions with conjunctivitis and oral lesions (51). In the Previous Years the severe reactions included the same reactions but much fewer reports. Note: The adverse reaction reports that never provided any form of description
of the type of reaction–e.g., skin rash, were regarded as mild or moderate.
Appendix 2
Appendix 3: Comparison of NVP-related reaction reports with reports of adverse effects for EFV and other Medicines
Comparison of proportions of NVP- with EFV- related reactions
The Reaction Ratio (RR) for NVP was greater than that for EFV for both skin and liver associated reactions.
Comparison of proportions of NVP- and EFV- related reactions with other medicines
The Proportional Reporting Ratio (PRR) values for NVP were greater than those for EFV.
Abbreviations
3TC:lamivudine; AMR: adverse medicine reaction; AR: adverse reaction; ART: antiretroviral therapy; ARV: antiretroviral; CI: confidence interval; DHHS: Department of Health and Human Services; NDB: National antiretroviral Dispensing Database; FTC: emtricitabine; HAART: highly active antiretroviral therapy; HCW: health care workers; HIV: human
immunodeficiency virus; MOHSS: Ministry of Health and Social Services; NRTI: nucleoside reverse transcriptase inhibitors; NVP: nevirapine; OR: Odds Ratio; PI: protease inhibitor; SD: standard deviation; TDF: tenofovir; TIPC: Therapeutics Information and Pharmacovigilance Centre; WHO: World Health Organization.
Competing interests
The authors declare that they have no competing interests.
Authors’contributions
FK: Designed the study protocol, abstracted the data, implemented statistical analyses, and wrote the manuscript. ATM: Contributed to the design of the protocol, interpretation of the data, and provided technical in-put to the manuscript. JG: Approved the protocol, contributed technically to, and approved the manuscript. All authors read and approved the final manuscript.
Author details
1School of Pharmacy, Faculty of Health Sciences, University of Namibia,
Windhoek, Namibia .2Therapeutics Information and Pharmacovigilance Centre, Namibia Medicines Regulatory Council, Ministry of Health and Social Services, Windhoek , Namibia.3Registrar of Medicines, Namibia Medicines
Regulatory Council, Ministry of Health and Social Services, Windhoek, Namibia.
Received: 9 March 2015 Accepted: 27 January 2016
References
1. WHO 2010. Antiretroviral Therapy for HIV Infection in Adults and Adolescents: Recommendations for a Public Health Approach 2010 Revision. http://www.who.int/hiv/pub/arv/adult2010/en/index.html. Accessed Nov 15 2014.
2. Floyd S, Marston M, Baisley K, Wringe A, Herbst K, Chihana M, et al. The effect of antiretroviral therapy provision on all-cause, AIDS and non-AIDS mortality at the population level–a comparative analysis of data from four settings in Southern and East Africa. Trop Med Int Health. 2012. doi:10.1111/j.1365-3156.2012.03032.x.
Table 7RRs for NVP- and EFV- related adverse reaction reports
Category of reaction NVP EFV
Skin 2.6 1.9
Liver 2.5 0.4
Table 8PRR for NVP- and EFV- related adverse reaction reports
Category of reaction
PRR for NVP PRR for EFV
2011 Previous years 2011 Previous years Skin 3.8 1.5 0.06 0.06 Liver 9.7 2.2 0.03 0.17
Table 6Statistical analysis of the difference between proportions of NVP-related adverse reactions of skin and liver
% (95 % CI)
Adverse reaction type 2011 Previous years P-value ARV Related
reactions (all)
80.9 % (77.4 %–84.4 %)
81.3 % (78.1 %–84.5 %)
0.87
NVP-related Skin and liver
43.2 % (38.7 %–47.7 %)
16.7 % (13.7 %–19.7 %)
<0.0001 Skin (all) 31.2 %
(27.0 %–35.5 %) 11.8 % (9.2 %–14.4 %)
<0.0001 Skin: severe 22.7 %
(18.9 %–26.5 %) 5.6 % (3.7 %%–7.5 %)
<0.0001 Skin: mild/
moderate
8.5 % (6.0 %–11.0 %)
6.2 % (4.2 %–8.2 %)
0.16 Liver (all) 12.1 %
(9.2 %–15.0 %) 4.9 % (3.1 %–6.7 %)
<0.0001 Liver: severe 8.5 %
(6.0 %–11.0 %) 2.2 % (1.0 %–3.4 %)
<0.0001 Liver: mild/
moderate
2.7 % (1.0 %–4.4 %)
2.4 % (1.2 %–3.6 %)
0.73 Other medicines Skin and liver 5.0 % (3.0 %–7.0 %)
9.9 % (7.5 %–12.3 %)
0.002 NVP-related
reactions for
Females 29.5 % (25.4 %–33.6 %)
12.5 % (9.8 %–15.2 %)
<0.0001 Females:
severe
21.6 % (17.9 %–25.3 %)
5.6 % (3.7 %–7.5 %)
<0.0001 Females:
skin-severe
17.3 % (13.9 %–20.7 %)
4.0 % (2.4 %–5.6 %)
<0.0001 Females:
liver-severe 4.3 % (2.5 %–6.1 %)
1.5 % (0.5 %–2.5 %)
0.0072 Males 13.7 %
(10.6 %–16.8 %) 3.9 % (2.3 %–5.5 %)
<0.0001 Males: severe 9.6 %
(6.9 %–12.3 %) 2.2 % (1.0 %–3.4 %)
<0.0001 Males:
skin-severe 5.4 % (3.4 %–7.4 %)
1.5 % (0.5 %–2.5 %)
0.0007 Males:
liver-severe
4.2 % (2.4 %–6.0 %)
0.7 % (0.0 %–1.4 %)
0.0003
3. MoHSS. Directorate of Special Programmes. Republic of Namibia. National Guidelines for Antiretroviral Therapy. 3rd ed. 2010.
4. Boehringer Ingelhemin Pharmaceuticals, Inc. Viramune Prescribing Information. 2012. http://bidocs.boehringer-ingelheim.com/BIWebAccess/ ViewServlet.ser?docBase=renetnt&folderPath=/Prescribing+Information/PIs/ Viramune/Viramune.pdf Accessed October 2014.
5. Bonjoch A, Paredes R, Domingo P, Cervantes M, Pedrol E, Ribera E, et al. Long-term safety and efficacy of nevirapine-based approaches in HIV type 1- infected patients. AIDS Res Hum Retrovir. 2006;22(4):321–9.
6. João EC, Calvet GA, Menezes JA, D’Ippolito MM, Cruz ML, Salgado LA, et al. Nevirapine toxicity in a cohort of HIV-1-infected pregnant women. Am J Obstet Gynaecol. 2006;194(1):199–202.
7. Kondo W, Carraro EA, Prandel E, Dias JM, Perini J, Macedo RL, et al. Nevirapine-induced side effects in pregnant women: experience of a Brazilian university hospital. Braz J Infect Dis. 2007;11(6):544–8. 8. Knobel H, Guelar A, Montero M, Carmona A, Luque S, Berenguer N, et al.
Risk of side effects associated with the use of nevirapine in treatment-naive patients, with respect to gender and CD4 cell count. HIV Med.
2008;9(1):14–8.
9. Lyons F, Hopkins S, Kelleher B, McGeary A, Sheehan G, Geoghegan J, et al. Maternal hepatotoxicity with nevirapine as part of combination antiretroviral therapy in pregnancy. HIV Med. 2006;7(4):255–60. 10. Manfredi R, Calza L. Nevirapine versus efavirenz in 742 patients: no link of
liver toxicity with female sex, and a baseline CD4 cell count greater than 250cells/microl. AIDS. 2006;20(17):2233–6.
11. Manfredi R, Calza L. Safety issues about nevirapine administration in HIV-infected pregnant women. J Acquir Immune Defic Syndr. 2007;45(3):365–8.
12. Marazzi MC, Germano P, Liotta G, Guidotti G, Loureiro S, da Cruz Gomes A, et al. Safety of nevirapine-containing antiretroviral triple therapy regimens to prevent vertical transmission in an African cohort of HIV-1-infected pregnant women. HIV Med. 2006;7(5):338–44.
13. Phanuphak N, Apornpong T, Teeratakulpisarn S, Chaithongwongwatthana S, Taweepolcharoen C, Mangclaviraj S, et al. Nevirapine-associated toxicity in HIV-infected Thai men and women, including pregnant women. HIV Med. 2007;8(6):357–66.
14. Phillips E, Gutierrez S, Jahnke N, Yip B, Lima VD, Hogg RS, et al.
Determinants of nevirapine hypersensitivity and its effect on the association between hepatitis C status and mortality in antiretroviral drug-naive HIV-positive patients. AIDS. 2007;21(12):1561–8.
15. Hitti J, Frenkel LM, Stek AM, Nachman SA, Baker D, Gonzalez-Garcia A, et al. Maternal toxicity with continuous nevirapine in pregnancy: results from PACTG 1022. J Acquir Immune Defic Syndr. 2004;36(3):772–6.
16. Jamisse L, Balkus J, Hitti J, Gloyd S, Manuel R, Osman N, et al. Antiretroviral associated toxicity among HIV-1-seropositive pregnant women in Mozambique receiving nevirapine-based regimens. J Acquir Immune Defic Syndr. 2007;44(4):371–6.
17. Kiertiburanakul S, Sungkanuparph S, Charoenyingwattana A, Mahasirimongkol S, Sura T, Chantratita W. Risk factors for nevirapine-associated rash among HIV-infected patients with low CD4 cell counts in resource-limited settings. Curr HIV Res. 2008;6(1):65–9.
18. Kalemeera F, Mengistu A, Gaeseb J. Assessment of nevirapine-related adverse reaction reports received from 2008 to 2011 in Namibia. Enliven: Pharmacovigil Drug Saf. 2015;1(1):006.
19. Meyboom RHD, Egberts ACG, Edwards R, Hekster YA, de Koning FH, Gribnau FW. Principles of signal detection in pharmacovigilance. Drug Saf. 1997;16(6):355–65.
20. MoHSS (Ministry of Health and Social Services). National Guidelines for Antiretroviral Therapy. 1st ed. Namibia: MoHSS (Ministry of Health and Social Services); 2008.
21. Metha U, Marteens G. Is it safe to switch between efavirenz and nevirapine in the event of toxicity? Lancet Infect Dis. 2007;7(11):733–8.
• We accept pre-submission inquiries
• Our selector tool helps you to find the most relevant journal
• We provide round the clock customer support
• Convenient online submission
• Thorough peer review
• Inclusion in PubMed and all major indexing services
• Maximum visibility for your research
Submit your manuscript at www.biomedcentral.com/submit