R E S E A R C H
Open Access
Serum uric acid is an independent
predictor of new-onset diabetes after
living-donor kidney transplantation
Kentaro Tanaka
1,2*, Ken Sakai
1, Akifumi Kushiyama
2, Shigeko Hara
2, Masakazu Hattori
3, Yasushi Ohashi
1,
Masaki Muramatsu
1, Takeshi Kawamura
1, Seiichiro Shishido
1and Atsushi Aikawa
1Abstract
Background:We investigated whether serum uric acid (SUA) levels before kidney transplantation predict new-onset diabetes after kidney transplantation (NODAT) and compared SUA levels with known risk factors for NODAT by prospective cohort study.
Methods:A total of 151 adult kidney recipients without diabetes (84 men, 67 women) who underwent
living-donor kidney transplantation between 2001 and 2011 were followed in this study. The Cox proportional hazards model was used to analyse the risk of NODAT.
Results:During the follow-up period (median 3.3 years, range 0–10 years), 32 (21.2%) adult kidney recipients without diabetes developed NODAT, and an incidence rate was 5.6 per 100 person-years and a 10-year cumulative incidence of 26.9%. When subjects were stratified by SUA levels into tertiles, the patients in the highest tertile (> 8.6 mg/dl for men, > 7.7 mg/dl for women) had a significantly higher risk of NODAT than the patients in the lower 2 tertiles (log-rank test,P= 0.03). In the univariate analysis, increased level of SUA was associated with NODAT (hazard ratio 1.27 [95% CI 1.04–1.55],P= 0.01). In the multivariate analysis, increased level of SUA was significantly associated with NODAT after correction by any factors, e.g. (age, sex, family history of diabetes, BMI, HbA1c, serum creatinine, tacrolimus, HCV) factors directly affecting the SUA value (1.26 [1.02–1.56],P= 0.03), risk factors for T2DM onset (1.34 [1.10–1.64],P= 0.03), and factors previously reported risk factors for NODAT (1.36 [1.11–1.66],P= 0.003).
Conclusion:SUA independently predicts NODAT in living-donor kidney transplantation patients.
Keywords:Diabetes, Living-donor kidney transplantation, Uric acid
Background
New-onset diabetes after kidney transplantation (NODAT) is a serious metabolic complication of kidney trans-plantation that predisposes patients to graft dysfunc-tion, infectious complications, cardiovascular disease, and death [1, 2]. The reported incidence of NODAT in kidney transplantation varies between 2 and 53% [1,3,4]. The lack of uniformity in the reported NODAT incidence rates is thought to be caused by variations in the studied populations, varying immunosuppressive regimens, and
different definitions of diabetes [3]. To improve the out-come of kidney transplantation and patient prognosis, precise knowledge of the risk factors that contribute to NODAT development and maintenance are of great im-portance. Several risk factors have been shown to be inde-pendent predictors of NODAT. These include older age, higher body mass index (BMI), risk factors for type 2 dia-betes mellitus (T2DM) onset, ethnicity, hepatitis C virus (HCV)-positive status, and the use of tacrolimus [1, 5]. The risk factors for T2DM onset are relatively well investi-gated and include age, family history of diabetes, BMI, haemoglobin A1c (HbA1c), such indexes as the insulino-genic index, and the homeostasis model assessment of in-sulin resistance (HOMA-IR) [6,7].
* Correspondence:kentarot@oak.ocn.ne.jp 1
Department of Nephrology, School of Medicine, Faculty of Medicine, Toho University, 6-11-1 Omori-Nishi, Ota-ku, Tokyo 143-0015, Japan
2Division of Diabetes and Metabolism, Institute for Adult Diseases, Asahi Life
Foundation, Tokyo, Japan
Full list of author information is available at the end of the article
The serum uric acid (SUA) level has also been sug-gested to be associated with a risk of T2DM onset [8]. SUA concentration is significantly correlated with risk factors for metabolic syndrome, and SUA levels affect insulin resistance [9]. Pre-transplant metabolic syndrome is an independent predictor of NODAT [10]. The mech-anism of NODAT is not yet known, and whether SUA and/or risk factors for the onset of T2DM are applicable to NODAT has not been well established. Herein, we aim to provide the first evidence that the pre-transplant SUA level is a predictor of NODAT among kidney allo-graft recipients.
Methods
This was an observational cohort study on the develop-ment of NODAT in kidney transplant recipients who underwent living-donor kidney transplantation at the Department of Nephrology, Toho University Omori Medical Center, Tokyo, Japan. For this study, we initially enrolled all recipients who underwent kidney transplant-ation at our hospital between January 2001 and June 2011 (n= 296). We excluded recipients who were diag-nosed with diabetes before transplantation (n= 34), had received cadaveric kidney transplantation (n= 14), were
< 20 years old (n= 57), had experienced post-transplant allo-graft loss due to acute rejection (n= 1), or did not undergo a pre-transplant oral glucose tolerance test (n= 39). Thus, our study included all non-diabetic adult (> 20 years old) kidney allograft recipients who successfully underwent living-donor kidney transplantation between January 2001 and April 2011 (n= 151; Fig.1). All of the remaining 151 transplant patients (87 men and 64 women, 20–69 years old, pre-transplant dialysis modality: 119 haemodialysis (HD) patients, 20 peritoneal dialysis patients, 12 preemptive) were followed until October 2011. NODAT was defined as fasting plasma glucose ≥126 mg/dL, random plasma glucose ≥200 mg/dL confirmed by repeated testing on a different day, and/or starting oral hypoglycaemic agents or insulin for diabetes treatment after the first 2 weeks post-transplant [11], as defined by the American Diabetes Association and the Japanese diabetes criteria described in 1999 by the Japan Diabetes Society guidelines. The following data were collected from electronic medical records and trans-plant charts: recipient age and sex, BMI, family history of diabetes, duration of dialysis, blood pressure, serum albumin, serum creatinine, HbA1c, insulinogenic index, HOMA-IR, total cholesterol, triglycerides, HCV
infection status, and medication use (anti-hyperuricae-mics, diuretics, and induction immunosuppressive agents). All of the anti-hyperuricaemic agents used were allopurinol. The SUA value is measured according to the protocol for transplantation, at the time of hospitalization just prior to transplantation. SUA levels and other laboratory data were obtained at fasting and pre-dialysis, on the first dialysis day after hospitalization. The SUA levels after transplantation were measured approximately 2 months later with renal function stabilized. The present study was performed with the approval of the Clinical Research Ethics Committee of the Toho Omori Medical Center (approval number 24-103).
All patients were on maintenance immunosuppressive therapy, which included methylprednisolone and calcine-urin inhibitors (e.g. tacrolimus or cyclosporine) and anti-proliferative agents (mycophenolate mofetil, mizoribin, or azathioprine) before transplant. Methylprednisolone was administered at a starting dose of 12 mg/day. The starting doses of cyclosporine and tacrolimus were 5 and 0.2 mg/ kg/day, respectively. Both agents were administered in two divided doses and were adjusted to maintain levels at 200 to 300 ng/mL up to 1 week after operation and 8 to 12 ng/mL up to 1 month after operation, respectively. Mycophenolate mofetil was administered at a dose of 25–30 mg/kg/day in two divided doses. The estimated glomerular filtration rate (eGFR) was calculated using the estimation formula advocated by the Japanese Society of Nephrology [12]: eGFR (mL/min/1.73 m2) = 194 × Cr− 1.094 × age−0.287 (× 0.739 for women).
Statistical analysis
The data are expressed as the mean ± standard deviation or as frequency. The differences among the three groups were assessed using a one-way analysis of variance and Fisher’s exact test. To investigate the relationship between SUA levels and the onset of NODAT, the SUA levels were stratified into tertiles, which were calculated separately for men (lower tertile < 429μmol/L [7.2 mg/dL]; middle 429– 511 μmol/L [7.2–8.6 mg/dL]; upper > 511 μmol/L [8.6 mg/dL]) and women (lower < 387 μmol/L [6.5 mg/ dL]; middle 387–457 μmol/L [6.5–7.7 mg/dL]; upper > 457 μmol/L [7.7 mg/dL]), because SUA levels in women tend to be lower than those in men [13]. The onset of NODAT was analysed using the Kaplan-Meier method, and the significance was calculated using the log-rank test. The Cox proportional hazards regression model was used to assess the independent predictors of NODAT. Three multivariate regression models were performed. The first was adjusted for the factors that directly affect the SUA value: serum creatinine, diuretics (yes/no), and allopurinol therapy (yes/no). A second regression model was adjusted for risk factors for the onset of T2DM: age (years), sex
(male vs. female), family history of diabetes (yes/no), BMI, HbA1c, I-I, and HOMA-IR. A third model was adjusted for the significant factors used in the first and second models and previously reported risk factors for the onset of NODAT: HCV infection (yes/no) and im-munosuppressive agents (tacrolimus vs. cyclosporine). The results are presented as hazard ratios with 95% confidence intervals (CI). P values < 0.05 were consid-ered to indicate statistically significant differences. The analyses were performed using JMP software (version 13.0; SAS Institute, Cary, NC, USA).
Power calculation
We are planning a study with 50 experimental partici-pants, 100 control participartici-pants, an accrual interval of 0.5 year, and additional median follow-up after the ac-crual interval of approximately 3 years. If the true hazard ratio of control participants relative to experimental par-ticipants is 2.5 in the end of follow-up, we will be able to reject the null hypothesis that the experimental and con-trol survival curves are equal with probability (power) 0.878. The type I error probability associated with this test of this null hypothesis is 0.05.
Results
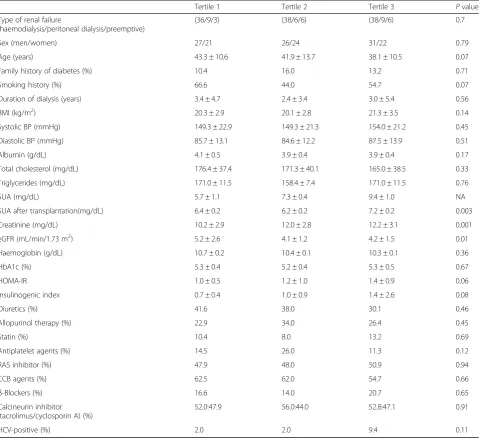
In the study population, the median baseline SUA value was 7.4 mg/dL, with a range of 1.7 to 12.2 mg/dL. The baseline clinical and biochemical characteristics of the recipients, grouped by sex-specific SUA tertiles, are shown in Table1.
There were no differences between the groups in sex, age, family history of diabetes, BMI, HbA1c, HOMA-IR, I-I, HCV infection status, or the frequency of medication use, including diuretics, lipid-lowering agents, antihyper-tensive agents, antiplatelet agents, and immunosuppres-sive agents (Table 1). Serum creatinine and eGFR differed between the groups and were associated with el-evated SUA values. Figure 2 shows the results of the Kaplan-Meier survival analysis for NODAT incidence. Thirty-two of the 151 recipients developed NODAT during the follow-up period (median 3.3 years, range 0–10 years) with an incidence rate of 5.6 per 100 per-son-years and a total cumulative incidence of 26.9% as of 10 years of follow-up. Analysis according to the tertiles of SUA at baseline revealed a cumulative incidence of NODAT of 13.8% in the lowest SUA tertile, 19.0% in the middle tertile, and 44.1% in the highest tertile as of 10 years of follow-up (log-rank test,P= 0.03).
P= 0.02), and HbA1c (2.39 [1.07–5.34], P= 0.03) were associated with a higher risk of NODAT. SUA (1.26 [1.02–1.56], P= 0.03) was associated with an increased risk of NODAT when the model was adjusted for the factors that directly affected the SUA level (Table 2, multivariate model 1). Age (1.04 [1.01–1.07], P= 0.008) and SUA (1.34 [1.10–1.64], P= 0.003) were associated after correcting for risk factors for the onset of T2DM (Table 2, multivariate model 2). Age (1.05 [1.02–1.08], P= 0.0007) and SUA (1.36 [1.11–1.66], P= 0.003) remained significantly associated after correcting for previously reported risk factors for the onset of
NODAT and the significant factors adjusted for in models 1 and 2 (Table 2, multivariate model 3).
The SUA level before transplantation correlated with the SUA level after transplantation with renal function stabi-lized (ρ= 0.17,P= 0.03 by Spearman’s correlation analysis).
Discussion
In this cohort study of kidney transplant recipients over a 10-year period, NODAT was found in 21.2% of the pa-tients and the 10-year cumulative incidence was 26.9%. In the tertile stratification, a high SUA level (> 511 μmol/L [8.6 mg/dL] for men and > 457 μmol/L
Table 1Characteristics of renal transplant recipients stratified into sex-specific tertiles of serum uric acid levels
Tertile 1 Tertile 2 Tertile 3 Pvalue Type of renal failure
(haemodialysis/peritoneal dialysis/preemptive)
(36/9/3) (38/6/6) (38/9/6) 0.7 Sex (men/women) 27/21 26/24 31/22 0.79 Age (years) 43.3 ± 10.6 41.9 ± 13.7 38.1 ± 10.5 0.07 Family history of diabetes (%) 10.4 16.0 13.2 0.71 Smoking history (%) 66.6 44.0 54.7 0.07 Duration of dialysis (years) 3.4 ± 4.7 2.4 ± 3.4 3.0 ± 5.4 0.56 BMI (kg/m2) 20.3 ± 2.9 20.1 ± 2.8 21.3 ± 3.5 0.14
Systolic BP (mmHg) 149.3 ± 22.9 149.3 ± 21.3 154.0 ± 21.2 0.45 Diastolic BP (mmHg) 85.7 ± 13.1 84.6 ± 12.2 87.5 ± 13.9 0.51 Albumin (g/dL) 4.1 ± 0.5 3.9 ± 0.4 3.9 ± 0.4 0.17 Total cholesterol (mg/dL) 176.4 ± 37.4 171.3 ± 40.1 165.0 ± 38.5 0.33 Triglycerides (mg/dL) 171.0 ± 11.5 158.4 ± 7.4 171.0 ± 11.5 0.76 SUA (mg/dL) 5.7 ± 1.1 7.3 ± 0.4 9.4 ± 1.0 NA SUA after transplantation(mg/dL) 6.4 ± 0.2 6.2 ± 0.2 7.2 ± 0.2 0.003 Creatinine (mg/dL) 10.2 ± 2.9 12.0 ± 2.8 12.2 ± 3.1 0.001 eGFR (mL/min/1.73 m2) 5.2 ± 2.6 4.1 ± 1.2 4.2 ± 1.5 0.01
Haemoglobin (g/dL) 10.7 ± 0.2 10.4 ± 0.1 10.3 ± 0.1 0.36 HbA1c (%) 5.3 ± 0.4 5.2 ± 0.4 5.3 ± 0.5 0.67 HOMA-IR 1.0 ± 0.5 1.2 ± 1.0 1.4 ± 0.9 0.06 Insulinogenic index 0.7 ± 0.4 1.0 ± 0.9 1.4 ± 2.6 0.08 Diuretics (%) 41.6 38.0 30.1 0.46 Allopurinol therapy (%) 22.9 34.0 26.4 0.45
Statin (%) 10.4 8.0 13.2 0.69
Antiplatelet agents (%) 14.5 26.0 11.3 0.12 RAS inhibitor (%) 47.9 48.0 50.9 0.94 CCB agents (%) 62.5 62.0 54.7 0.66
β-Blockers (%) 16.6 14.0 20.7 0.65 Calcineurin inhibitor
(tacrolimus/cyclosporin A) (%)
52.0:47.9 56.0:44.0 52.8:47.1 0.91 HCV-positive (%) 2.0 2.0 9.4 0.11
Cohort sizen= 151 (84 men and 67 women). The statistical significance was estimated with a one-way analysis of variance and Fisher’s exact text (P< 0.05). Data are expressed as mean ± standard deviation or percent
BMIbody mass index,BPblood pressure,CCBcalcium channel blocker,eGFRestimated glomerular filtration rate,HbA1chaemoglobin A1c,HCVhepatitis C virus,
[7.7 mg/dL] for women) was an independent and strong predictor of NODAT in our study. We constructed three Cox hazard regression models that indicated a signifi-cant association between SUA and NODAT after adjust-ing for known risk factors for T2DM onset, NODAT,
and factors that directly affect the SUA level. We dem-onstrated for the first time that a high SUA level is a strong and independent predictor of NODAT.
A previous report did not reveal an association be-tween SUA and NODAT; however, pre-transplant anti-hyperuricaemic medication was associated with NODAT [14]. Conversely, allopurinol therapy did not predict NODAT in our study, but SUA did. SUA level is reportedly affected by the variables in model 1, re-lated to uric acid excretion [15]. We confirm SUA is independent of factors from renal function, and cor-relation of SUA levels between before and after trans-plantation with renal function stabilized. Therefore, SUA is suggested to reflect elevated production, pre-disposed by xanthine oxidoreductase (XOR) activity, in a manner independent of renal function. Uric acid has thought to have diabetogenic action since 1950 [16], by exacerbating insulin resistance [17]. More-over, uric acid production via XOR promotion, associ-ated with oxidative stress and inflammation such as macrophage activation [18], is suggested to induce a vulnerability to NODAT development. The role of uric acid metabolism-related inflammation in patho-genesis of diabetes, non-alcoholic steatohepatitis, and arteriosclerosis has been reported in several studies in many countries [19–22]. To the best of our knowledge, our study is the first to clarify the associ-ation between increased SUA production and devel-opment of NODAT.
Many risk factors have been proposed for the develop-ment of NODAT: age, race, family history of diabetes, BMI, glucose intolerance, metabolic syndrome, acute
Fig. 2Kaplan-Meier curves for NODAT in kidney transplant recipients stratified by sex-specific tertiles of SUA levels. Tertile of 1 (T1) (n= 48: SUA < 429μmol/L [7.2 mg/dL] in men, < 387μmol/L [6.5 mg/dL] in women), T2 (n= 50: SUA 429–511μmol/L [7.2–8.6 mg/dL] in men, 387–457μmol/L [6.5–7.7 mg/dL] in women), and T3 (n= 53: SUA > 511μmol/L [8.6 mg/dL] in men, upper > 457μmol/L [7.7 mg/dL] in women). The table at the bottom of the figure indicates the numbers of patients who were at risk at time 0 and at 2, 4, 6, 8, and 10 years in each tertile. The highest tertile of SUA levels had a significantly higher risk of NODAT than those in the lower 2 tertiles (log-rank test,P= 0.03)
Table 2Predictors of NODAT as assessed with multivariate Cox proportional hazards models
Variable Univariate model
Pvalue Multivariate models
Model 1 Pvalue Model 2 Pvalue Model 3 Pvalue SUA, per 1 mg/dL 1.27 (1.04–1.55) 0.01 1.26 (1.02–1.56) 0.03 1.34 (1.10–1.64) 0.003 1.36 (1.11–1.66) 0.003 Use of diuretics (yes/no) 1.05 (0.48–2.16) 0.88 1.08 (0.50–2.63) 0.82
Use of allopurinol therapy (yes/no) 0.67 (0.25–1.45) 0.36 0.66 (0.24–1.53) 0.36 Creatinine, per 1 mg/dL 0.77 (0.55–1.01) 0.06 1.07 (0.95–1.21) 0.23
Sex (men) 0.77 (0.37–1.58) 0.47 0.73 (0.32–1.65) 0.41
Age, per 1 year 1.04 (1.01–1.07) 0.006 1.04 (1.01–1.07) 0.008 1.05 (1.02–1.08) 0.0007 BMI, per 1 kg/m2 1.00 (089–1.11) 0.88 0.99 (0.86–1.13) 0.94
Family history of diabetes (yes/no) 0.49 (0.07–1.63) 0.28 0.57 (0.09–1.93) 0.38 HbA1c, per 1% 2.39 (1.07–5.34) 0.03 2.06 (0.85–5.02) 0.10 Insulinogenic index, per 1 change 0.82 (0.47–1.09) 0.27 0.81 (0.43–1.18) 0.38 HOMA-IR, per 1 unit 1.05 (0.69–1.45) 0.76 0.95 (0.54–1.46) 0.84 Calcineurin inhibitor
(tacrolimus/cyclosporin A)
1.73 (0.85–3.57) 0.12 1.99 (0.97–4.17) 0.05 HCV-positive (yes/no) 1.49 (0.24–4.97) 0.60 1.11 (0.17–3.88) 0.88
Results are expressed as hazard ratios (95% confidence intervals). Cohort sizen= 151 (84 men and 67 women)
rejection, cadaveric kidney transplantation, chronic in-fection with HCV, and the type of immunosuppression used [1, 3, 5]. Furthermore, SUA is correlated with metabolic syndrome and T2DM [8, 9,23–25]. Another T2DM risk might also be a NODAT risk; therefore, we included known T2DM risks in model 2 for multivari-ate analysis. HOMA-IR and I-I tended to be higher in patients in the highest tertile for SUA values than for those in the lower 2 tertiles. However, after adjusting for both factors, they were not associated with NODAT. Known risk factors for NODAT relating to transplant-ation are included in model 3. Older age has consist-ently been an important contributing factor to the development of T2DM and NODAT [1,2,26] and is an important determinant ofβ-cell dysfunction after renal transplantation [27]. Our recipients represent a rela-tively young population for T2DM onset, with median ages of 39 and 47 years in non-NODAT and NODAT patients, respectively.
Evidence suggests that immunosuppressive drugs ac-count for the risk for NODAT development [3]. The association between corticosteroids and NODAT is clearly established and is related to cumulative dosages and therapy duration [4]. The avoidance of steroids is associated with a significant reduction in the likelihood of developing NODAT [28]. However, to date, there has been no steroid-free maintenance regimen in Japan, and our protocol is based on pre-transplant induction therapy and does not include post-transplant therapy.
This study has several limitations. First, all donors and recipients were Japanese, and it was not revealed whether the risk of high SUA for NODAT is applicable to other ethnicities. Second, this is a single-institution study; therefore, the magnitude of SUA significance might vary according to unknown factors resulting from intra-institutional differences. Third, it is un-known whether uric acid reduction therapy prevents NODAT because of the observational nature of this study. Fourth, although the results of kidney transplant-ation in Japan are as good as those observed in
Euro-pean countries and the USA, the number of
transplantations performed in Japan is extremely small compared with these countries. An interventional study with a large number of patients is needed to verify the usefulness of pre-transplant uric acid-lowering therapy. Despite these limitations, this is the first long-term follow-up study to report a novel predictor and poten-tial target for NODAT. Certain care for recipients with preoperative hyperuricemia of living-donor kidney transplantation is probably important in clinical situ-ation. From now on, frequent check of the glycemic control and uric acid level are recommended for both clinical practice and future research field.
Conclusions
In summary, we conclude that the pre-transplant SUA level is an independent predictor of NODAT, particularly when it falls into the upper range (> 8.6 mg/dL for men, > 7.7 mg/dL for women). Patients with a high pre-transplant SUA level should be carefully followed up.
Abbreviations
BMI:Body mass index; CI: Confidence intervals; eGFR: Estimated glomerular filtration rate; HbA1c: Haemoglobin A1c; HCV: Hepatitis C virus;
HD: Haemodialysis; NODAT: New-onset diabetes after kidney transplantation; SUA: Serum uric acid; T2DM: Type 2 diabetes mellitus; XOR: Xanthine oxidoreductase
Acknowledgements
The authors thank Takashi Ozawa and Yoko Yoshida for their kind help, Toshihiko Oota for his programming efforts, and Takefumi Kitazawa and Kunichika Matsumoto for the assistance with the statistical analysis.
Availability of data and materials
Please contact the author for data requests.
Authors’contributions
KT designed this study. KS summarized Tables1and2. AK performed the statistical analysis and created Figs.1and2. Other co-authors summarized and wrote the“Discussion”section. All authors have contributed significantly, have read, and approved the manuscript.
Ethics approval and consent to participate
The present study was performed with the approval of the Clinical Research Ethics Committee of the Toho Omori Medical Center (approval number 24-103).
Consent for publication
Not applicable
Competing interests
The authors declare that they have no competing interests.
Publisher’s Note
Springer Nature remains neutral with regard to jurisdictional claims in published maps and institutional affiliations.
Author details
1Department of Nephrology, School of Medicine, Faculty of Medicine, Toho
University, 6-11-1 Omori-Nishi, Ota-ku, Tokyo 143-0015, Japan.2Division of Diabetes and Metabolism, Institute for Adult Diseases, Asahi Life Foundation, Tokyo, Japan.3Division of Diabetes, Clinical Research Center for
Endocrinology and Metabolic Diseases, National Hospital Organization Kyoto Medical Center, Kyoto, Japan.
Received: 4 April 2018 Accepted: 4 July 2018
References
1. Kasiske BL, Snyder JJ, Gilbertson D. Diabetes mellitus after kidney transplantation in the United States. Am J Transplant. 2003;3:178–85. 2. Cosio FG, Kudva Y, van der Velde M, Larson TS, Textor SC, GriffinMD et al. New
onset hyperglycemia and diabetes are associated with increased
cardiovascular risk after kidney transplantation. Kidney Int. 2005; 67: 2415–2421. 3. Montori VM, Basu A, Erwin PJ, Velosa JA, Gabriel SE, Kudva YC.
Posttransplantationdiabetes: a systematic review of the literature. Diabetes Care. 2002;25:583–92.
4. Davidson JA, Wilkinson A. New-onset diabetes after transplantation 2003 international consensus guidelines: an endocrinologist’s view. Diabetes Care. 2004;27:805.
6. Yoshinaga H, Kosaka K. Heterogeneous relationship of early insulin response and fasting insulin level with development of non-insulin-dependent diabetes mellitus in non-diabetic Japanese subjects with or without obesity. Diabetes Res Clin Pract. 1999;44:129–36.
7. Nguyen QM, Xu JH, Chen W, Srinivasan SR, Berenson GS. Correlates of age-onset of type 2 diabetes among relatively young black and white adults in a community: the Bogalusa Heart Study. Diabetes Care. 2012;35(6):1341–6. 8. Kodama S, Saito K, Yachi Y, Asumi M, Sugawara A, Totsuka K, et al.
Association between serum uric acid and development of type 2 diabetes. Diabetes Care. 2009;32:1737–42.
9. Yoo TW, Sung KC, Shin HS, Kim BJ, Kim BS, Kang JH, et al. Relationship between serum uric acid concentration and insulin resistance and metabolic syndrome. Circ J. 2005;69:928–33.
10. Bayer ND, Cochetti PT, Anil Kumar MS, Teal V, Huan Y, Doria C, et al. Association of metabolic syndrome with development of new-onsetdiabetes after transplantation. Transplantation. 2010;90(8):861–6. 11. Bee YM, Tan HC, Tay TL, Kee TY, Goh SY, Kek PC. Incidence and risk factors
for development of new-onset diabetes after kidney transplantation. Ann Acad Med Singapore. 2011; 40(4): 160–168.
12. Matsuo S, Imai E, Horio M, Yasuda Y, Tomita K, Nitta K, et al. Revised equations for estimated GFR from serum creatinine in Japan. Am J Kidney Dis. 2009;53:982–92.
13. Akizuki S. Serum uric acid levels among thirty-four thousand people in Japan. Ann Rheum Dis. 1982;41:272–4.
14. Chakkera HA, Weil EJ, Swanson CM, Dueck AC, Heilman RL, Reddy KS, et al. Pretransplant risk score for new-onset diabetes after kidney transplantation. Diabetes Care. 2011;34(10):2141–5.
15. Rieselbach RE, Steele TH. Intrinsic renal disease leading to abnormal urate excretion. Nephron. 1975;14(1):81–7.
16. Griffiths M. The mechanism of the diabetogenic action of uric acid. J BiolChem. 1950;184(1):289–98.
17. Facchini F, Chen YD, Hollenbeck CB, Reaven GM. Relationship between resistance to insulin-mediated glucose uptake, urinary uric acid clearance, and plasma uric acid concentration. JAMA. 1991;266:3008–11.
18. Kushiyama A, Okubo H, Sakoda H, Kikuchi T, Fujishiro M, Sato H, et al. Xanthine oxidoreductase is involved in macrophage foam cell formation and atherosclerosis development. ArteriosclerThrombVascBiol. 2012;32(2):291–8. 19. Bhole V, Choi JW, Kim SW, de Vera M, Choi H. Serum uric acid levels and the
risk of type 2 diabetes: a prospective study. Am J Med. 2010;123(10):957–61. 20. Jia Z, Zhang X, Kang S, Wu Y. Serum uric acid levels and incidence of
impaired fasting glucose and type 2 diabetes mellitus: a meta-analysis of cohort studies. Diabetes Res Clin Pract. 2013;101(1):88–96.
21. Lv Q, Meng X-F, He F-F, Chen S, Su H, Xiong J, et al. High serum uric acid and increased risk of type 2 diabetes: a systemic review and metaanalysis of prospective cohort studies. PLoS One. 2013;8(2):e5686.
22. Kushiyama A, Nakatsu Y, Matsunaga Y, Yamamotoya T, Mori K, Ueda K, et al. Role of uric acid metabolism-related inflammation in the pathogenesis of metabolic syndrome components such as atherosclerosis and nonalcoholic steatohepatitis. Mediat Inflamm. 2016;2016:8603164.
23. Klein BE, Klein R, Lee KE. Components of the metabolic syndrome and risk of cardiovascular disease and diabetes in Beaver Dam. Diabetes Care. 2002;25:1790–4. 24. Tsouli SG, Liberopoulos EN, MikhailidisDP AVG, Elisaf MS. Elevated serum
uric acid levels in metabolic syndrome: an active component or an innocent bystander? Metabolism. 2006;55:1293–301.
25. Hara S, Tsuji H, Ohmoto Y, Amakawa K, Hsieh SD, Arase Y, et al. High serum uric acid level and low urine pH as predictors of metabolic syndrome: a retrospective cohort study in a Japanese urban population. Metabolism. 2012;61(2):281–8.
26. Fletcher B, Gulanick M, Lamendola C. Risk factors for type 2 diabetes mellitus. J Cardiovasc Nurs. 2002;16:17–23.
27. Hjelmesaeth J, Jenssen T, Hagen M, Egeland T, Hartmann A. Determinants of insulin secretion after renal transplantation. Metabolism. 2003;52:573–8. 28. Luan FL, Steffick DE, Ojo AO. New-onset diabetes mellitus in kidney