R E S E A R C H
Open Access
Estimation of root inclination of anterior
teeth from virtual study models: accuracy
of a commercial software
Panagiota Magkavali-Trikka
1*, Demetrios J. Halazonetis
2and Athanasios E. Athanasiou
3Abstract
Background:The aim of the study was to assess the accuracy of commercially available software in estimating anterior tooth root inclination from digital impressions of the crowns of the teeth.
Subjects and methods:Following sample size calculation and application of inclusion and exclusion criteria, 55 anterior natural teeth derived from 14 dry human skulls were selected. Impressions were taken and plaster study models were fabricated. Plaster models were scanned using the high-resolution mode of an Ortho Insight 3D laser scanner. The teeth on the digital scans were segmented and virtual roots were predicted and constructed by the Ortho Insight 3D software. The 55 natural teeth were removed from the dry skulls and scanned using the Identica extraoral white-light scanner in order to calculate their actual root angulation. The teeth were scanned twice, once to acquire the crown and the cervical part of the root, and a second time to acquire the remaining part of the root, including the apex. The two scanned segments were joined in software by superimposing them along their common part. The accuracy of the digital models generated by the Ortho Insight 3D scanner in predicting root angulation was assessed by comparing these results to the corresponding measurements of the 55 natural teeth. The long axes of the tooth models obtained from the software prediction and the scanning of the actual teeth were computed and the discrepancy between them was evaluated. The error of the methods was evaluated by repeating the measurements on 14 teeth and showed an acceptable range.
Results:The predicted tooth angulation was found to differ significantly from the actual angulation, both statistically and clinically. The angle between the predicted and actual long axes ranged from 2.0 to 37.6°(average 9.7°; median 7.4°). No statistically significant difference was found between tooth categories.
Conclusions:Further investigations and improvements of the software are needed before it can be considered clinically effective.
Keywords:Digital models, Natural teeth, Dry skulls, Tooth root inclination prediction software
Background
Compared to traditional plaster study casts, digital models present numerous advantages in terms of cost, time and storage space, without sacrificing measurement accuracy, reliability, and reproducibility [14]. Such models are obtained by intraoral scanning, or from den-tal impressions and stone casts, but they include only the clinical crowns of the teeth with no root information
[12]. Digital models of the whole teeth can be acquired by segmenting CBCT data. However, due to the limited resolution of CBCT images and accompanying image ar-tefacts, such models lack high detail [5,9,10,17]. Com-bining the two technologies makes it possible to fuse the highly detailed scanned crown surfaces with the CBCT root surfaces into one virtual whole tooth model [17]. Nevertheless, this requires radiation exposure that should be avoided [11]. An alternative is to estimate the shape and position of the roots solely from the crown position and morphology. The Ortho Insight 3D™ laser scanner, in conjunction with the Motion View Software,
© The Author(s). 2019Open AccessThis article is distributed under the terms of the Creative Commons Attribution 4.0 International License (http://creativecommons.org/licenses/by/4.0/), which permits unrestricted use, distribution, and reproduction in any medium, provided you give appropriate credit to the original author(s) and the source, provide a link to the Creative Commons license, and indicate if changes were made.
* Correspondence:[email protected]
1Hamdan Bin Mohammed College of Dental Medicine, Mohammed Bin
Rashid University of Medicine and Health Sciences, Dubai, United Arab Emirates
LLC (Chattanooga, Tennessee, USA) provides estimates of the roots using crown-based algorithmic prediction. The accuracy of the models generated using this com-mercially available software was tested by comparing the results to actual data obtained from CBCT images [8]. The maximum angular disparity between the long axes of the estimated virtual roots and the actual roots de-rived from CBCT data reached 40°. The upper and lower canines produced the worst results, followed by the lower lateral incisors. The upper central incisors showed the best results, although the maximum angular differ-ence exceeded 20°, with the median around 8°.
Since CBCT images have limitations in accurately measuring crown and root lengths [2, 7, 16], evaluating software-estimated root angulation would be more valid if data derived from natural dental units were used. Therefore, our hypothesis was that there are differences between the actual root angulation of anterior teeth and the angulation estimated by commercially available soft-ware. Our aim was to assess the accuracy of software-generated digital models of anterior teeth by comparing the predicted root angulation to data obtained from nat-ural teeth on dry skulls.
Methods Sample
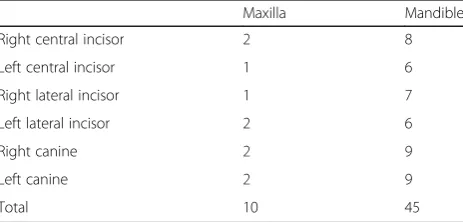
The sample consisted of 55 natural anterior teeth de-rived from 14 dry human skulls (11 mandibles and 3 maxillae). The inclusion criteria were that all the teeth should derive from permanent dentition of adults and should present normal crown morphology. Primary teeth, teeth with abnormal tooth morphology and resto-rations, and jaws resembling craniofacial anomalies or syndromes were excluded. Only anterior teeth were eval-uated since they are simpler in terms of the morphology of both their crowns and roots [7]. The number and dis-tribution of the 55 teeth are presented in Table1.
Methods
Plaster models were constructed from alginate impres-sions of the dry skull jaws. Each plaster model was scanned by the first author using the Ortho Insight 3D
laser scanner and software (Motionview Software LLC, Chattanooga, Tennessee, USA, software version 4.0.6), with the scanning resolution set at “high”. According to the manufacturer’s instructions, the operator placed land-marks on the digital models (eight points on each incisor and three points on each canine) and identified the facial axes of the teeth. Using this information, the software constructed virtual roots. The tooth models, including the roots, were exported as stereolithography (STL) files.
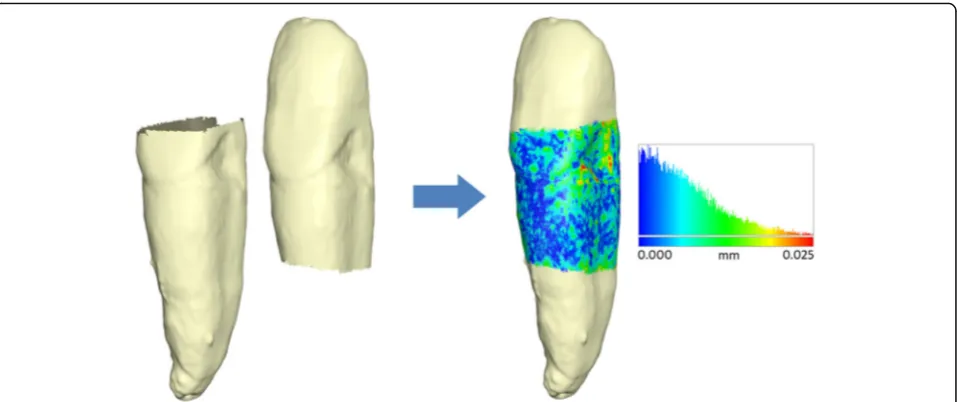
All the 55 natural teeth were removed with care from the dry skulls, covered with a thin layer of white varnish in order to make them suitable for scanning, and scanned using an extraoral white-light scanner (Identica, Medit Co. Ltd, Seoul, South Korea). The teeth were scanned in two stages in order to capture the whole sur-face: the first stage included scanning the crown and the cervical part of the root, extending as far apically as the retention base of the scanner would allow; at the second stage, the tooth was turned over and the whole root was scanned together with part of the crown. The two seg-ments of each tooth were then superimposed over their common surface to create a single tooth model (Fig.1).
Each unified tooth model was then aligned on the re-spective tooth of the scanned plaster cast fabricated from the impressions taken from the dry human skulls. The reference area for this superimposition was the part of the crown visible on the casts. In most cases, the cemento-enamel junction was visible on the casts, so the whole crown was used, except for the contact areas to neighbouring teeth (Fig.2).
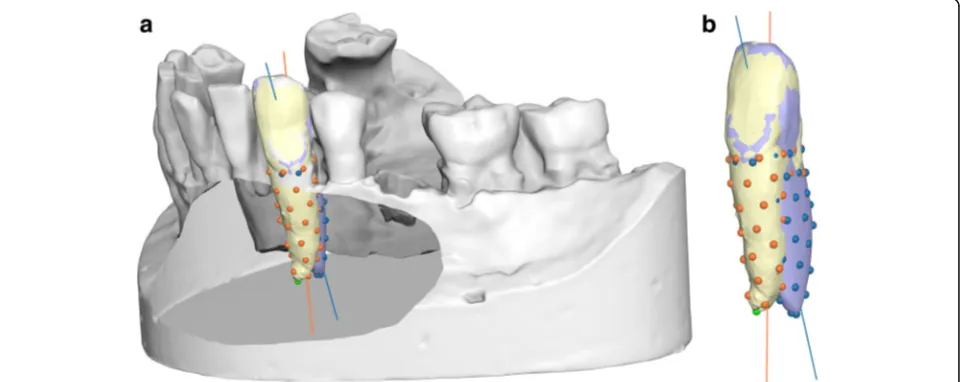
The third superimposition was between the scanned plaster cast and the Ortho Insight prediction. More spe-cifically, the Ortho Insight prediction included all the teeth of each jaw, joined together in one model. The crowns of these predicted teeth and the corresponding cast crowns were used as reference areas for the super-imposition (Fig.3).
All superimpositions were performed with the View-box software (dHAL Software, Kifissia, Greece) using a version of the iterative closest point (ICP) algorithm [3, 6, 15]. The quality of all superimpositions was assessed by the root-mean-squared distance (mm) (RMSD), com-puted as the square root of the average of the squared distances of the points of one of the surfaces to the clos-est point on the other surface.
The second part of the laboratory work consisted of landmarking the virtual roots, both the actual and es-timated, to identify their long axes. The Viewbox
soft-ware automatically placed 50 points uniformly
distributed over the root surface of each tooth; the root long axis was computed as the best fit line to these points. Subsequently, the angle between the long axes of the actual tooth root and the estimated tooth root was computed (Fig. 4).
Table 1Number and distribution of the 55 teeth of the sample
Maxilla Mandible Right central incisor 2 8 Left central incisor 1 6 Right lateral incisor 1 7 Left lateral incisor 2 6 Right canine 2 9 Left canine 2 9
Sample size calculation
We computed the required sample size based on the re-quirement to detect a difference of 3° between the actual root angulation and that estimated by the software. We set the alpha level to 0.05, power to 80% and the standard deviation of the difference to 7°, based on a previous study [8]. These values resulted in a minimum sample size of 43 teeth; we included 55, based on availability (Table1).
Statistical methods
Data were entered in an Excel file (Microsoft Corp., Red-mond, Washington, USA) and SPSS for Windows (ver-sion 20.0, SPSS Inc., Chicago, Illinois, USA) was used for the representation of the data and numerical representa-tion of the difference in root angularepresenta-tion between the ac-tual tooth and its prediction.
Method error
In order to evaluate intra-examiner error, 14 teeth were randomly selected and their scanning was repeated by the first author after an interval of at least 1 month. The alignment of the crown and the root to construct a whole-tooth model was repeated and the RMSD was re-computed. The angle between the long axis of the rescanned tooth and the prediction was re-estimated. The 95% limits of agreement (LoA) were computed to assess intra-examiner error [4].
Results Method error
The difference in RMSD between the two repeated trials for the overlap between the crown and the root ranged from–0.006 to 0.010 mm (mean 0.001 mm, 95% LoA– 0.007 to 0.010 mm), indicating acceptable reliability. Re-garding the overlap between the tooth and the cast,
RMSD differences ranged from –0.040 to 0.057 mm
(mean –0.002 mm, 95% LoA–0.049 to 0.045 mm), also showing good repeatability. No systematic error was de-tected in the repeated angular measurements between the estimated and the actual root angulation (mean value of the difference between repeated measurements:
–0.2°, 95% LoA–3.69 to 3.18°).
Quality of superimpositions
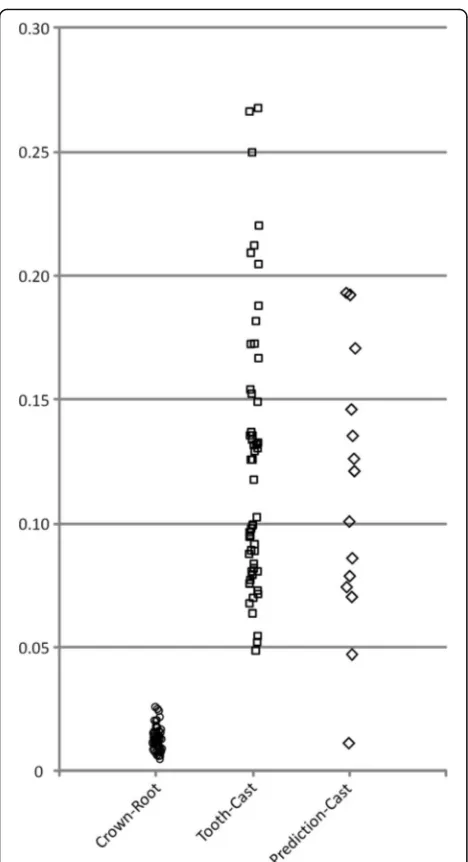
The crown-root superimposition of the tooth segments was reliable and accurate, since the minimum value of the RMSD was 0.005 mm, with the highest being 0.026 mm (median 0.013). The superimposition between each scanned copy of the 3D tooth with the corresponding tooth of the scanned cast showed an RMSD ranging
Fig. 1Superimposition of the tooth segments to construct a single tooth model. The colour map of the overlapping areas shows the absolute distances between the meshes at each mesh vertex. The histogram shows that most of the distances were below 0.01 mm, signifying excellent registration
from 0.048 to 0.267 mm (median 0.103). The RMSD of the superimposition between the dry skull casts and the prediction estimated by the software ranged from 0.011 to 0.193 mm (median 0.111) (Fig.5).
Difference in angulation between actual and estimated roots
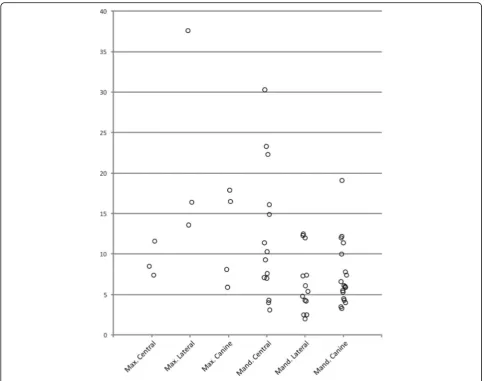
Descriptive statistics for the angle between the long axis of the actual and the predicted root for each
tooth category are shown in Table 2. The minimum
value was 2.0°, corresponding to a lower left lateral incisor, and the maximum angle was 37.6°, corre-sponding to an upper left lateral incisor. Fig. 6 shows a plot of the differences in angulation for each tooth category (Additional file 1).
A Kruskal-Wallis test on the angles of the mandibular teeth did not reveal any evidence of a statistically
significant difference between the three categories— cen-tral incisor, lateral incisor and canine (P= 0.097).
The visual observation of the cases revealed that the software frequently estimated angulations that resulted in overlapping of adjacent roots, a clinically impossible situation unless there is extensive root resorption or root morphology variation.
Discussion
The increasing penetration of digital technology in orthodontic practice has opened up new prospects for hardware and software development. The reliable esti-mation of root position from dental arch scans is a worthy goal, as it avoids radiation exposure. At present, we are aware of only one software company that markets such a tool. This has been evaluated in a previous study, which showed a large range of dis-crepancy in the angle between the actual and esti-mated roots, reaching almost 40° in extreme cases [8]. However, CBCT images were used to acquire root in-formation; since crown and root lengths derived from CBCT images may not be accurate due to resolution issues and artefacts [2, 7, 16], testing the software would be more appropriate with data derived from natural teeth.
In this investigation, we tested for software-estimated root angulation using actual teeth from dry human skulls. The research hypothesis was verified because sig-nificantly different angulations between the estimated and the actual roots were clearly demonstrated. The me-dian discrepancy of the estimated angulation was 7.4 , with three teeth, namely two lower central incisors and one upper lateral incisor, displaying extreme values of 23.3, 30.3 and 37.3 of difference in angulation,
Fig. 4The long axes of the actual and estimated roots of the canine, as computed by the Viewbox software. The dots on each root represent points evenly distributed on each root (50 points per root). The lines are best-fit lines to these points
respectively. The minimum values were found in two cases of lower lateral incisors (2.0 and 2.5 ). The errors of 10 or more in estimating mesio-distal or labio-lingual angulation of the roots are considered clinically signifi-cant, since in these cases the parallelism is characterized as poor [13]. Visual observation of the virtual models re-vealed several cases where the estimated roots over-lapped with one another or extended outside the physical limits of the dental cast. The great variation in predicting root angulation observed in this study raises serious concerns about applying the software in the clin-ical environment.
The present study was limited to anterior teeth since preliminary visual evaluation of the digital models indi-cated that the crowns and roots of these dental units are
much better defined than the posterior. We restricted our evaluation to root angulation and did not measure other important morphological features, such as root length, volume and shape. Furthermore, the method did not assess the direction of the angulation discrepancy, i.e., whether it was mesio-distal or labio-lingual.
The limitations of the study include the use of alginate vs. a higher accuracy silicone material for the impres-sions, the use of varnish, albeit of small thickness, to coat the teeth for reliable scanning, and the need for three separate superimpositions, each with its own in-herent errors. However, the overall error induced by these factors is expected to be small compared to the observed discrepancies in estimated root angulation.
The software tested here has been positively evaluated regarding routine clinical orthodontic applications, such as space analysis and tooth size discrepancy assessment [1]. Estimation of root morphology and position is not one of its primary functions and our results confirm that further development is needed to reach acceptable valid-ity. However, the aim of estimating root position solely from crown information is a worthy goal, as it eliminates the need for radiation exposure. Accurately estimating root position may improve quality of treatment; bio-mechanical adjustments of fixed appliances, appropriate attachment design in clear aligner therapy and safe placement of temporary anchorage devices are a few ex-amples of the potential positive outcomes.
Conclusions
The results of the study lead to the following conclusions:
The angle between true root position and estimated position ranged from 2 to 37.6° and the mean value was 9.7°.
Visual observation of the cases showed that the soft-ware frequently estimates angulations that create an
Fig. 5RMSD values (mm) for each superimposition type
Table 2Descriptive statistics of the angle (degrees) between the long axis of the actual and the estimated root
n Mean (SD) Median (range) Maxilla
Central incisor 3 9.2 (2.18) 8.5 (7.4 to 11.6) Lateral incisor 3 22.5 (13.12) 16.4 (13.6 to 37.6) Canine 4 12.1 (5.98) 12.3 (5.9 to 17.9) All maxillary teeth 10 14.4 (9.21) 12.6 (5.9 to 37.6) Mandible
overlapping of adjacent roots, a clinically impossible situation unless there is extensive root resorption or root morphology variation.
Further investigations and improvements of the soft-ware are needed before it can be considered useful for routine clinical use.
Supplementary information
Supplementary informationaccompanies this paper athttps://doi.org/10. 1186/s40510-019-0298-5.
Additional file 1.Angle between the long axis of the actual and the estimated root of each tooth. Tooth type: 1: central incisor, 2: lateral incisor, 3: canine. Jaw: 1: maxilla, 2: mandible.
Abbreviations
CBCT:Cone beam computed tomography; ICP: Iterative closest point; LoA: Limits of agreement; RMSD: Root-mean-squared distance; SPSS: Statistical Package for the Social Sciences; STL: Stereolithography
Acknowledgements
The authors are grateful to Motion View Company for the technical support provided during the project.
Authors’contributions
AEA conceived the project and designed the study. DJH adapted the software for the requirements of the study and did the statistical elaboration of the data. PMT collected and analysed the data. All authors contributed to the interpretation of the data and writing of the manuscript. All authors read and approved the final manuscript.
Funding
No funding was received for this study.
Availability of data and materials
The datasets used and/or analysed during the current study are available from the corresponding author on reasonable request.
Ethics approval and consent to participate
This research was approved by the Research and Ethics Committee of Hamdan Bin Mohammed College of Dental Medicine, Mohammed Bin Rashid University of Medicine and Health Sciences (Ref. No. EC1016-006).
Consent for publication Not applicable.
Competing interests
DJH has a financial interest in the software“Viewbox”that was used to analyse the data. There are no other competing interests.
Author details
1Hamdan Bin Mohammed College of Dental Medicine, Mohammed Bin
Rashid University of Medicine and Health Sciences, Dubai, United Arab Emirates.2Department of Orthodontics, School of Dentistry, National and Kapodistrian University of Athens, Athens, Greece.3Department of Dentistry,
School of Medicine, European University Cyprus, Nicosia, Cyprus.
Received: 16 June 2019 Accepted: 8 November 2019
References
1. Bailey E, Nelson G, Miller AJ, Andrews L, Johnson E. Predicting tooth-size discrepancy: a new formula utilizing revised landmarks and 3-dimensional laser scanning technology. Am J Orthod Dentofacial Orthop. 2013;143:574– 85.
2. Benninger B, Peterson A, Cook V. Assessing validity of actual tooth height and width from cone beam images of cadavers with subsequent dissection to aid oral surgery. J Oral Maxillofac Surg. 2012;70:302–6.
3. Besl PJ, McKay ND. A method for registration of 3-D shapes. IEEE Transactions on Pattern Analysis and Machine Intelligence. 1992;14:239–56.
https://doi.org/10.1109/34.121791.
4. Bland JM, Altman DG. Statistical methods for assessing agreement between two methods of clinical measurement. Lancet. 1986;8:307–10.
5. Brüllmann D, Schulze RK. Spatial resolution in CBCT machines for dental/ maxillofacial applications—what do we know today? Dentomaxillofac Radiol. 2015;44:20140204.
6. Chetverikov D, Svirko D, Stepanov D, Krsek P. The trimmed iterative closest point algorithm. Proceedings of the 16th International Conference on Pattern Recognition. 2002;3:545–8.https://doi.org/10.1109/ICPR.2002. 1047997.
7. Choi SH, Kim JS, Kim CS, Yu HS, Hwang CJ. Cone-beam computed tomography for the assessment of root-crown ratios of the maxillary and mandibular incisors in a Korean population. Korean J Orthod. 2017;47:39–49. 8. Dastoori M, Bouserhal JP, Halazonetis DJ, Athanasiou AE. Anterior teeth root inclination prediction derived from digital models: A comparative study of plaster study casts and CBCT images. J Clin Exp Dent. 2018;10:e1069–74. 9. Forst D, Nijjar S, Flores-Mir C, Carey J, Secanell M, Lagravere M. Comparison
of in vivo 3D cone-beam computed tomography tooth volume measurement protocols. Prog Orthod. 2014;15:69.
10. Galibourg A, Dumoncel J, Telmon N, Calvet A, Michetti J, Maret D. Assessment of automatic segmentation of teeth using a watershed-based method. Dentomaxillofac Radiol. 2018;47:20170220.
11. Halazonetis DJ. Cone-beam computed tomography is not the imaging technique of choice for comprehensive orthodontic assessment. Am J Orthod Dentofacial Orthop. 2012;141:403, 405, 407.
12. Martin CB, Chalmers EV, McIntyre GT, Cochrane H, Mossey PA. Orthodontic scanners: what’s availble? J Orthod. 2015;42:136–43.
13. Mayoral G. Treatment results with light wires studied by panoramic radiography. Am J Orthod. 1982;81:489–97.
14. Rossini G, Parrini S, Castroflorio T, Deregibus A, Debernardi CL. Diagnostic accuracy and measurement sensitivity of digital models for orthodontic purposes: A systematic review. Am J Orthod Dentofacial Orthop. 2016;149: 161–70.
15. Rusinkiewicz S, Levoy M. Efficient Variants of the ICP Algorithm. Proceedings of the International Conference on 3-D Digital Imaging and Modeling (3DIM). 2001:145–52.https://doi.org/10.1109/IM.2001.924423.
16. Yang YQ, Mi ZL, Ge ZL. Comparison between the tooth length measured by cone-beam CT and the tooth length measured with Vernier calliper. Zhonghua Kou Qiang Yi Xue Za Zhi. 2013;48:689–93.
17. Yau HT, Yang TJ, Chen YC. Tooth model reconstruction based upon data fusion for orthodontic treatment simulation. Comput Biol Med. 2014;48:8– 16.
Publisher’s Note