Determining device position
through minimal user input
James McNaughton
1*, Tom Crick
2and Andrew Hatch
1Introduction
Direct-touch interfaces provide an effective digital medium in which people can col-laborate on a broad range of tasks [1]. Previous research regarding collaboration on direct-touch interfaces has generally focused on the collaboration between multiple par-ticipants across a single interface [2–4]. However, when multiple interfaces capable of interacting with each other are used, an opportunity arises for collaboration between users interacting with different interfaces; this use of multiple interface types in a shared environment can be beneficial for collaboration [5, 6].
The physical locations of interfaces can be used to aid tasks involving interaction between networked devices. One example of this is demonstrated in the SynergyNet pro-ject, a software framework built for use on direct-touch interfaces, specifically multi-touch tabletops, which allows users to perform a flicking gesture to transfer content [7]. Users flick a content item in the direction of the interface to which they wish to send content; the item travels off the side of the source interface and appears on the tar-get interface. When the item arrives on the tartar-get interface, the framework can use its knowledge of the interface locations to ensure the item travels into view from the direc-tion of the source interface. This is intended to aid users in identifying from where newly arrived content items were sent.
Abstract
In many co-located, collaborative systems there is a need for the constituent devices used to be aware of the physical positions of their networked counterparts. This paper addresses this challenge by presenting a novel method of utilising users’ judgement of direction to obtain the location and orientation of a touch interface. The technique requires a user to draw several arrows on an interface which point towards physi-cal landmarks in an environment. This allows for the setup of interface locations in a way which is (i) quick; (ii) inexpensive; (iii) not encumbering; and (iv) capable of being performed despite obstructions in the environment. A user study is presented which investigates what influence a user’s accuracy has on the technique’s resulting calcu-lated location of an interface. The study reveals that the magnitude of a user’s inaccura-cies is proportional to the size of the error in the result and that there is no improve-ment in user accuracy with practice. Finally, we make observations on the future extension and application of this technique.
Keywords: User input, Positioning, Device location, Touch devices, Collaboration, HCI
Open Access
© The Author(s) 2017. This article is distributed under the terms of the Creative Commons Attribution 4.0 International License (http://creativecommons.org/licenses/by/4.0/), which permits unrestricted use, distribution, and reproduction in any medium, provided you give appropriate credit to the original author(s) and the source, provide a link to the Creative Commons license, and indicate if changes were made.
RESEARCH
*Correspondence:
Projects such as SynergyNet showcase the need for an interface to have knowledge of its location relative to networked interfaces surrounding it. Another example of the benefits of an interface knowing its location originates from a system which uses mul-tiple projectors where projected outputs overlap. The outputs are seamlessly stitched together by the system to give the appearance of a single projection. In order for this to be achieved the system must have information regarding the relative positions of each projected output. The stitching of multiple projector outputs to create large public dis-plays is becoming much more common [8]; furthermore, each system which utilises the stitching of visual outputs needs a method of attaining their locations.
With systems requiring knowledge of the locations of their interfaces, a simple and effective method of obtaining this information is required. It is possible to measure the location and orientation of an interface using physical tools such as rulers and protrac-tors; because of the time consuming nature of this manual measurement strategy it is best suited for an environment in which the interfaces remain in a fixed position for long periods of time. However, there are scenarios in which the interfaces may be moved on a regular basis. For example, the SynergyNet project is intended for educational envi-ronments; these classroom environments are physical spaces in which furniture is fre-quently moved or rearranged to accommodate different learning activities during the course of a day [9]. It is therefore likely that any interfaces in the environment used by the system will not remain in fixed positions. Measuring the locations and angles of each interface in the environment directly (i.e. with measuring tapes, rulers and/or protrac-tors), then inputting this information into the system will take time on every reconfigu-ration of the environment. In this time the system will not function as intended because its knowledge of interface positions will be incorrect.
Incorrect knowledge of interface positions is problematic for systems which use the information to stitch multiple visual outputs [8]. The image displayed by a repositioned interface would no longer align with the output from other linked interfaces and there-fore would not be appropriately stitched. Therethere-fore, a method of obtaining the position of an interface quickly, without the need for time consuming measurements, is required.
Background
Obtaining the position of an interface can be achieved through a variety of technological means. The use of RFID chips [10] is one such technological approach. These devices are inexpensive and can be used to obtain the positional information of the object to which they are attached. However, the accuracy of locations given by RFID chips is depend-ent on the number of sensors in an environmdepend-ent—despite the relatively low cost of the chips, the large number of sensors needed for accurate readings can be expensive. Also, the addition of more sensors requires the system to spend more time compiling the positional information for each RFID chip detected [10]. The same trade-off between expense and accuracy is also present for similar technologies using electromagnetic fre-quencies, such as wi-fi [11].
from the sensors’ actual locations to a significant degree [12]. This technology can also be affected by obstructions; an object blocking an infra-red sensor’s view of one or more infra-red light sources can result in the system obtaining incorrect positional informa-tion. Therefore, for this technology to be used in a system, the environment must be clear of obstructions and have a consistent ambient light level. These two restraints make this technology unsuitable for a number of potential usage scenarios.
Visible light can also be used for detecting the location of an interface [13]. Using light sensing technology, an interface can detect its location by using patterns projected from a light source. However, similar to infra-red sensors, these visible light sensors require a clear view of as much of the projected light pattern as possible; if obstructed, a sensor’s reading would also result an inaccurate calculation of its location.
Visual markers called fiducials [14], which are often used in augmented reality sys-tems, could also be used for obtaining the position of an interface. A camera is used to identify and locate the markers which each carry a unique pattern recognisable by machine vision. Several markers positioned on or around an interface could be located by a fiducial recognition system. However, this technology requires a clear line of sight between the camera and the fiducials. Like other location sensing technologies [10, 12, 13], obstructions around the interface can cause inaccurate results.
When attempting to obtain the location of an interface, an alternative to using sensing technologies is to utilise a technique driven by user input. An example of this approach is where users measure the locations of the interface directly and input the information into the system through text entry. User input approaches have the disadvantage of rely-ing on the accuracy of the human input, whereas sensrely-ing technologies can be relied on to be precise within certain parameters. The accuracy of users can be influenced by a range of factors which would not affect the accuracy of sensing technologies, such as the magnitude of the distances being measured [15]. An inaccurate user-generated measure-ment, input as part of a location determining technique, would result in the calculated position of the interface being incorrect. Therefore, it is important to take into consid-eration the accuracy of human-generated input when utilising techniques which rely on this approach.
Observations on each technique discussed in this section demonstrates that each has strengths and weaknesses. For example, a number of technology-based location sens-ing techniques discussed [10, 12–14] will produce inaccurate positional information if obstruction of their sensing components occurs. This is undesirable in any scenarios where obstruction may frequently occur. For example, environments in which many users may be present around the interfaces would be unsuited to these location-inferring technologies; for example, a user may stand between the sensors used by the technolo-gies to calculate positional information.
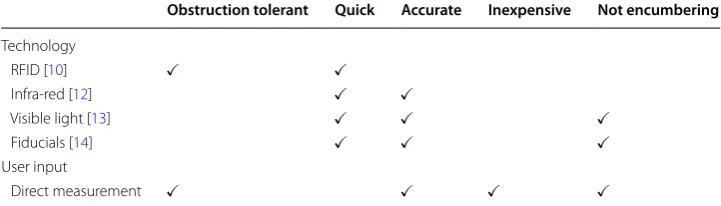
Table 1 compares the attributes of the position obtaining techniques discussed in this section. Each attribute listed in the comparison is derived from observations relating to the strengths and weaknesses of the techniques;
• If the time taken to perform a technique is less than the time taken to measure the locations directly by hand it is deemed Quick;
• If a technique produces usable positional information it is deemed Accurate;
• If a technique does not require additional hardware to be purchased it is deemed Inexpensive;
• If a technique does not require an additional physical device to be attached to the interface it is deemed to be Not Encumbering.
For each approach discussed in this section a mark is given under each heading to which it conforms. The significance of the list required attributes of each position obtaining technique is strengthened through their similarity to requirements often outlined for human–computer interaction [16], user-centered modelling [17] and natural user inter-face [18] design. These are both domains which often encompass investigations into, and usage of, position obtaining techniques.
Table 1 shows that none of the position-obtaining techniques discussed are with-out a weakness. The majority of the technology-based techniques have issues regard-ing obstruction which makes them unsuitable for use in scenarios where the interfaces may have obstructions between them, such as users. However, the techniques which do not have the issue of obstructions that utilise RFID chips and direct measurements, also have weaknesses that make them unsuitable for this scenario. RFID tags may be too inaccurate or expensive to use and direct measurement would require a comparatively significant amount of time for re-measurement whenever the interfaces are moved.
A new approach is thus needed for scenarios such as the classroom example given in “Introduction” section, where accurate measurements of the interface positions must be performed quickly with many users populating the environment. As we have demon-strated, the technique is required to be obstruction tolerant, quick, accurate, inexpen-sive and not encumbering. Our approach, which potentially fulfils these requirements, is presented in the following section.
Technique
It is clear that the presence of users can prove to be a major disruption to many location sensing technologies; we thus seek a technique which can not only continue to work as intended with users present but can utilise their presence. In accordance with this obser-vation, we propose a novel technique utilising user input that can determine an inter-face’s location and orientation in a physical environment. This technique can employ
Table 1 Comparison between the attributes of several position obtaining techniques
Obstruction tolerant Quick Accurate Inexpensive Not encumbering
Technology
RFID [10]
Infra-red [12]
Visible light [13]
Fiducials [14]
User input
users’ mobility and sense of direction to overcome any obstructions which may have caused technological alternatives to produce inaccurate results.
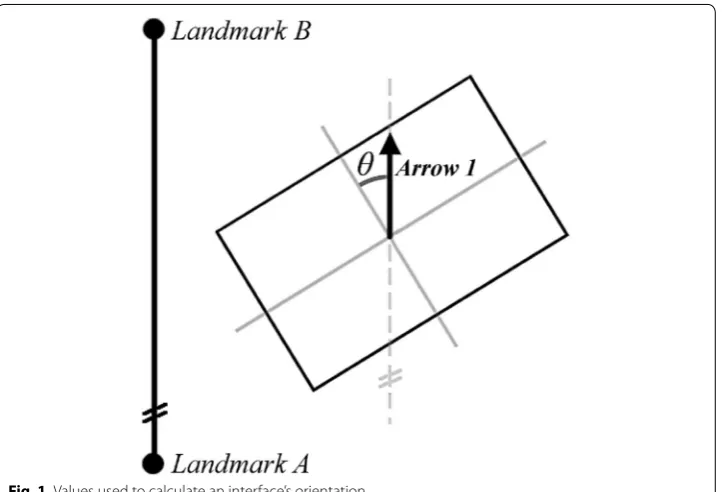
The technique utilises two physical landmarks which share the same environment as the interfaces being located. The distances between these two landmarks must be made known to the system. Any of the resulting calculated positions and orientations from the technique are relative to the landmarks. The technique requires users to draw three arrows which relate to the locations of the landmarks.
The first of the three arrows used in the technique determines the orientation of the interface on which it is drawn. The user draws the arrow parallel to the imaginary line between the two landmarks. The angle between this arrow and the local y-axis of the interface, θ, represents the orientation of the display as shown in Fig. 1. The user should draw this orientation arrow in the same direction on all the interfaces being located. θ can then be used to create a vector representing the real-world environment’s y-axis locally on the interface; this can then be used in calculating the interface’s physical position.
After drawing the orientation arrow, the user is required to draw two further arrows which point directly to the landmarks (see Fig. 2); each of the arrows must point towards a separate landmark. The angles of the user drawn arrows from the world’s y-axis, α and
β, are used to determine the values used in calculating the location of the interface. For each of these two arrows, the angle between the local y-axis of the interface and the arrow is summed with θ to derive α and β.
The angle between the two arrows, S, is used in conjunction with the angle between one of the arrows and the local representation of the real world environment’s y-axis, T, to determine the location of the interface. Algorithm 1 outlines the calculations involved in determining the x and y values of the interface’s centre point in the physical environ-ment. The resulting values are relative to Landmark A’s position as shown in Fig. 2.
Algorithm 1Calculating the location of an interface.
getLocation(α, β) S =α−β
T =β- 180◦
R = 90◦- T
A = 90◦- R
B = 180◦- S - A
d =sin(B)∗(u /sin(S))
x =sin(T)∗(d /sin(90◦))
y =sin(R)∗(d /sin(90◦))
returnx, y
This technique has a number of benefits over the alternatives of sensing technologies and direct measurements. The technique only needs one known value before use; this is the distance between the landmarks. Since it is a requirement of the technique that these landmarks are not moved, this value will not need to be re-measured. Therefore, the technique can be performed relatively quickly once this measurement is obtained in comparison to measuring the locations of the interfaces directly. This ability to be per-formed quickly without the need for repeated, time consuming measurements makes the technique suitable for any scenarios where the interfaces may be moved regularly, such as educational environments. Because of this the technique can be deemed Quick.
Furthermore, the technique does not rely on any additional technologies, so there is no extra cost for its implementation into a system. This independence from additional hardware ensures that the technique is Inexpensive and Not Encumbering. Also, due to the technique’s dependence on user inputs, rather than technology, it is made suitable for use in environments where there may be numerous obstructions, such as the users themselves, around the interfaces. If any immovable obstructions are present in the physical space between the interface and the reference points, a user can utilise their
knowledge of the environment to make an informed placement of an arrow. Therefore, the technique can be deemed Obstruction Tolerant.
The technique’s design also allows for its use on interfaces which do not utilise direct-touch inputs. However, the ability to directly manipulate the arrows may be advanta-geous when trying to achieve an alignment between an on-screen arrow and a physical landmark. The act of aiming towards reference points allows for a form of direct feed-back where the user can adjust the arrow until they believe they have the correct align-ment. An indirect input device may draw a user’s attention away from the interface, interrupting their concentration when aligning the arrows with landmarks. The tech-nique’s suitability for direct-touch interfaces is enhanced by the fact that text entry, which would be required with other user input based techniques, through touch inter-faces can be problematic due to their lack of tactile feedback [19].
This technique has been presented as an obstruction tolerant, quick, inexpensive and not encumbering solution. However, its dependence on the accuracy of a user’s judge-ment of direction has the implication that the positional information it produces may not be accurate. The inaccuracies in a user’s input into the technique will result in the calculated position of the interface deviating from the interface’s actual location. This deviation between the calculated and actual interfaces locations could make this tech-nique too inaccurate for use in some scenarios. Therefore, it is important to discover how a user’s inaccuracies when performing the technique affect the resulting value.
Study
A study was conducted to determine how a user’s accuracy affected the error of the presented technique’s calculated interface positions. The study focused on discovering whether the results given by the technique could be accurate enough for use in a specific scenario. The technique was implemented into a software framework and deployed on four touch-screen tablet interfaces.
Implementation of the technique
Software for the study was constructed using the SynergyNet multi-touch software framework [20]. The framework utilises a number of third-party libraries to support a wide range of functions such as networking, touch gesture recognition and multimedia support. The technique was implemented as part of an application within the SynergyNet framework which allowed for it to utilise a touch-based input.
The arrows used in the implemented technique were designed to always originate from the centre of the interface. The tail of an arrow remained in the centre of the interface while the participant could drag the arrowhead to any location on display. The arrow being manipulated would therefore point from the centre of the interface towards the location of a participant’s last relevant touch (“relevant” being defined as a touch within a certain distance of the arrowhead); this allowed participants to determine the direc-tion and length of the arrow. The participant could reposidirec-tion an arrowhead as much as they wanted. Once a participant has finished establishing an arrow’s direction they would then be expected to press a button on the interface to confirm their arrangement.
participant confirmed their arrangement of this arrow they would then be asked to posi-tion two arrows together; these are Arrow 2 and Arrow 3 as shown in Fig. 2. While each of the arrows for this stage of the technique is intended to point towards a landmark, the target for each arrow is not made explicit to the participant. As long as each of the two arrows points at a different landmark it does not matter to which landmark they point. The assumption is made in this implementation that all the interfaces are posi-tioned in the space to the right of the line heading from landmark A to B. Therefore, the arrow with the smallest clockwise angle from the environment’s y-axis is Arrow 2. With this known, Arrow 3 is known through the process of elimination. When a participant is satisfied with the positioning of both these arrows they are then asked to confirm their placement to complete the approach.
Study design
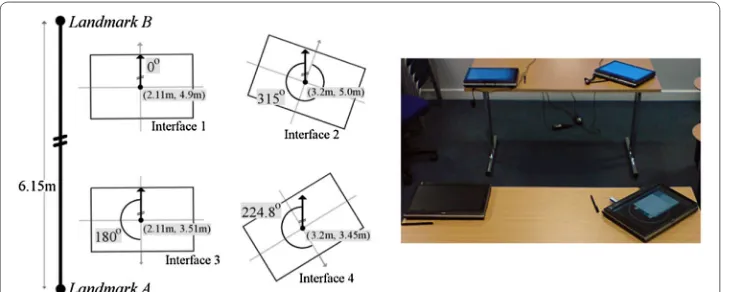
The tablet interfaces used in the study were positioned in the configuration shown in Fig. 3. This configuration was chosen to maximise the use of the four available interface devices in a non-symmetrical layout. The orientations were chosen to include (i) orienta-tions in line with the room’s coordinate system (interfaces 1 and 3), reflection (between interfaces 1 and 3) and orientations not parallel to the room’s coordinate system (inter-faces 2 and 4).
Video recordings of the participants using the technique were made so that informa-tion regarding the timings and possible mistakes could be observed. The applicainforma-tion was designed to record the local angle of any of the arrows drawn by a participant. Any of the values used by the technique to calculate an interface’s location were also recorded along with the resulting positional information.
Before the study took place, multiple direct measurements of the table’s positions and orientations were made by the study organisers to confirm the true locations. Using these values and the technique’s calculations the angle of the arrows which would pro-duce perfectly accurate positional information could be derived. Comparing these opti-mal angles with the angles of user drawn arrows allowed for a participant’s inaccuracy to be quantified.
The four tablet interface used in the study were identical. Each tablet interface had a resolution of 1024 by 768 displayed on a 247 mm by 185 mm screen.
Two hypotheses were proposed prior to the study:
Hypothesis 1: The error of the technique’s result is proportional to the error of user drawn arrows.
To support or disprove this hypothesis, the optimal angles of an interface were com-pared with the α, β and θ angles of the arrows drawn by the participants for each execu-tion of the technique. The deviaexecu-tion of a participant’s arrows from their optimal angles could then be compared to the difference between the corresponding interface’s calcu-lated and actual location information (i.e. position and orientation).
Hypothesis 2: As participant’s gain experience with the technique, their accuracy improves.
This hypothesis was derived from the observation that as users gain experience with an interaction technique their performance improves [21]. If user accuracy is found to influence the technique’s result it is important to understand changes on it caused by practice. The order of the tables on which the technique was performed was changed between participants. This allowed any influences regarding the positioning of the inter-faces to be distinguished from any learning effect the technique may have.
Results
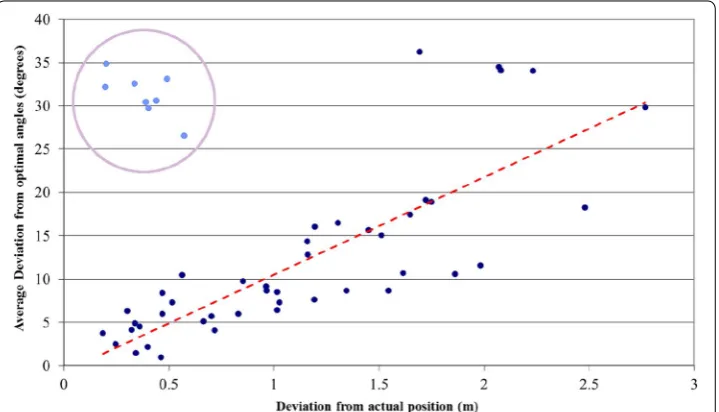
13 participants took part in the study. Each participant performed the technique four times—once on each interface—resulting in 52 instances of the technique being executed. All the participants were right-handed males who used computers daily and had at least some prior experience using the stylus interaction employed by the tablet interfaces. Figure 4 shows the average deviation of each participant’s arrows from their opti-mal equivalents against the resulting positional information’s average deviation from
the actual location and orientation. Arrow 1 in the graph represents the arrow used to collect a device’s orientation. Arrow 2 and Arrow 3 represent the arrows used to point towards the two landmarks. The graph in Fig. 4 indicates a general trend that as the aver-age deviation from the optimum increases, the difference between an interface’s actual and calculated positions increases. This supports Hypothesis 1 as a proportional rela-tionship between the participant’s inaccuracy and the error of the technique’s result is demonstrated by the graph. As noted on the graph there is a set of outlying data which does not conform to this trend; this is discussed in “Discussion” section.
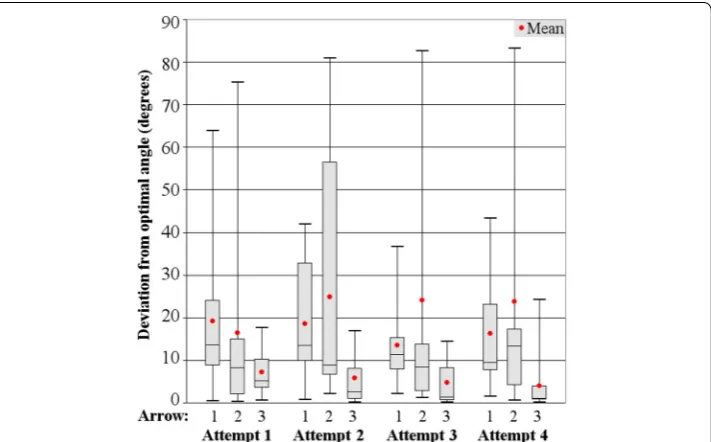
Figure 5 shows the average deviation of participant drawn arrows from their equiva-lent optimal angles over the number of times a participant has performed the technique. If Hypothesis 2 was correct, the mean of participants’ inaccuracies should decrease as the participants’ experience with the technique increases. However, the graph shows there is no discernible improvement for any of the participant drawn arrows over the number of attempts made. This indicates that there was no learning effect and that expe-rience with the technique does not improve a participant’s accuracy. The evidence thus indicates that Hypothesis 2 is incorrect.
Discussion
As identified in “Results” section, there is a subset of eight results which do not conform to the general trend of the data. These outlying results are circled in Fig. 4 outside the grouping of the majority of data. The data outside this subset of results implies that there is a proportional relationship between a user’s accuracy and the error of the result. How-ever, these outlying results represent instances where a participant has been relatively inaccurate in comparison to other executions of the technique but a position with little deviation from the interface’s actual position has been calculated. This implies that the relationship between a user’s inaccuracies and the error of the technique’s result is more complex than Hypothesis 1 states.
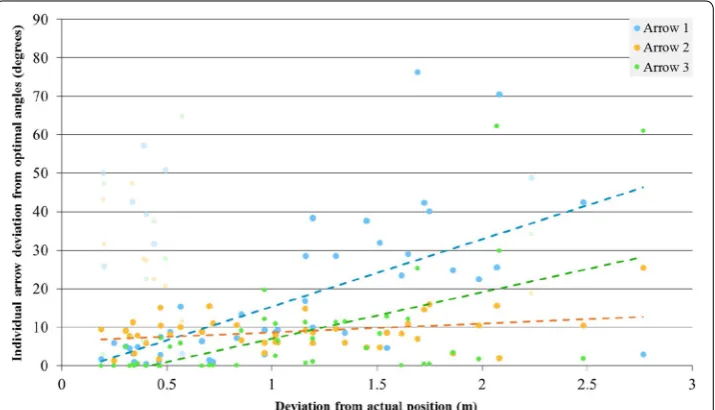
It is possible that one of the arrows used by the technique as an input has a greater influence over the result than the others. The points in the graph shown in Fig. 6 rep-resent deviation of individual participant-drawn arrows from their corresponding optimum angles for all 52 instances of the technique being performed. The graph high-lights the general trend of participant’s total inaccuracy increasing with the error of the result (ignoring the outliers previously discussed). If any particular arrow input into the technique has a greater influence than the others then a relationship between the inac-curacies of the arrow and the result would be apparent. For example, if Arrow 1 had a significantly greater influence than Arrow 2 and Arrow 3, then a correlation between the size of the participant inaccuracies when drawing this arrow and the magnitude of the error in the technique’s result would be apparent. Arrow 3 does appear to produce a larger total deviation for smaller deviations in input than the other two arrows. This could be a result of this arrow having a smaller range of user input deviations as shown in Fig. 5. Despite this, no clear relation between the inaccuracy for a single arrow and the error of the technique’s result is apparent in these results.
It is possible that a specific combination of arrows may have the greatest influence on the result, rather than a single arrow. If this were true it would mean that one of the arrows would have comparatively little influence on the technique’s result. In circum-stances where the participant inaccuracy for a hypothetical inconsequential arrow is large, but is small for the other two arrows, the total deviation from the arrow’s optimum angle would not be proportional to the result’s error. This would account for the outlying data. However, the data from the study does not support this as no relationship between the inaccuracy of two arrows and the error of the technique’s result is apparent.
There is a further possibility that different individual arrows, or combination of arrows, may have the greater influence in specific regions of the environment. This could be due to the interface’s proximity to the landmarks. If an interface inhabits a region of the display where one of the landmarks used by the technique is significantly closer than
the other, it is possible that the arrow pointing towards this landmark may hold a greater or lesser influence than in other regions of the environment. Further study is required to discover if this theory is correct. If true, knowledge of which arrow or combinations of arrows are the most influential in specific areas of an environment could be employed to allow the system to reduce the impact of user inaccuracy.
Because users do not appear to become more accurate with experience, alternative methods of improving the accuracy of the technique will need to be employed. Con-fidence ratings could be used to reduce the potential error of the technique’s results. Furthermore, factors which influence a user’s accuracy could be used to determine the initial confidence rating for an interface. These ratings could then be used to assess whether a result is potentially accurate enough for use. If not, the user could be asked to repeat the technique at this interface. An average of the results from multiple executions of the technique on a specific interface could be used as the calculated position for fur-ther use by a system. The deviation between the results could also be used to influence the confidence rating. Since Hypothesis 1 holds true, there is a proportional relationship between user accuracy and the size of the result’s error. A small deviation in the multiple results from a single interface would indicate that the user is being more accurate than a user producing a large deviation in their results.
As a user repeats the technique on an interface the confidence rating increases. A greater confidence rating implies a higher probability of a more accurately calculated position. However, one of the main strengths of this technique is the short amount of time it requires in comparison to the alternative of measuring the position of an inter-face directly. Users were noted to take an average of 26.9 s per performance of the tech-nique in the study. Repeating the techtech-nique increases the amount of time required to calculate the position on an interface. It is important to consider the trade-off between the accuracy gained from repeating the technique and the additional time required from users. Using knowledge of where in an environment users may be less accurate, the number of times the technique is repeated could be kept to a minimum allowing for the best trade-off between time taken and accuracy.
Conclusions
In this paper, we have presented a technique that can employ a user’s sense of direction to determine the location of an interface. The technique offers a method of informing a system of the location and orientation of its affiliated interfaces without the need for additional technologies or time consuming measurements. This technique is obstruction tolerant, quick, inexpensive and not encumbering. However, the accuracy of the tech-nique is dependant on the accuracy of users.
influences could include the size of the interfaces in addition to the distance between the interface and the landmarks.
A possible alteration to the technique which could result in greater accuracy is the use of more landmarks. By drawing additional lines to other landmarks in the environment (with known distances between them) the technique’s calculations could be repeated with each pair of landmarks. This could allow for deviation in the resulting calculated position to be reduced by finding the convergence between the results of each execution of the calculations. The more arrows the user draws to different landmarks the more the impact of their deviations could be minimised. In this study the authors focused on the use of two landmarks as this is the minimum required for validation of this approach. This makes this iteration of the technique the fastest in comparison with variations where there are additional landmarks because the user will need to draw more arrows. However, if the use of extra landmarks greatly increases the accuracy this could be worth the additional time taken to draw more arrows. Future studies involving the technique could focus on finding how much additional landmarks increase accuracy. Once this is known, it would be possible to find the best trade-off in the additional time to draw more arrows with accuracy of the technique.
Future iterations of the study could also make other improvements on the technique’s implementation; one feasible improvement could be to the method used for collecting the orientation of devices. The instructions to participants described the first arrow as pointing to the Room’s North, this caused confusion amongst some participants and often had to be explained a number of times by study organisers. This highlighted how the difference between this first arrow pointing in a general direction (i.e. parallel to the line between the landmarks) and the subsequent two arrows pointing to specific loca-tions (i.e. to the landmarks themselves) was difficult to convey to participants and may have increased the required cognitive load of the technique. This could have led to errors in what participants thought they needed to point at and their uncertainty may have had an impact on their accuracy.
It may also be possible for future studies to collect the device orientation through different approaches. One such method could be through the use of a rectangle on the screen which the user can rotate. User should be instructed to rotate the rectangle so that it aligns with the walls of the room. The rectangle will need to have one side highlighted that participants must align with a specific side of the room. If aligned cor-rectly, the additive inverse of the rectangle’s orientation would be the orientation of the device in the room. This method of collecting the device’s orientation could differentiate the orientation collection phase of the technique with the location determining phase enough to reduce confusion and uncertainty amongst study participants.
user input further; only needing users to draw arrows to the two landmarks. This reduc-tion in user interpretareduc-tion and input removes some of the technique’s reliance on user accuracy. Although the accuracy of in-built compasses can vary between devices, they are likely to return a more accurate result [22] than that from the user input observed in this study. This change to the technique is likely to vastly improve it, but would only be applicable in scenarios where the devices used have in-built compasses. The technique in its current form, as it is presented in this paper, allows for its use on any device which provides pointing or touch-based user input without needing any additional features.
The findings of any future studies concerning this technique would allow for improve-ments to its accuracy. Knowledge of how accurate an execution of the technique is likely to be allows a confidence rating to be employed; this confidence rating could be used to judge whether the result is usable for a specific scenario. Through this confidence rating, the best trade off could be discovered between the time the technique requires to be per-formed and the accuracy of the resulting calculated position.
Authors’ contributions
JM developed the technique discussed in the manuscript, conducted the original study and was an author in both the initial draft and subsequent redraft. TC was an author in the manuscript’s redraft, as well as providing technical advice and analysis. AH was an author in the manuscript’s original draft. All authors read and approved the final manuscript. Author details
1 School of Education, Durham University, South Road, Durham DH1 3LE, UK. 2 Department of Computing & Information Systems, Cardiff Metropolitan University, Western Avenue, Cardiff CF5 2YB, UK.
Acknowledgements
The authors would like to thank the members of the Durham University Technology Enhanced Learning Special Interest Group for supporting the redrafting of this manuscript.
Competing interests
The authors declare that they have no competing interests. Availability of data and materials
The software used in the study discussed in this paper is openly available as part of the SynergyNet 2.5 Software frame-work: https://github.com/synergynet/synergynet2.5.
Consent for publication
All authors fully support the publication of the final manuscript. Ethics approval and consent to participate
The study presented adhered to the ethical standards of research. Ethics approval to conduct this study was obtained from the Science Faculty Ethics Committee at Durham University. Participants received full details on the study before-hand, were asked to sign a consent form and were permitted to withdraw at any time.
Funding
This work was partially funded under the UK’s EPSRC/ERSC Teaching and Learning Research Programme (TLRP) Synergy-Net project (RES-139-25-0400).
Publisher’s Note
Springer Nature remains neutral with regard to jurisdictional claims in published maps and institutional affiliations.
Received: 5 July 2017 Accepted: 12 September 2017
References
1. Davidsen J, Vanderlinde R (2016) ‘You should collaborate, children’: a study of teachers’ design and facilitation of children’s collaboration around touchscreens. Technol Pedagog Educ 25(5):573–593
2. Piper AM, Hollan JD ( 2009) Tabletop displays for small group study. In: Proceedings of the 27th conference on human factors in computing systems (CHI’09). ACM Press, New York, pp 1227
4. Ryall K, Forlines C, Esenther A, Vernier FD, Everitt K, Wu M et al (2006) Informing the design of direct-touch tabletops. IEEE Comput Graphics Appl 26(5):36–46
5. Wallace JR, Scott SD (2008) Contextual design considerations for co-located, collaborative tables. In: 3rd IEEE inter-national workshop on horizontal interactive human computer systems. IEEE, New York, pp 57–64
6. Wallace JR, Scott SD, Stutz T, Enns T, Inkpen K (2009) Investigating teamwork and taskwork in single- and multi-display groupware systems. Pers Ubiquitous Comput 13(8):569–581
7. McNaughton J, Crick T, Joyce-Gibbons A, Beauchamp G, Young N, Tan E (2017) Facilitating collaborative learning between two primary schools using large multi-touch devices. J Comput Educ 4(3):307–320
8. Jones M (2011) Journeying toward extravagant, expressive, place-based computing. Interactions 18(1):26 9. Tibúrcio T, Finch EF (2005) The impact of an intelligent classroom on pupils’ interactive behaviour. Facilities
23(5/6):262–278
10. Ma H, Wang Y, Wang K, Ma Z (2017) The optimization for hyperbolic positioning of UHF passive RFID tags. IEEE Trans Autom Sci Eng PP(99): 1–11
11. Nguyen KA (2017) A performance guaranteed indoor positioning system using conformal prediction and the WiFi signal strength. J Inf Telecommun 1(1):41–65
12. Kortuem G, Kray C, Gellersen H (2005) Sensing and visualizing spatial relations of mobile devices. In: Proceedings of the 18th annual ACM symposium on user interface software and technology (UIST’05). ACM Press, New York, pp 93 13. Smith RT, Webber G, Sugimoto M, Marner M, Thomas BH (2013) Automatic sub-pixel projector calibration. ITE Trans
Media Technol Appl 1(3):204–213
14. Sagitov A, Shabalina K, Lavrenov R, Magid E (2017) Comparing fiducial marker systems in the presence of occlusion. In: 2017 international conference on mechanical, system and control engineering (ICMSC). IEEE, New York, pp 377–382
15. Al-Imam E, Lank E (2006) Biasing response in Fitts’ law tasks. In: Extended abstracts on human factors in computing systems (CHI’06). ACM Press, New York, pp 460
16. Jacob RJK, Leggett JJ, Myers BA, Pausch R (1993) An agenda for human–computer interaction research: interaction styles and input/output devices. Behav Inf Technol 12:69–79
17. Mostafa M, Crick T, Calderon AC, Oatley G (2016) Incorporating emotion and personality-based analysis in user-centered modelling. In: Research and development in intelligent systems XXXIII. Springer, Berlin, pp 383–389 18. Dietz P, Leigh D (2001) DiamondTouch: a multi-user touch technology. In: Proceedings of the 14th annual ACM
symposium on user interface software and technology (UIST’01). ACM, New York, pp 219–226
19. Weiss M, Wagner J, Jansen Y, Jennings R, Khoshabeh R, Hollan JD et al (2009) SLAP widgets. In: Proceedings of the 27th international conference on human factors in computing systems (CHI’09). ACM Press, New York, pp 481 20. AlAgha I, Hatch A, Ma L, Burd E (2010) Towards a teacher-centric approach for multi-touch surfaces in classrooms.
In: Proceedings of the ACM international conference on interactive tabletops and surfaces (ITS’10). ACM Press, New York, pp 187
21. Ji Y (2016) Personalizing interaction focused on a user’s interactive experience and potential. In: International confer-ence on universal access in human–computer interaction. Springer, Berlin, pp 70–80