GOING BENEATH THE SURFACE
The ecology of metalimnetic cyanobacteria layers in three New Hampshire Lakes
BY
SABINA PERKINS
BS Biology, with Honors in Marine Biology, Stanford University, 2012 BS Earth Systems, Oceans track, Stanford University, 2012
THESIS
Submitted to the University of New Hampshire in Partial Fulfillment of
the Requirements for the Degree of
Master of Science in
Integrative and Organismal Biology
This thesis was examined and approved in partial fulfillment of the requirements for the degree of Master of Science in Integrative and Organismal Biology by:
Thesis Director, Jeff Schloss
Cooperative Extension Natural Resources Program Leader
Dr. James F. Haney Professor of Zoology
Dr. Shane Bradt,
Cooperative Extension Water Quality State Specialist On June 10, 2019
Acknowledgments
A thesis is truly a group project and what an amazing group I have! I would like to thank my committee for their support and guidance through this process. Jeff, thank you for being my strongest advocate and for your hard work keeping me on track and finding the funding to make my research dreams a reality. Jim, your curiosity and wonder are contagious, thank you for your can do attitude. Thank you Shane Bradt for your advice on everything from presentations to punctuation and for your help seeing the bigger picture. The biggest thank you to Bob Craycraft and the New Hampshire Lakes Lay Monitoring Program for amazing analytical and moral support. I learned so much and I am so grateful. Thank you to the interns especially Abby Foley and Lucy Spence, for their extreme dedication to science and battles with fluorometers and Kaylee Verrington and Emma Murzic for mastering the one man octopus technique and running most of my samples. The field work went off the most smoothly thanks in large part to the hoard of volunteers I was able to convince to go out on lakes with me! Thanks Oliver Bender, Annie Ewert, Kate Langley, Katie Low, Walter Tokarz, Mom, and Dad! A huge shout out to Mike Gelinas for your dedication and willingness to take me out on Marsh Pond no matter the weather. Thank you also to Charlotte Cooper, Diane Lavalliere, and Maria Short for your help navigating the administrative realm of UNH. Thank you to Kate Langley for your moral support, toxin spreadsheets, and people skills, you are amazing. Thank you to Anne Ewert for teaching me how to run ELISAs and for going field sampling in a dress, what dedication. Chris Neefus, Rich Smith, Iago Hale provided much needed stats advice and my fellow graduate students for life chats, suds and science, and humoring my plogging endeavors. Many thanks to Tom Danielson, Mary Becker, and David Moore for their mad R skills.
Table of Contents
Acknowledgments ________________________________________________________________________ iii
List of Tables ___________________________________________________________________________ viii
List of Figures: __________________________________________________________________________ ix
Abstract _______________________________________________________________________________ xii
Introduction _____________________________________________________________________________ 1
When and Where Layers Form? ___________________________________________________________ 3
Toxicity of deep-water layers ______________________________________________________________ 3
Effect of Environmental Variables on Toxin Production _________________________________________ 5
Methods ________________________________________________________________________________ 7
Site Descriptions _______________________________________________________________________ 7
In the Field ____________________________________________________________________________ 8
In the Lab ____________________________________________________________________________ 10
Chlorophyll-a Extraction ________________________________________________________________ 11
Microcystin (MC) Analysis ______________________________________________________________ 11
Data Analysis _________________________________________________________________________ 11
Results ________________________________________________________________________________ 12
EXO Profiles- the seasonal development and persistence of cyanobacteria layers ___________________ 12
Total Phosphorus ____________________________________________________________________ 20
Soluble Reactive Phosphorus __________________________________________________________ 21
Nitrogen ___________________________________________________________________________ 23
Light ________________________________________________________________________________ 23
Phytoplankton Species Composition and Toxins ______________________________________________ 24
Microcystin ___________________________________________________________________________ 29
Multivariate Statistics: __________________________________________________________________ 33
Discussion______________________________________________________________________________ 39
Presence and persistence of deep water layers of cyanobacteria _________________________________ 39
Microcystin production potential of Planktothrix isothrix_______________________________________ 41
Conclusion ___________________________________________________________________________ 45
References _____________________________________________________________________________ 47
Appendix A: Additional Profile and Water Quality information ________________________________ 55
Profile Graphs: Baboosic Lake ___________________________________________________________ 55
Profile Graphs: Marsh Pond _____________________________________________________________ 56
Profile Graphs: Mirror Lake _____________________________________________________________ 58
Turbidity _____________________________________________________________________________ 60
Secchi disk readings ____________________________________________________________________ 62
Appendix B: Full ANOVA tables __________________________________________________________ 64
Stats ANOVA tables ____________________________________________________________________ 64
List of Tables
TABLE 1:SUMMARY OF LAKES WITH LAYERS FROM THE LITERATURE WITH SPECIES, LIGHT CONDITIONS AND THEIR
MICROCYSTIN LEVELS ... 4
TABLE 2:SELECTED PHYSICAL AND MORPHOLOGICAL CHARACTERISTICS OF STUDY LAKES ... 8
TABLE 3:PHOSPHORUS LEVELS IN THE LAYER SAMPLES WHEN A CYANOBACTERIA LAYER WAS PRESENT.*THE
SAMPLING EVENT IN AUGUST AT MIRROR LAKE THE LAYER SAMPLE WAS MISTAKENLY TAKEN FROM THE
CHLOROPHYLL PEAK AT 5.75 M SO NO NUTRIENT DATA IS AVAILABLE AT THE PHYCOCYANIN PEAK AT 8.0 M. ... 22
TABLE 4:SELECTED PHYSICAL AND OPTICAL PARAMETERS AT DEPTH OF PLANKTOTHRIX ISOTHRIX LAYER SAMPLING
DURING MONTHS WHEN A LAYER EXISTS. ... 24
TABLE 5:THERMOCLINE VALUES CALCULATED BASED ON THE TEMPERATURE PROFILES FOR EACH SAMPLING DATE
USING THE THERMOS.DEPTH FUNCTION IN RLAKEANALYZER PACKAGE IN R. ... 62
TABLE 6:ABUNDANCE IN CELLS/ML OF CYANOBACTERIA GROUPS MEASURED BY THE IMAGING FLOW CYTOBOT
(IFCB)... 70
List of Figures:
FIGURE 1:LOCATION OF THREE STUDY LAKES IN NEW HAMPSHIRE ... 7
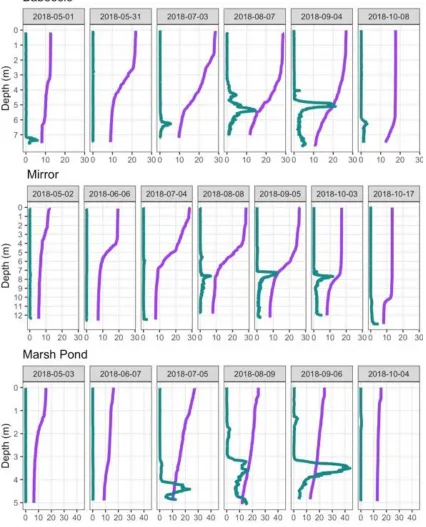
FIGURE 2:TEMPERATURE AND PHYCOCYANIN FLUORESCENCE PROFILES AT THE THREE STUDY LAKES PANELED BY SAMPLING DATE DURING THE GROWING SEASON. ... 13
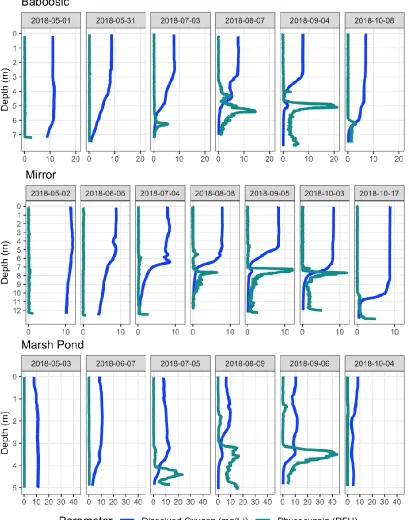
FIGURE 3:DISSOLVED OXYGEN AND PHYCOCYANIN FLUORESCENCE PROFILES AT THE THREE STUDY LAKES PANELED BY SAMPLING DATE DURING THE GROWING SEASON. ... 15
FIGURE 4:PROFILES OF TEMPERATURE, OPTICAL DISSOLVED OXYGEN, CHLOROPHYLL - A FLUORESCENCE, AND PHYCOCYANIN FLUORESCENCE COLLECTED USING A YSIEXO2 MULTIPARAMETER SONDE IN SEPTEMBER 2018 AT THE THREE STUDY LAKES. ... 16
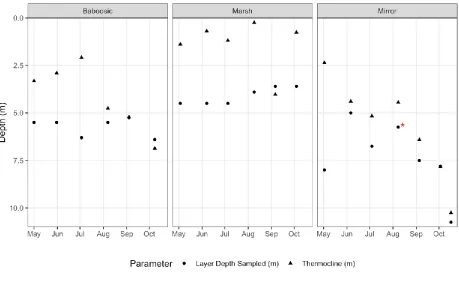
FIGURE 5:DEPTHS AT WHICH LAYER SAMPLES WERE COLLECTED, AND DEPTH OF THE THERMOCLINE IN THE THREE LAKES IN 2018. *-FOR THE SAMPLING EVENT IN AUGUST AT MIRROR LAKE THE LAYER SAMPLE WAS MISTAKENLY TAKEN FROM THE CHLOROPHYLL PEAK AT 5.75 M AND MISSED A PHYCOCYANIN PEAK AT 8.0 M. . 17
FIGURE 6:RELATIVE THERMAL RESISTANCE TO MIXING (RTRM) IN THE THREE STUDY LAKES WITH DEPTH OF CYANOBACTERIA LAYER WHERE PRESENT DENOTED BY A RED LINE. ... 19
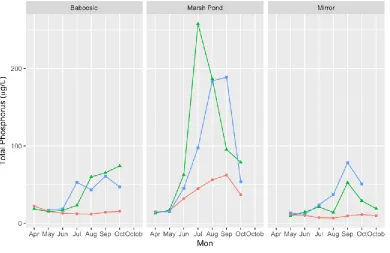
FIGURE 7:TOTAL PHOSPHORUS LEVELS IN THE THREE STUDY LAKES INCLUDING THE BOTTOM TP. ... 21
FIGURE 8:SOLUBLE REACTIVE PHOSPHORUS IN THE THREE STUDY LAKES BETWEEN MAY AND OCTOBER 2018 ... 22
FIGURE 9:TOTAL NITROGEN LEVELS IN THE THREE STUDY LAKES MEASURED MONTHLY IN 2018... 23
FIGURE 10:DENSITY OF CYANOBACTERIA (CELLS/ML) MEASURED BY THE IMAGING FLOW CYTOBOT (IFCB) IN THE SURFACE AND THE LAYER SAMPLES FROM THE THREE STUDY LAKES IN 2018 ... 25
FIGURE 12:IFCB CALCULATED BIOVOLUME OF PLANKTOTHRIX SP. RELATIVE TO TOTAL PHYTOPLANKTON BIOVOLUME
FOR EACH SAMPLE IN THE THREE STUDY LAKES IN 2018 ... 27
FIGURE 13:ABUNDANCE OF TOXIC CYANOBACTERIA OF CONCERN IN THE THREE STUDY LAKES IN 2018.A AND B
SHOW SURFACE CYANOBACTERIA ABUNDANCE.C AND D: CYANOBACTERIA COMMUNITY IN THE LAYER WITH
PLANKTOTHRIX REMOVED FROM THE COMMUNITY AND E AND F: PLANKTOTHRIX SP. ABUNDANCE IN THE LAYER
ONLY.MAY SAMPLES ARE NOT SHOWN BECAUSE NO TOXIN-PRODUCING CYANOBACTERIA OF CONCERN WERE
NOT FOUND IN THOSE SAMPLING EVENTS. ... 28
FIGURE 14:MICROCYSTIN LEVELS (+/-STANDARD ERROR) FOR THREE STUDY LAKES IN 2018. ... 30
FIGURE 15:VARIABLE LOADING PLOT FOR PARTIAL LEAST SQUARES REGRESSION RUN IN JMP.IMPORTANCE VALUES
OVER 0.8(SHOWN BY THE BLUE LINE) ARE CONSIDERED IMPORTANT ENOUGH TO LEAVE IN THE MODEL. ... 35
FIGURE 16:NMDS ORDINATION FOR CYANOBACTERIA COMMUNITY DATA FROM THE THREE LAKES WHEN A LAYER
WAS PRESENT.THE CYANOBACTERIA COMMUNITY DOES NOT DIFFER SIGNIFICANTLY BETWEEN THE THREE
LAKES (MRPP,T=-1.26,A=0.069, P =0.11). ... 36
FIGURE 17:NMDS ORDINATION OF CYANOBACTERIA COMMUNITY IN THE THREE LAKES WHEN A CYANOBACTERIA
LAYER WAS PRESENT.CYANOBACTERIAL SPECIES LOADINGS (A) AND A BIPLOT OF ENVIRONMENTAL VARIABLES
(B) ARE OVERLAID ON THE ORDINATION.THE SURFACE SAMPLES HAVE A SIGNIFICANTLY DIFFERENT
CYANOBACTERIA COMMUNITY THAN THE LAYER SAMPLES (MRPP,T=-7.899,A=0.2908, P =0.00013). ... 38
FIGURE 18:TURBIDITY AND PHYCOCYANIN PROFILES MEASURED USING THE EXO2 SONDE FOR EACH SAMPLING
EVENT IN 2018. ... 61
FIGURE 19:SECCHI DISK READINGS TAKEN FROM THE SHADY SIDE OF THE BOAT WITH A VIEWSCOPE FOR ALL THREE
LAKES IN 2018. ... 63
FIGURE 21: PLANKTOTHRIX SP. COUNTS IN CELLS/ML FROM IMAGING FLOW CYTOBOT (IFCB) BETWEEN MAY AND
OCTOBER 2018 AT ALL THREE STUDY LAKES. ... 66
FIGURE 22:IFCB CALCULATED BIOVOLUME OF PHYTOPLANKTON IN THE THREE STUDY LAKES IN 2018... 67
FIGURE 23:IFCB CALCULATED BIOVOLUME OF PLANKTOTHRIX SP. IN THE THREE STUDY LAKES IN 2018... 67
FIGURE 24:IFCB CALCULATED BIOVOLUME OF CYANOBACTERIA TAXA WITH THE POTENTIAL TO PRODUCE TOXINS IN
THE THREE STUDY LAKES IN 2018. ... 68
FIGURE 25:IFCB CALCULATED BIOVOLUME OF MICROCYSTIS SPP. IN THE THREE STUDY LAKES IN 2018. ... 68
FIGURE 26:IFCB CALCULATED BIOVOLUME OF APHANIZOMENON SPP. MEASURED IN THE THREE STUDY LAKES IN 2018.
... 69
FIGURE 27:IFCB CALCULATED BIOVOLUME OF APHANIZOMENON GRACILE, SPHAEROCYSTIS, CHRYSOSPORUM
Abstract
GOING BENEATH THE SURFACE: THE ECOLOGY OF METALIMNETIC CYANOBACTERIA LAYERS IN THREE NEW HAMPSHIRE LAKES
by Sabina Perkins University of New Hampshire
Cyanobacteria blooms take different forms: surface scums, subsurface epilimnetic blooms, benthic mats, and in some lakes, metalimnetic layers. There is limited field research on the seasonal behavior of metalimnetic layers and the contribution of layer-produced cyanotoxins to the overall toxin profile of New Hampshire lakes. Three lakes in New Hampshire were monitored monthly pre-summer stratification through post-fall mixis in 2018, tracking the formation and persistence of deep-water cyanobacteria layers and the physical/chemical/light environments where they were found. Cyanobacteria abundance and dominance were quantified through cell counts using an Imaging Flow Cytobot (IFCB) and with
phycocyanin fluorescence estimates. Persistent, nearly monospecific populations of Planktothrix isothrix
Introduction
Toxigenic cyanobacteria blooms are an increasingly apparent human health risk in lakes all over the world (Paerl and Otten; Holtcamp). Cyanobacteria are ancient creatures – the oldest known
photosynthetic autotrophs – and today can be found in a wide range of environments, both terrestrial and aquatic (Svirčev et al.; Paerl and Otten). This diverse group of microbes live in some of the most extreme environments on earth and their long evolutionary history has allowed them to develop traits that enable them to occupy niches that are inaccessible to other photosynthetic organisms. Cyanobacteria can be found surrounding volcanic hot springs, in crusts atop desert sands, living symbiotically with lichen, in the roots of cycad trees, and even in the cleanest lakes (Kaasalainen et al.; Cox et al.; Banack and Cox; Carey et al.). While not all cyanobacteria produce toxins, many species can produce a diverse array of biotoxic compounds that are detrimental to human health(Stewart et al.).
Exposure to cyanotoxins can occur in a variety of ways, from ingesting contaminated food (Ibelings and Chorus; Codd et al.), direct ingestion of toxins in drinking water (Stewart et al.), and through recreational exposure on bodies of water containing toxins (Backer, McNeel, et al.; Backer, Carmichael, et al.). In the US, most health advisories have focused on drinking water as the likeliest pathway for exposure to cyanotoxins (EPA: United States Environmental Protection Agency)1. Lake managers and health departments need to know more about the seasonal and spatial patterns of cyanobacteria populations and what may trigger toxin formation to better gauge and manage exposure risk.
Surface blooms and scums of cyanobacteria are the most obvious visible manifestations of cyanobacteria and it has been widely assumed that high exposure risks for cyanobacteria toxins are confined to areas with high cyanobacteria biomass. For this reason, many cyanobacteria studies and cyanobacteria monitoring and health advisories focus on beaches and surface waters of lakes (EPA; Murby). However, some lakes exhibit dense layers of cyanobacteria at or below the thermocline. Understanding the formation of these deep-water “metalimnetic” blooms – the basic biology, ecology, and natural history of cyanobacteria - and what factors affect and trigger the toxicity, are vital to inform effective monitoring strategies and management of lakes. Specifically, the development of monitoring plans, risk assessment, and mitigation depend on detailed knowledge of several key questions:
• When and where do these deep-water layers of cyanobacteria form in lakes in New Hampshire; what cyanobacteria species are present; and what are the environmental conditions where layers are found?
• Are these layers producing cyanobacteria toxins and if so, how significant is the contribution of layer toxin to surface water toxin levels?
1The EPA released ten-day health advisory recommendations for microcystin levels in drinking water of 0.3
g/L for children, and 1.6 g/L for adults(EPA: United States Environmental Protection Agency). Thresholds for
recreational exposure to cyanobacteria blooms have been set slightly higher at 8.0 g/L(EPA: United States
• What environmental parameters are most highly correlated with the presence/levels of toxin in lakes and might be useful to use in a management monitoring risk assessment framework?
When and Where Layers Form?
The formation of deep water layers of phytoplankton, often within the metalimnion of lakes, is a phenomenon limnologists have known about for quite some time (Reynolds). In aquatic environments, cyanobacteria have developed a greater tolerance for low light conditions that allows them to live deeper in the water column, due to the differences between the photosynthetic apparatus of cyanobacteria and algae (Oliver et al.) including use of cyanobacteria-specific accessory pigments like phycocyanin. Metalimnetic layers of cyanobacteria (most commonly Planktothrix/Oscillatoria sp.) can form in lakes with stable stratification where the euphotic zone extends below the thermocline (Reynolds). Light is very important in determining where these layers become established with layers most commonly found at depths with light levels 1-5% of surface irradiance (World Health Organization; Konopka et al.). The physics of the formation and stability of these layers is understood to be related to the shape of the
Planktothrix filaments, the associated slow sinking/rising rate, and their stable gas vacuoles (Walsby and Klemer). Many species of cyanobacteria use gas vacuoles to control their buoyancy to determine their position in the water column (Walsby and Klemer).
Cyanobacteria layers, which can range in depth depending on the lake, can last for weeks and occur in lakes of varying trophic states. They have been seen in eutrophic lakes (Lindholm and Meriluoto), mesotrophic lakes (Halstvedt, Rohrlack, and Andersen; Garneau et al.), and lakes that are meso-oligotrophic (Cerasino et al.). These layers have been shown to change their vertical distribution in response to changing light conditions and become entrained in surface waters for periods of the summer (Reynolds; Lindholm and Meriluoto). Layers have been suggested to be a sign of recovery from
The majority of published papers that report on the toxicity of deep-water cyanobacteria layers found higher levels of the toxin of interest in the sampled layer than in the surrounding waters2 (Table 1).
Planktothrix have been shown to produce primarily demethylated forms of microcystin, especially [D-Asp3]MC-RR, [D-Asp3]MC-HtyR, and [D-Asp3]MC-LR as well as anatoxin, aeruginosin, and potentially
BMAA (Fastner et al.; Esterhuizen and Downing; Viaggiu et al.; Kohler et al.). Lindholm and Meriluoto tracked a deep water maxima of Oscillatoria [Planktothrix] agardhii over the course of three summers (1988-1990) and profiled the toxicity, chlorophyll-a and lake parameters such as light, temp, DO, and Secchi disk depth (Lindholm and Meriluoto). They measured microcystin-RR and extracted chlorophyll-a levels every meter weekly and found that chlorophyll-a and toxicity tracked very well, both peaking at 6-8m. The toxin peaked at around 30 μg L-1 every summer in the metalimnion and did show entrainment
into surface waters contributing to the distribution of microcystin in Lake Ostra Kyrksundet. Cerasino et al. (2016) tracked a suite of toxins in Lake Garda over five years and found accumulations of
cyanobacteria and toxins in the metalimnion. The highest toxin value they measured, 540 ng L-1, was
sampled in August at 20m depth. However, most concentrations measured were very low with the median toxin value at 20 m of 12.4 ng L-1. MC-RRdm was the most prevalent toxin measured in Lake Garda.
Table 1 summarizes the light conditions and toxin levels found in other studies on lakes with deep-water cyanobacteria layers in Europe.
Table 1: Summary of lakes with layers from the literature with species, light conditions and their microcystin levels
Author/Reference Lake Species Light Microcystin Notes
(Boscaini et al.) Lake Ledro (Italy)
Planktothrix rubescens
2-11
mol/m2/s
Up to 10-20
g/L (Halstvedt,
Rohrlack, Andersen, et al.; Rohrlack et al.)
Lake Steinfiorden (Norway) Planktothrix rubescens and
<1 W/m2 Strains of both
species shown to produce
Toxin levels estimated from figure 9
2 Part of this phenomenon could be due to positive publication bias, i.e. only cyanobacteria layers that produce
Planktothrix agardhii
microcystin. (LC-MS/MS) 5-55 g/L
in Rohrlack et al. 2010 (Fastner et al.) Lake
Wannsee and Lake
Arendsee (Germany)
Planktothrix agardhii and
P.rubescens
-- P. agardhii:
>1200 total MC
g/g dw
P. rubescens: >5000 g/g dw (Briand et al.) Lac du
Bourget (France)
Planktothrix rubescens
-- Natural in-lake: >6 g/L total MC
Cultures: max extracellular MC: 1,600 g/L
Samples collected from set discrete depths - didn’t track peak of layer
(Cerasino et al.) Lake Garda (Italy)
Planktothrix rubescens
-- Natural in-lake: Peak: 540 ng/L Median: 12.4ng/L
Didn’t track peak of layer, always sampled 20m (Lindholm and Meriluoto) Lake Ostra Kyrksundet (Finland) Oscillatoria agardhii 5-15
E/m2/s
20-40 g/L 3-year study showed recurrent depth maxima and mixing with surface waters.
Effect of Environmental Variables on Toxin Production
Nutrients, light, and temperature have been suggested as the major factors influencing the production of toxins in cyanobacteria (Sivonen and Jones; Reynolds). Light affects toxin production in different cyanobacteria groups differently, with Microcystis spp. producing higher toxin levels at higher light levels while Planktothrix spp. produce higher toxin levels under low light conditions in the lab (Sivonen and Jones; Sivonen). There is also some evidence that total microcystin per biovolume might not change based on light regime but the form may shift from RR to LR (Tonk et al.).
Most studies on the environmental factors influencing the spatial distribution and toxicity of
States to understand the health impacts of cyanobacteria blooms necessitates a greater understanding of the potential impact of metalimnetic blooms on drinking water, and public health as a result of
recreational activities.
Toxins have most often been reported from eutrophic lakes but mesotrophic and oligotrophic lakes have toxic blooms as well (Nimptsch et al.). In general, cyanobacteria produce less toxin in low-nutrient conditions but nitrogen fixing genera are still able to produce toxins in a nitrogen-free environment (Kaebernick and Neilan; Sivonen and Jones; Haney and Ikawa). Phycocyanin levels, measured either as fluorescence or extracted, have been presented as a management tool for predicting cyanobacteria presence, abundance, and potentially associated microcystin levels (Francy et al.; Kasinak et al.). Amanda Murby McQuaid found that phycocyanin fluorescence was significantly correlated to microcystin toxin levels in the surface waters in a study of five New Hampshire lakes (Murby).
Methods
Site Descriptions
Baboosic Lake:
Baboosic Lake is a mesotrophic natural lake with a history of cyanobacteria blooms in the spring and summer. A water-quality program aimed at reducing nutrient loading to the lake began in 2008 following a report that highlighted the contribution of septic systems around the lake to eutrophication problems.
Figure 1: Location of three study lakes in New Hampshire
Mirror Lake:
Mirror Lake is a natural Meso-oligitrophic lake located just to the east of Lake Winnipesaukee. Mirror Lake was designated as impaired for primary contact recreation due to recurring cyanobacteria surface scums in 2008 and was placed on the Federal Section 303(d) list (Chapman and Connor). A deep-water layer of Oscillatoria [Planktothrix] has been noted in several previous studies (Chapman and Connor; Murby).
Marsh Pond:
Table 2: Selected physical and morphological characteristics of study lakes
Watershed area data for Baboosic and Mirror comes from management plan documents and information for Marsh Pond comes from NHDES reports (Chapman and Connor; Geosyntec Consultants).
In the Field
In 2017, during the course of routine sampling of 28 lakes with the New Hampshire Lakes Lay Monitoring Program, deep water layers of cyanobacteria were identified in six lakes using a YSI EXO 2 Multiparameter Sonde equipped with a probe to detect in-vivo chlorophyll a and phycocyanin
fluorescence. Three lakes with significant cyanobacteria layers in 2017 were selected for intensive monitoring during the 2018 field season: Marsh Pond, Baboosic Lake, and Mirror Lake (Figure 1). These lakes were sampled monthly from April 2018 through October 2018. Due to sampling constraints, samples were collected at one centralized sampling location at the deepest portion of each lake to characterize overall lake condition.
At the deep site, the EXO 2 was lowered at a rate of 0.5 m/min through the water column of the lake from the surface to the sediment at the deepest point, rapidly logging data every three seconds to create a near-continuous vertical profile of chemical parameters. From 2017-2018, the EXO 2 was equipped with sensors for temperature, depth, optical dissolved oxygen, pH, turbidity, specific conductance, oxidation reduction potential, fluorescent dissolved organic matter (FDOM), and chlorophyll a/phycocyanin fluorescence. A peak in the phycocyanin fluorescence indicated the presence of a deep-water
Lake Town Latitude (Decimal Degrees) Longitude (Decimal Degrees) Surface Area (acres) Max Depth (m) Average Depth (m) Watershed Area (acres) Average Secchi Depth (Range) (m) Average Surface Extracted Chlorophyll – a (g/L)
Baboosic Amherst and Merrimack, NH
42.88389 N -71.57722 W 228.5 8 3 1,909 4.1
(3.2-4.8) 4.3
Mirror Tuftonboro, NH
43.62165 N -71.26070 W 332.8 13 4.1 1,459 5.7
(5.2-6.1) 2.1 Marsh Pond New Durham, NH
43.45980 N -71.18189 W 15.0 5 -- 9,889 3.3
cyanobacteria population and triggered the cyanobacteria layer sampling protocol. The point of maximum phycocyanin fluorescence was used to determine the target depth for layer sampling. When there was no spike in phycocyanin present, as found in spring months, the “layer” sample was collected from the depth where the layer was last seen in 2017. The EXO was calibrated regularly to prevent instrument drift (Yellow Springs Instruments).
Underwater irradiance was measured with a Li Cor model LI-192 Underwater Quantum Sensor (PAR) mounted on model 2009S lowering frame positioned to monitor downwelling light. A deck cell (LI-190) mounted on a frame and leveled was used to account for changing sunlight conditions due to fluctuating cloud cover. Both sensor outputs were recorded using a model LI-1400 data logger that applied each sensor’s specific calibration constant and recorded the date, time, deck cell and underwater cell response. A light profile was collected at the lake surface (0.1m) then every half meter to the bottom of the lake.
mL of concentrated sulfuric acid preservative. Water samples were placed in the dark in a cooler and transported on ice back to the lab.
In the Lab
Fifteen mL from each triplicate water sample from the surface and the layer were combined and one sample for each depth was shipped overnight on ice to Dr. Ann St. Amand at PhycoTech (St. Joseph, Michigan) to be counted using an Imaging Flow CytoBot (IFCB). Cell counts and biovolume estimates were provided for each taxon in each sample based on images captured as particles pass through a flow cell. These cell counts are semi-quantitative and cannot be directly compared to traditional cell counts. All samples were run on fresh material within 24 hours whenever possible.
For each triplicate water sample, 250 to 500 mL were filtered for chlorophyll using vacuum filtration on 0.45 m cellulose membrane filters (47 mm diameter Millipore HAWP), dried in the dark overnight and then frozen at -20 C until chlorophyll extraction analysis (Schloss and Craycraft). The filtrate from one replicate was poured into an acid-washed bottle and analyzed for soluble reactive phosphorus and nitrate according to the LLMP standard operating procedure (Schloss and Craycraft). 60 mL of filtrate from another replicate was set aside for fluorescence analysis and Total Color analysis (Schloss and Craycraft). An additional 250 to 500 mL of water from each replicate was filtered through a Pall A/E 1
m glass fiber filter and immediately frozen at -20 C for extracted phycocyanin analysis. Samples
collected for total phosphorus and total nitrogen analysis were run within two weeks according to the LLMP SOP (Schloss and Craycraft).
Chlorophyll-a Extraction
Chlorophyll-a extraction was achieved by grinding filters with glass tissue grinders in 90% acetone with MgCO3 buffer and extracting samples for at least four hours in the dark at 4 C. Samples were then
read on a Genesys 6 Spectrophotometer using a 5.0 cm pathlength glass cuvette. To quantify the absorbance due to pheophytin 0.5 mL of concentrated sulfuric acid was added to each sample (Schloss and Craycraft).
Microcystin (MC) Analysis
Whole lake water (1.8 mL) was pipetted into pre-weighed and labelled plastic Eppendorf tubes. Tubes with sample were re-weighed and then samples were subjected to three cycles of freezing at -80 C, thawing, and then sonicating for three minutes in the Ultrasonic Bath CPX/CPXH series (ThermoFisher Scientific, Waltham MA) to break up the cells and release the toxin. Samples were then placed in a Jouan RC 10.10 Speed-Vac until the sample volume in the tubes was reduced to about 0.2 mL to further
increase the level of detection of toxin. Specific concentration factors were determined for each sample by the weight difference pre and post speed-vac. Tubes were then weighed again and refrozen at -20 C until microcystin concentration was determined using a high sensitivity EnviroLogix® ELISA QuantiPlate ™ kit (EnviroLogix). This kit quantifies multiple different microcystin variants (MC-LR, MC-LA, MC-RR, MC-YR) but reports values as MC-LR equivalents. Toxin concentrations were determined from optical density measurements on a Bio-Tek Instruments Inc. EL800 Universal Microplate Reader using a four parameter logistic standard curve for calibration as per kit instructions.
Data Analysis
Squares Regression is a flexible multivariate statistical method that has only recently been applied to ecology and can be used as an exploratory analysis tool to select suitable predictor variables especially in situations where the number of observations is fewer than the number of predictor variables. PLSR does not require the same restrictive assumptions that underlie other regression based tools (Carrascal et al.).
When a layer was present, patterns in cyanobacteria community composition were explored using Nonmetric Multi-Dimensional Scaling (NMDS) in PC-ORD. Differences between groups (between lakes and surface vs. layer) were tested using Multiple Response Permutation Procedure (MRPP) also in PC-ORD (McCune and Mefford).
Results
EXO Profiles- the seasonal development and persistence of cyanobacteria layers
The interface between the phycocyanin peak and the water above it is often very sharp whereas the decline in fluorescence is more gradual below the layer peak to the bottom of the lake. In Baboosic Lake and Marsh Pond the peaks moved up in the water column over the course of the season. However, in Mirror Lake, the layer appeared just above 8.0 m in August and remained at a similar depth until October. Depths of the phycocyanin peaks ranged from 3.6 m to 4.5 m in Marsh Pond, 5.25 m to 6.4 m in Baboosic Lake, and from 7.5 m to 7.8 m in Mirror Lake (Figure 2). These phycocyanin peaks presented at the interface between the metalimnion and hypolimnion in the study lakes. Profiles indicate that sampling was started before stratification had fully set up in the spring of 2018 and went until the mixed layer extended below the level of the cyanobacteria layer in the fall (Figure 2). Baboosic and Mirror Lake had not fully turned over by the end of sampling. The temperature profiles for Marsh Pond show that while the surface 0-3.0m sample extends below the level of the true epilimnion, the phycocyanin layer never overlapped with the 0-3.0m surface samples.
In spring sampling events dissolved oxygen was high throughout the water column and very low levels of chlorophyll-a and phycocyanin fluorescence were detected (Figure 3). As the summer progressed, dissolved oxygen began to decline in the hypolimnetic waters, with anoxic conditions observed at the bottom of all three lakes by the July sampling event. Positive heterogrades in the dissolved oxygen profile were often but not always seen in conjunction with the phycocyanin peak, an indication that the layers are likely photosynthetically active (Figure 3). Substantial chlorophyll-a layers (spikes in the chlorophyll-a fluorescence) were observed at depths above the phycocyanin layers in Marsh Pond and Mirror Lake in 2018 (Figure 4) and at Baboosic Lake in 2017 (Appendix A: : Additional
Figure 3: Dissolved oxygen and phycocyanin fluorescence profiles at the three study lakes paneled by sampling date
Figure 4: Profiles of temperature, optical dissolved oxygen, chlorophyll - a fluorescence, and phycocyanin
fluorescence collected using a YSI EXO 2 multiparameter sonde in September 2018 at the three study lakes.
Figure 5: Depths at which layer samples were collected, and depth of the thermocline in the three lakes in 2018.
*-For the sampling event in August at Mirror Lake the layer sample was mistakenly taken from the chlorophyll peak at
5.75 m and missed a phycocyanin peak at 8.0 m.
In general, the thermocline deepened over the course of the season in Baboosic and Mirror as would be expected (Figure 5). Marsh Pond is very strangely stratified as can be seen in the shallow then abnormally deep thermocline values and the pattern in relative thermal resistance to mixing (Figure 6). Thermocline values calculated based on the temperature profiles for each sampling date using the
thermos.depth function in RLakeAnalyzer package in R and correspond to the peak of the relative thermal resistance to mixing graphs (Figure 6).
The relative thermal resistance to mixing (RTRM) is a unitless number that has been used by
limnologists for over a century as a proxy for temperature-induced density differences between two layers of water causing resistance to mixing (Birge). The larger the number the greater the difference in density between two respective depths of water and the more energy it requires to mix those layers. Lakes showed
Nutrients and Light
Total Phosphorus
Total Phosphorus ranged from 7 ppb in the surface of Mirror to 257.7 ppb in the layer in Marsh Pond in July (Figure 7). In April, May, June, and July at Marsh Pond, bottom and layer samples were collected at the same depth of 4.5m but all bottom samples were collected with a vertical Van Dorn sampler and layer samples were collected with a peristaltic pump. Total Phosphorus increased in the layer at Baboosic lake over the course of the sampling season. The surface of Mirror and Baboosic lake became depleted in phosphorus compared to their spring condition while the bottom and layer samples become enriched over the course of the season, potentially reflecting the gravity-driven settling of organic matter. However, this discrepancy between surface and bottom total phosphorus also suggests that internal nutrient loading from the sediments might be playing a role in those lakes. Total phosphorus increased in the surface of Marsh Pond over the course of the sampling period until turnover in October. The total phosphorus at the layer sampling depth peaked in July, while the bottom sample peaked in September at Marsh Pond. In all three lakes, from June until the end of the sampling season, the surface total phosphorus was always lower than the layer and the bottom (Figure 7). There is no consistent pattern across the lakes with respect to
Figure 7: Total Phosphorus levels in the three study lakes including the bottom TP.
Soluble Reactive Phosphorus
Figure 8: Soluble reactive phosphorus in the three study lakes between May and October 2018
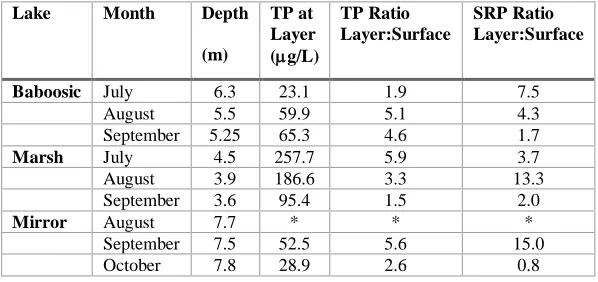
When a cyanobacteria layer was present, layer samples typically had more nutrients than the integrated surface sample – as much as 5.9 times more for total phosphorus and 15 times for soluble reactive phosphorus (Table 3). Higher nutrients at the layer depth could be explained by several factors including internal loading, phosphorus contained in cyanobacteria biomass, and remineralization of settled phytoplankton material due to bacterial decomposition. But the fact remains that cyanobacteria layers were found at areas with higher nutrients than the surface waters.
Table 3: Phosphorus levels in the layer samples when a cyanobacteria layer was present. * The sampling event in
August at Mirror Lake the layer sample was mistakenly taken from the chlorophyll peak at 5.75 m so no nutrient data is
available at the phycocyanin peak at 8.0 m.
Lake Month Depth
(m)
TP at Layer (g/L)
TP Ratio Layer:Surface
SRP Ratio Layer:Surface
Baboosic July 6.3 23.1 1.9 7.5 August 5.5 59.9 5.1 4.3 September 5.25 65.3 4.6 1.7
Marsh July 4.5 257.7 5.9 3.7
August 3.9 186.6 3.3 13.3 September 3.6 95.4 1.5 2.0
Mirror August 7.7 * * *
Nitrogen
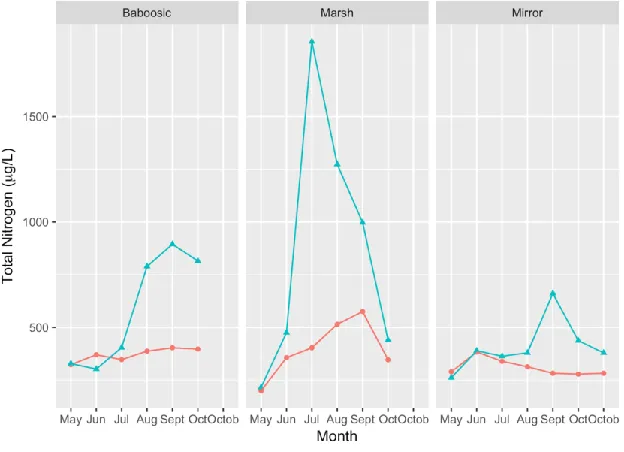
Total Nitrogen levels followed a very similar pattern to phosphorus levels and ranged from 199 g/L to 1,856 g/L over the course of the sampling season in 2018. There was no statistically significant difference in total nitrogen levels between lakes, depth categories, or months based on a split plot ANOVA analysis (p-value = 0.33, p-value = 0.14, p-value = 0.14 respectively) but in general, the total nitrogen levels were higher in the layer samples than the surface samples. Nitrate samples were taken for all dates and depths, but the results were all below the detectable limit.
Figure 9: Total Nitrogen levels in the three study lakes measured monthly in 2018
Light
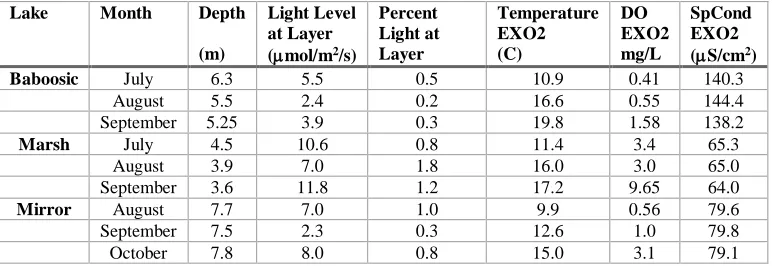
Cyanobacteria persisted at very low light levels. Light levels at the depth where Planktothrix layers were found ranged from 11.8 mol m-2 sec-1 in August at Marsh Pond to 2.3 mol m-2 sec-1 in September
Table 4: Selected physical and optical parameters at depth of Planktothrix isothrix layer sampling during months
when a layer exists.
Lake Month Depth
(m)
Light Level at Layer (mol/m2/s)
Percent Light at Layer Temperature EXO2 (C) DO EXO2 mg/L SpCond EXO2 (S/cm2)
Baboosic July 6.3 5.5 0.5 10.9 0.41 140.3 August 5.5 2.4 0.2 16.6 0.55 144.4 September 5.25 3.9 0.3 19.8 1.58 138.2
Marsh July 4.5 10.6 0.8 11.4 3.4 65.3
August 3.9 7.0 1.8 16.0 3.0 65.0 September 3.6 11.8 1.2 17.2 9.65 64.0
Mirror August 7.7 7.0 1.0 9.9 0.56 79.6
September 7.5 2.3 0.3 12.6 1.0 79.8 October 7.8 8.0 0.8 15.0 3.1 79.1
Phytoplankton Species Composition and Toxins
All three study lakes developed dense metalimnetic layers of cyanobacteria over the sampling season in 2018. Figure 10 shows the seasonal trend in cyanobacteria cell counts from the surface and the layer sample for all three lakes in 2018 as measured by the Imaging Flow Cytobot (IFCB) at Phycotech Inc . The maximum density of the layer differed slightly between the three lakes peaking in September at all three lakes with >107,000 cells/mL in Baboosic, >153,000 cells/mL in Marsh Pond, and >57,000 cells/mL in Mirror Lake4.
4 These cell counts are likely an underestimation of actual population estimates as the IFCB tends to slightly
Figure 10: Density of cyanobacteria (cells/mL) measured by the Imaging Flow CytoBot (IFCB) in the surface and the
layer samples from the three study lakes in 2018
Figure 11: Extracted chlorophyll - a from samples collected from 0-3.0 m (Surface) and at the layer depth (Figure 5)
for all three study lakes in 2018, error bars represent standard error of triplicate samples.
Figure 12: IFCB calculated biovolume of Planktothrix sp. relative to total phytoplankton biovolume for each sample
in the three study lakes in 2018
Figure 13: Abundance of toxic cyanobacteria of concern in the three study lakes in 2018. A and B show Surface
cyanobacteria abundance. C and D: cyanobacteria community in the layer with Planktothrix removed from the
community and E and F: Planktothrix sp. abundance in the layer only. May samples are not shown because no
Microcystis was present in low levels in the surface of Baboosic Lake until abundance increased dramatically in October. Microcystis also increased, albeit at lower levels, later in the season in Mirror Lake (Figure 13). Aphanizomenon spp. were detected in low levels in Baboosic and Marsh Pond with levels peaking in October in the surface of Baboosic (Figure 13). Aphanizomenon gracile, Sphaerocystis,
and Chrysosporum morphotypes were only detected in Baboosic Lake and levels peaked in the surface in September (Figure 13). Dolichospermum sp. was present in the layer of Mirror Lake during the early summer and was replaced by Microcystis sp. as the sub-dominant species in the layer samples besides
Planktothrix. A full data listing of cell counts and biovolume estimates for all species of cyanobacteria can be found in Appendix A (Table 6 and Table 7).
Microcystin
Figure 14: Microcystin levels (+/- Standard Error) for three study lakes in 2018.
When examined at the whole experiment level, microcystin levels did not differ significantly among lakes, between the surface and the layer, or across months. With the split plot experimental design used, with Lake and Depth category (Layer and Surface) making up the main plot and with month as the sub plot, there was no detectable difference in microcystin levels between lakes, levels, or months (p-value = 0.23, 0.40, and 0.07 respectively). However, there was a significant interaction between Lake and Depth category. A Tukey HSD test on the combinations of those factors indicated that microcystin levels at the surface of Baboosic Lake were significantly higher than the other combinations. Several questions were asked to delve more deeply into the microcystin data, attempting to understand the ecology of toxin formation and potentially pinpoint times or places that triggers toxin production:
Microcystin concentrations in both the surface and layer samples were very low in May, the expected result in a pre-stratification system with no detectible toxin-producing cyanobacteria of concern. Using only the data from May, the comparison of surface and layer values was run for each lake individually using a t-test because the two-way ANOVA had a significant interaction between Lake and Depth Category (Stats ANOVA tables, Appendix A). The microcystin levels in the surface are not significantly different than those detected in the layer at Baboosic Lake (n = 6, p-value = 0.32) and Marsh Pond (n = 6, p-value = 0.21). In Mirror Lake, all three readings for the layer were below the detectable limit (BDL) of the ELISA test and the surface samples were very close to the detectable limit. Even with the significant interaction, this result confirmed that close to spring mixis, microcystin levels were very low and there was no difference between the surface and the layer pre-stratification in all three lakes.
2) Are there higher levels of microcystin in the layer samples when a cyanobacteria layer is present when compared to the pre-stratification baseline values in the spring?
3) Are there higher levels of microcystin in the surface samples when a cyanobacteria layer is present at depth when compared to pre-stratification spring baseline values?
Similar to the previous test, we wanted to see if there was a significant increase in microcystin levels in the surface of the lakes when a cyanobacteria layer was present compared to pre-stratification
“baseline” toxin levels. If there is a significant difference this could indicate toxin production in the surface waters or suggest toxin transfer from somewhere else through mixing processes. In the surface samples only, the pre-stratification “starting point” microcystin levels were compared to the microcystin levels when a cyanobacteria layer was present (the months included in this analysis varied by lake and can be seen in ). Again, a significant interaction in the two-way ANOVA between Lake and Sample Type led to a simple effects analysis. Surface microcystin levels were significantly higher during the late summer (when a cyanobacteria layer was present) compared to pre-stratification surface microcystin levels in Baboosic Lake (two way t-test, n = 12, p-value = <0.001) and Mirror Lake (two way t-test, n = 9, p-value = <0.001). Marsh Pond, however, produced no significant difference between pre-stratification and “layer present” toxin levels in the surface waters (two-way t-test, n = 12, p-value = 0.36).
4) When the layer is present and successfully sampled, is there a difference in microcystin concentration between the surface and the layer?
When Planktothrix sp. was dominant in a layer and that layer was sampled (excluding data from the Mirror Lake August sampling when a cyanobacteria layer was present but not sampled), microcystin levels were significantly higher in the surface than in the layer in two out of the three study lakes. The significant interaction in the two-way ANOVA means that we have a reason to examine the simple effects of level at each lake. The data for Mirror Lake failed the assumption of homogeneity of variance and so non-parametric tests were used for all three lakes (these tests match results of parametric t-tests conducted on the two lakes that did pass homogeneity of variance). During the period of time when a layer of
the layer at Baboosic Lake (Wilcoxon rank sum test, n = 18, p-value = < 0.01) and Mirror Lake
(Wilcoxon rank sum test, n = 12, p-value = <0.01). No difference was detected between the surface and the layer in Marsh Pond during the time that the layer was present (Wilcoxon rank sum test, n = 18, p-value = 0.49).
5) Do the three lakes differ in microcystin concentration in the layer samples when a cyanobacteria layer is present?
Microcystin levels in the layer were significantly different between all three lakes when compared across all dates. Log transformed toxin data did not pass the assumption of normality in the layer-only dataset, so using an ANOVA is not prudent. The non-parametric Kruskal Wallace rank sum test indicated that there was a significant difference between microcystin levels separated by lake (Kruskal-Wallis chi-squared = 29.133, df = 2, p-value = <0.001). Testing those differences post-hoc with pairwise
comparisons using a Wilcoxon rank sum test confirms that microcystin concentrations in all three of the lakes are significantly different from each other.
Univariate statistics can tell us when microcystin levels differ between time periods or depths but in order to tease out some possible explanations of why they differ, we can use the multivariate analysis toolbox to see if the physiochemical parameters, or the biological cyanobacteria community parameters likely have a larger influence on microcystin levels in these New Hampshire lake systems.
Multivariate Statistics:
A Partial Least Squares Regression (PLSR) was run in JMP to determine which of a subset of
gracile/Sphaerocystis/Chrysosporum spp., and Aphanizomenon flos-aquae measured using the Imaging Flow CytoBot at PhycoTech Inc.
In the PLSR, two composite factors were able to explain 80% of the variability in microcystin levels, with Microcystis spp. biovolume, Aphanizomenon sp. biovolume, the taxa group containing
Aphanizomenon gracile/Sphaerocystis/Chrysosporum spp. biovolume, and Dolichospermum spp. biovolume as the most important variables explaining the microcystin levels (Figure 15). The biovolume of Planktothrix sp. is not an important factor in the model despite this genus being the most abundant in this study and one of the toxin-producing cyanobacteria species of concern. Remarkably, for the locations examined in this study, the amount of microcystin is more highly correlated with other species-specific biovolumes than the total biovolume of potential toxin-producing taxa. Less surprising is the lower correlation to the total phytoplankton biovolume. In these lakes, it appears that the biological factors of cyanobacteria community dynamics may have a stronger influence on microcystin patterns than nutrient levels.
Figure 15: Variable Loading Plot for Partial Least Squares Regression run in JMP. Importance values over 0.8
During only the period of time when a cyanobacteria layer was present, we used Non-metric Multidimensional Scaling (NMDS) to examine differences in the cyanobacteria community of the three study lakes. Non-metric Multidimensional Scaling calculates the distance between our sample units in multidimensional species space and for this ordination we used cyanobacteria cell counts as our measure of abundance. In PC-ORD 6, data was log10 (N + 1) transformed and an NMDS was run in the Autopilot
Slow and Thorough mode using Sörensen’s (Bray-Curtis) distance measures and 250 randomizations (Keister and Peterson; McCune and Mefford). A two-dimensional solution was found to have the lowest minimum stress (7.08) and Axis 1 captures 76.3% of the variation in the data and Axis 2 captures 18% of the variability in the data for a cumulative 94% of variability explained in two axes (Figure 16).
Figure 16 shows the ordination and each triangle represents the cyanobacteria community at one sampling event with samples grouped by lake. Cyanobacteria species loadings are visible as the labeled points in the ordination. The closer points are to each other the more similar their cyanobacteria
communities.
During the months when a layer was present (See for a full list of months at each lake), differences between the cyanobacteria communities in three lakes were strongly influenced by Planktothrix sp., Aphanizomenon sp. and the Aphanizomenon gracile/Sphaerocystis/Chrysosporum morphotype abundance as indicated by the larger distance of those species from the center point of the ordination plot (Figure 16). Aphanizomenon flos-aquae was found only during one sampling event in the layer of Baboosic Lake and that species thus co-occurs with that sampling event in the ordination. The Aphanizomenon
Figure 16: NMDS ordination for cyanobacteria community data from the three lakes when a layer was present. The
cyanobacteria community does not differ significantly between the three lakes (MRPP, T = -1.26, A = 0.069, p = 0.11).
Figure 17 shows the same NMDS ordination but with the sampling events are grouped by depth category. The graph shows that the layer samples clustered around the Planktothrix sp. loading whereas the surface samples tended to have higher abundances of Microcystis sp. than the layer. When samples are grouped by depth category, we see a clear and significant separation between layer and surface
Figure 17: NMDS ordination of Cyanobacteria community in the three lakes when a cyanobacteria layer was
present. Cyanobacterial species loadings (A) and a biplot of environmental variables (B) are overlaid on the ordination.
The surface samples have a significantly different cyanobacteria community than the layer samples (MRPP, T = -7.899, A
Discussion
Presence and persistence of deep water layers of cyanobacteria
The deep-water layers of cyanobacteria observed in the study lakes during the pilot study in 2017 recurred between July and August in 2018, suggesting some level of persistence from year to year. Layers developed after stratification and became established, between early June and early August (Figure 2, Figure 10). Layers were comprised of between 75% and 95% Planktothrix isothrix in all three study lakes (Ann St. Amand Pers. Comm. 1/19/19) (Figure 12). Vertical profiles show phycocyanin peaks appeared in July at 4.5 m in Marsh Pond and 6.3 m in Baboosic Lake, and at 7.7 m in Mirror Lake5 in August.
Layers persisted in all of the lakes until turnover in October (Figure 2). Layers appeared below the thermocline and then appeared to rise in the water column until they reached a temperature-induced resistance to mixing, remaining at the base of the metalimnion or right at the top of the hypolimnion (Figure 6). Following their appearance, the peak of the phycocyanin layer in Baboosic Lake and Marsh Pond moved upward toward the surface until the last sampling date for each lake after turnover (Figure 5). We did not observe any noticeable entrainment of the layers into surface waters based on the
Planktothrix cell counts () or the phycocyanin profiles (Figure 2, Appendix A: Additional Profile and Water Quality information). The interface between the phycocyanin peak and the water above it is often very sharp whereas the decline in fluorescence is more gradual below the layer peak to the bottom of the lake, possibly suggesting that the cyanobacteria congregate at the top of the layer where access to light is the greatest. This also suggests that cyanobacteria are also interacting with the waters below the layer either settling due to senescence or as a mechanism for accessing nutrient pools in the hypolimnion.
5 The phycocyanin peak at 8.0 m, at Mirror lake in was not sampled in August due to field error. A sample was
Positive heterogrades in the dissolved oxygen profile were often observed concomitant with layer formation (). While populations of Planktothrix sp. have been shown to be photoheterotrophic at low light levels the production of oxygen within these layers strongly suggests that the layers are actively
photosynthesizing (Zotina et al.). At the three lakes we sampled over the course of the season, four periods of layer progression were identified, 1) post mixis with no strata, 2) thermal stratification is present but no cyanobacteria layer occurs at depth, 3) layer present and growing , and 4) fall turnover mixed the lake below the depth of the layer. The post-turnover data from Marsh Pond should be
interpreted differently than Baboosic and Mirror as turnover was concurrent and likely caused by flushing from the drawdown of Merrymeeting Lake upstream of this flow-through system.
Layer Formation: Why are the layers showing up where we are seeing them?
One possible model of Planktothrix sp. layer dynamics in these lakes is that the cells overwinter on the lake bottom, stay there until a trigger (possibly lack of light or the onset of anoxic conditions in the bottom water) makes bottom dwelling untenable, and then migrate up through the water column until they reach a point where they are able to photosynthesize and maintain their buoyancy where they remain for the course of the season until mixing distributes them diffusely through the water column where
depending on conditions, they can either form an under-ice full water column bloom or just sink back to the lake bed and await the next growing season. We did not collect any under ice data and so winter dynamics remain postulations. The Relative Thermal Resistance to Mixing (RTRM) graphs show that the layer is often first visible below the area with a strong temperature based barrier to mixing, but the peaks are still well defined at these depths indicating that despite the low barrier to thermal mixing, the
cyanobacteria are maintaining a specific depth, possibly based on the light availability and access to bottom nutrient sources (Figure 2, Figure 6). It appears likely that the Planktothrix sp. are growing in the upper part of the layer and then senescing and sinking to the bottom of the lake explaining the lack of phycocyanin fluorescence in the epilimnetic water. It is possible that some of the Planktothrix sp. form clumps and migrate to the surface on a diel basis as observed by Walsby et al 2005. Green clumps identified as Planktothrix sp. were often visible in surface waters to the naked eye and on a video taken at Baboosic Lake. The EXO2 often does not register large clumps of cyanobacteria and cell counts can easily miss large clumps.
Microcystin production potential of Planktothrix isothrix
The phylogeny of the cyanobacteria species dominating the layers in the study lakes is a topic of some debate and confusion. Dr. St. Amand at Phycotech Inc. identified the layer-forming species in this study as Planktothrix isothrix which, according to AlgaeBase is synonymous with Planktothrix mougeotii
This confusing nomenclatural war makes matching studies of microcystin production to the different species very difficult. If we consider Planktothrix isothrix to be an interspecific taxa within P. agardhii, there are many documented examples of microcystin production in a multitude of strains of P. agardhii
(Mbedi et al.; C. Lyra et al.; C Lyra et al.). One of the strains identified as P. agardhii var. isothrix from Suda et al. 2002 was shown to have the mcyA gene and produce toxins by (Kurmayer et al.) but there are other strains of P. agardhii that do not produce toxins and lack the mcyA gene (Lyra et al., 1997). One strain of P. mougeotii (one of the recognized synonyms for P. isothrix) does not contain the full
microcystin pathway (Mbedi et al.). P. isothrix is considered a potential microcystin producer and yet in reservoirs in Brazil, the per cell toxicity is low to non-existent or potentially explainable by other toxigenic species present (Piccin-Santos and Bittencourt-Oliveira; Bittencourt-Oliveira et al.). The capacity for toxin production of P. isothrix is not confirmed by the literature and further study of the genetic potential to produce microcystin in the P. isothrix in the study lakes is warranted to determine if the strain or strains present in Marsh Pond, Mirror Lake, and Baboosic Lake contain the full microcystin pathway and therefore have the capacity to produce microcystin.
Despite the high abundance of potentially toxin-producing cyanobacteria in the layers, microcystin levels in the three study lakes were low over the sampling season, remaining well below the threshold of 0.3g/L (300ng/L) that the EPA has set as the 10 day health advisory limit in drinking water for children (Figure 14). The microcystin ELISA test kits can detect MC-RR and the fact that the form produced by
Planktothrix spp. is often demethylated should not impair detection. Microcystin from Planktothrix spp. has also been detected using ELISA test kits in other studies (Akcaalan et al.). This supports the theory that if the Planktothrix spp. were producing microcystins we should be able to detect them using the ELISA methodology.
rubescens, or the environmental conditions in these layers are not conducive to microcystin production (Christiansen et al.; Kurmayer et al.).
On the temporal interval and spatial scale at which sampling was conducted, we saw little evidence of entrainment or migration of layer populations into the surface waters. Surface levels of Planktothrix isothrix, the species that dominated the layer samples were very low in all three lakes during all sampling events. In Baboosic, no Planktothrix sp. cells were found in the surface water samples until October after turnover had mixed the lake (Table 6, Appendix A). In Mirror Lake, Planktothrix cells were detected twice in surface waters at levels below 30 cells/mL before turnover reached the layer in October after which point higher levels – 220 cells/mL – were detected. Marsh Pond had the highest levels of surface
Planktothrix among the three lakes, collected in August at 245 cells/mL. This sampling event coincided with a vertical profile that lacked a defined peak in phycocyanin values, possibly indicating some disturbance of the layer stability (Appendix A : : Additional Profile). However, the layer depth was very close to the 0-3.0 m surface sampling depth at that time so sampling error or localized entrainment of layer populations into the surface zone due to sampling is more likely. During the sampling period of May-October of 2018, no surface blooms of cyanobacteria were reported on the three lakes and it is likely that the layers did not contribute substantially to surface cyanobacterial populations.
metalimnetic layers of Planktothrix isothrix were stable and not regularly contributing to the surface toxin levels.
Due to the postulated lack of microcystin production by the major cyanobacteria in the layers and a lack of evidence of entrainment in surface waters observed during our sampling, it appears unlikely that the cyanobacteria layers in these study lakes are contributing microcystins to the surface waters. We did not test for other toxins that Planktothrix are thought to produce such as saxitoxin, anatoxin-a, and BMAA. One strain of non-microcystin producing Planktothrix rubescens was found to produce
aeruginosin 828A a potentially toxic enzyme inhibitor with a toxicity only slightly lower than microcystin when tested on crustacean zooplankton (Kohler et al.). Therefore, we cannot conclude that these deep-water cyanobacteria are not a potential human health risk despite the low presence of microcystin in the layers sampled.
What environmental parameters are most highly correlated with the presence/levels of toxin in lakes
and might be useful to use in a management/monitoring/risk assessment framework?
Planktothrix isothrix dominated layer samples in the systems we sampled. None of the environmental variables we measured were well correlated with microcystin levels and we cannot make a
recommendation for substitute for direct microcystin testing at this time.
The dramatic increase of Microcystis sp. seen in Baboosic Lake in October (Figure 13) and the corresponding late season increase in microcystin levels (Figure 14) highlights the importance of late season monitoring for cyanobacteria and toxins. This work also serves to underline the patchiness of cyanobacteria populations vertically in addition to the horizontal variability observed in New Hampshire lakes (Murby).
Conclusion
extensive survey of more lakes in New Hampshire with layers should be conducted to see if the
References
Akcaalan, Reyhan, et al. “Microcystin Analysis in Single Filaments of Planktothrix Spp. in Laboratory Cultures and Environmental Blooms.” Water Research, vol. 40, no. 8, 2006, pp. 1583–90, doi:10.1016/j.watres.2006.02.020.
Backer, Lorraine C., Jan H. Landsberg, et al. “Canine Cyanotoxin Poisonings in the United States (1920s-2012): Review of Suspected and Confirmed Cases from Three Data Sources.” Toxins, vol. 5, no. 9, 2013, pp. 1597–628, doi:10.3390/toxins5091597.
Backer, Lorraine C., Wayne Carmichael, et al. “Recreational Exposure to Low Concentrations of Microcystins during an Algal Bloom in a Small Lake.” Marine Drugs, vol. 6, no. 2, 2008, pp. 389– 406, doi:10.3390/md20080018.
Backer, Lorraine C., Sandra V. McNeel, et al. “Recreational Exposure to Microcystins during Algal Blooms in Two California Lakes.” Toxicon, vol. 55, no. 5, Elsevier Ltd, 2010, pp. 909–21, doi:10.1016/j.toxicon.2009.07.006.
Banack, Sandra Anne, and Paul Alan Cox. “Distribution of the Neurotoxic Nonprotein Amino Acid BMAA in Cycas Micronesica.” Botanical Journal of the Linnean Society, vol. 143, 2003, pp. 165– 68.
Birge, Edward A. “The Work of the Wind in Warming a Lake.” Trans. Wis. Acad. Sci. Arts Lett., vol. 18 (Part 2, 1916, pp. 341–91,
http://www.citeulike.org/group/592/article/377070%5Cnpapers2://publication/uuid/35140A16-A858-4C5D-9B66-E8396AA712AE.
Bittencourt-Oliveira, Maria Do Carmo, et al. “Cyanobacteria, Microcystins and Cylindrospermopsin in Public Drinking Supply Reservoirs of Brazil.” Anais Da Academia Brasileira de Ciencias, vol. 86, no. 1, 2014, pp. 297–309, doi:10.1590/0001-3765201302512.
Boscaini, Adriano, et al. “Vertical and Horizontal Distribution of the Microcystin Producer Planktothrix Rubescens (Cyanobacteria) in a Small Perialpine Reservoir.” Advances in Oceanography and Limnology, vol. 8, no. 2, 2017, pp. 208–21, doi:10.4081/jlimnol.2014.802.
Microbial Ecology, vol. 50, no. 3, 2005, pp. 418–28, doi:10.1007/s00248-005-0186-z.
Carey, Cayelan C., et al. “Occurrence and Toxicity of the Cyanobacterium Gloeotrichia Echinulata in Low-Nutrient Lakes in the Northeastern United States.” Aquatic Ecology, vol. 46, no. 4, 2012, pp. 395–409, doi:10.1007/s10452-012-9409-9.
Carrascal, Luis M., et al. “Partial Least Squares Regression as an Alternative to Current Regression Methods Used in Ecology.” Oikos, vol. 118, no. 5, 2009, pp. 681–90, doi:10.1111/j.1600-0706.2008.16881.x.
Cerasino, Leonardo, et al. “Multiannual Trend of Microcystin Production in the Toxic Cyanobacterium Planktothrix Rubescens in Lake Garda (Italy).” Chemistry and Ecology, vol. 32, no. 5, 2016, pp. 492–506, doi:10.1080/02757540.2016.1157175.
Chapman, Andrew, and Jody Connor. Mirror Lake Internal Phosphorus Loading and Cyanobacteria Response. 2011.
Christiansen, Guntram, et al. “Nontoxic Strains of Cyanobacteria Are the Result of Major Gene Deletion Events Induced by a Transposable Element.” Molecular Biology and Evolution, vol. 25, no. 8, 2008, pp. 1695–704, doi:10.1093/molbev/msn120.
Codd, Geoffrey A., et al. “Retention of Microcystis Aeruginosa and Microcystin by Salad Lettuce (Lactuca Sativa) after Spray Irrigation with Water Containing Cyanobacteria.” Toxicon, vol. 37, no. 8, 1999, pp. 1181–85, doi:10.1016/S0041-0101(98)00244-X.
Cox, Paul Alan, et al. “Cyanobacteria and BMAA Exposure from Desert Dust : A Possible Link to Sporadic ALS among Gulf War Veterans.” Amyotrophic Lateral Sclerosis, no. August, 2009, pp. 109–17, doi:10.3109/17482960903286066.
De Figueiredo, Daniela R., et al. “Microcystin-Producing Blooms - A Serious Global Public Health Issue.” Ecotoxicology and Environmental Safety, vol. 59, no. 2, 2004, pp. 151–63,
doi:10.1016/j.ecoenv.2004.04.006.
EnviroLogix. “Envirologix QuantiPlate(TM) Kit for Microcystins High Sensitivity.” 09-10-18, 2018, p. 1.