Diurnal Variation in Te Waihora Water Quality
Summer Scholarship Report
REPORT: WCFM Report 2011-02
TITLE: Diurnal Variation in Te Waihora Water Quality
PREPARED FOR: Waterways Centre for Freshwater Management
PREPARED BY: Kelly Fisher
REVIEWED BY: Professor Jenny Webster-Brown (Waterways Centre)
AFFILIATION: Waterways Centre for Freshwater Management University of Canterbury & Lincoln University Private Bag 4800
Christchurch New Zealand
Diurnal Variation in Te Waihora Water Quality
Abstract
During the summer of 2010/2011 research was carried out at Te Waihora/Lake Ellesmere to measure the extent of diurnal variation in important water quality parameters. Diurnal variation is the variation which occurs over a 24 hour period and in aquatic environments large diurnal variation can have significant adverse effects on the aquatic ecology. While water quality testing currently takes place on a regular basis at Te Waihora/Lake Ellesmere, spot testing is likely to miss important changes that take place over a 12 or 24 hour timeframe. The purpose of this study was to document the extremes of diurnal variation and to investigate the extent to which localised weather conditions influenced results. The study ran for a duration of 10 weeks with sampling taking place once a week. In total, seven 12 hour and three 24 hour sampling excursions occurred.
Contents
Section 1 Introduction 1
1.1 Te Waihora/ Lake Ellesmere 1
1.2 Phytoplankton Domination 2
1.3 Management of the Lake 2
1.4 Diurnal Variations in Water Quality 3
Section 2 Research Aim and Objectives 3
Section 3 Methods 4
3.1 Field Measurements 4
3.2 Sampling Sites and Times 4
Section 4 Results 7
4.1 Surface Water Conditions 7
4.1.1 Temperature 7
4.1.2 pH 8
4.1.3 Dissolved Oxygen 10
4.1.4 Conductivity 13
4.1.5 Turbidity 14
4.1.6 Nutrients; NO3-N and PO4 16
4.2 Water Quality Depth Profiles 17
4.2.1. Main parameters 17
4.2.2. NO3-N and PO4 17
Section 5 Discussion 18
5.1 Diurnal Variations in Key Parameters 18
5.2 Turbidity and Nutrients 19
5.3 The Effect of Weather Conditions 19
5.4 Limitations of Study 20
5.5 Recommendation for Further Study 21
Section 6 Conclusion 21
Reference List 22
Appendices 23
A. Lower Selwyn Huts site data 23
B. Timberyard Road Picnic Area 25
1
Section 1 Introduction
1.1 Te Waihora/ Lake Ellesmere
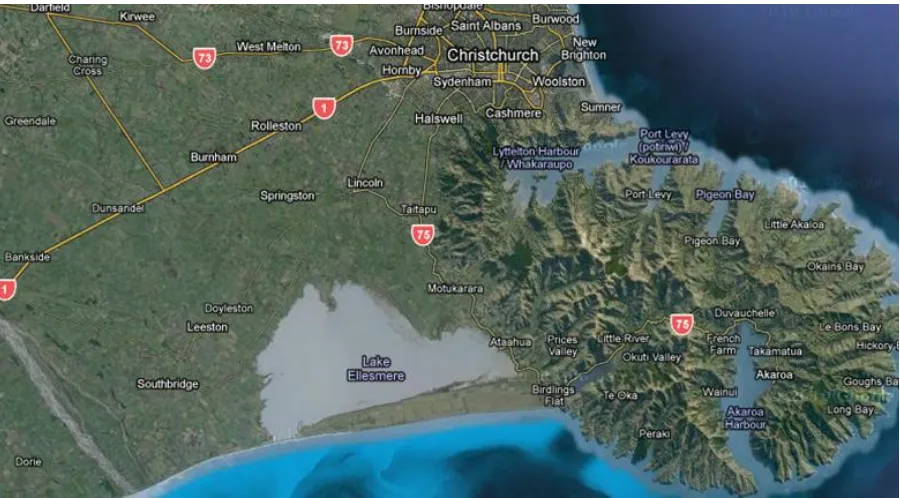
Located on Canterbury’s East Coast is Lake Ellesmere, a large, shallow, brackish and turbid lake (Taylor, 1996). Known by Tangata Whenua as Te Waihora, meaning ‘water spread out’,
Lake Ellesmere covers some 20,000 hectares, with a total catchment area comprising of 256,000 hectares (Canterbury Regional Council, 1999). The lake is formed by a gravel bar which intermittently opens to the sea (map 1), receiving its water from surface water inflows largely sourced from groundwater flowing into the catchment (Williams, 2009). Many of the spring fed streams within the catchment experience extreme seasonal flow variability which can see flow rates drop to very low levels in the summer months.
Te Waihora has long been recognised as a significant cultural, economic, ecological and
recreational asset to the Canterbury region. Maori traditionally valued the lake and it’s
catchment as a substantial mahinga kai resource and regards the lake as holding deep physical and spiritual importance (Taylor, 1996). The lake continues to support a customary, as well as a commercial fishery (Jellyman & Smith, 2009) and the life supporting functions of
the lake makes it one of New Zealand’s most important wetland systems, especially in
2
Figure 1. Te Waihora/ Lake Ellesmere Site Map, Google Maps:
http://maps.google.co.nz/maps?hl=en&tab=wl
1.2 Phytoplankton Domination
Lake Ellesmere has undergone many changes over time with the most recent major change occurring during the Wahine storm in April 1968 (Wilks, 2010). Historically the margins of Te Waihora were covered in extensive beds of macrophytes (Jellyman et al., 2009). During the Wahine storm the lake changed from a clear macrophyte dominated system to being turbid and dominated by phytoplankton (Wilks, 2010). Although the macrophyte beds had historically undergone periods of decline prior to the storm, they had been able to re-establish themselves (Hughes et al., 1974). However since the devastating Wahine storm they have never been able to re-establish (Jellyman et al., 2009). Research has been carried out to investigate the possibility of re-establishment for the purpose of improving water quality and clarity, reducing shore erosion and increasing productivity through increased habitat provision (Jellyman et al, 2009, Sagar et al., 2004).
1.3 Management of the Lake
3
Ward, 2009,Taylor, 1996, Wilks, 2010) there is no data to quantify changes in water quality parameters over a 24 hour period.
1.4 Diurnal Variations in Water Quality
Significant variability in water quality parameters can occur over a 24 hour period. If extreme, variations in dissolved oxygen (DO) and pH (how acid or alkaline a water is) can adversely affect ecology, but will be missed in routine water quality monitoring programmes, which only sample a site once in any 24 hour period. DO and pH change as a consequence of photosynthesis; during the day, photosynthetic algae and other stream vegetation will raise DO and pH, reaching a maximum at the warmest, lightest part of the day (usually early afternoon). The pH and dissolved oxygen concentrations will return to more normal levels in the evening and overnight respiration will lower DO still further. This
variation over a 24hr period is referred to as a “diurnal” variation, though it is often
monitored only through daylight hours.
In eutrophic environments, high nutrient loads cause excessive algal growth. Shallow depth and lack of riparian shading will exaggerate the effects of temperature and light on photosynthesis. Therefore, in a eutrophic, shallow lake in open farm land, such as Te Waihora/ Lake Ellesmere, the variability in DO and pH can be extreme, with very high DO and pH conditions occurring mid-afternoon, and very low DO (even anoxic) conditions occurring during the night.
Section 2 Research Aim and Objectives
The aim of this research is to document the extremes of diurnal variation in important water quality parameters in Te Waihora/Lake Ellesmere. It will include the following objectives;
To measure DO, pH and conductivity in surface water in the lake, at several key sites, over 12 hour and 24 hour time periods in the summer months of 2010/11
To investigate to what extent diurnal variation is influenced by local weather conditions
To determine diurnal variability (if any) in nutrient (nitrate and phosphate) and turbidity concentrations
4
Section 3 Methods
The Lincoln University Studentship ran for a duration of 10 weeks, excluding a one week break over the Christmas period. During this period weekly field visits were carried out. Sampling began in the first week of December 2010 and was complete by the end of February 2011. During this time seven 12 hour monitoring field visits were conducted as well as three 24 hour visits.
3.1 Field Measurements
On each field visit the same parameters were tested on an hourly basis. Temperature, pH, DO and conductivity were tested with the use of a portable monitoring probe. Results were recorded onsite and later entered into an excel spreadsheet for analysis.
During the 12 hour field visits nitrate-nitrogen (NO3-N), phosphorous (PO4), and turbidity
were tested with the use of a portable spectrophotometer and HACH reagent sachets in the morning (usually about 10.00am) and later again in the afternoon (about 3.30pm). Only the days where 24 hour monitoring was undertaken nitrate-nitrogen, phosphate, and turbidity were tested on a bi-hourly basis. The spectrophotometer measured turbidity in FAU (Formazin Attenuation Units) and this was later converted to NTU (Nephelometric Turbidity Units) with the use of 0, 10, and 100 NTU calibration solutions.
3.2 Sampling Sites and Times
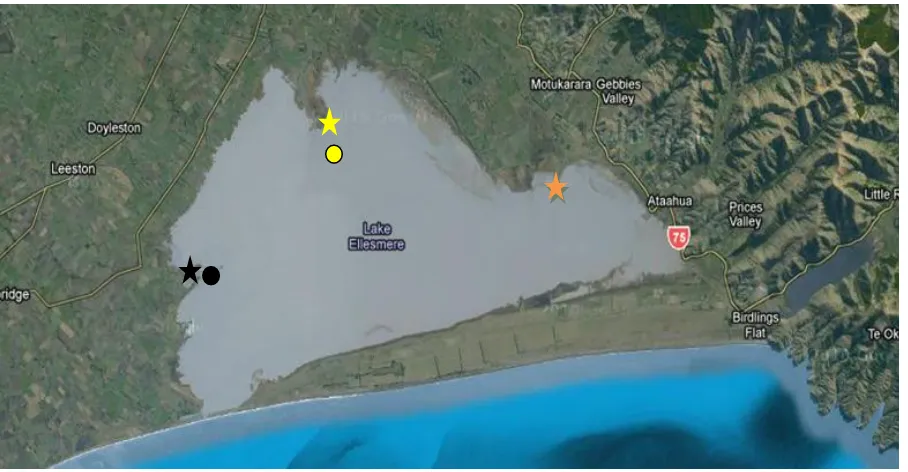
Sampling was carried out by Kelly Fisher of Lincoln University, at three different sites (Figure 2a); the end of the Lower Selwyn Hutts Walkway, the Timberyard Road Domain, and Kaituna Lagoon (Figures 2b-2d).
The majority of sampling took place from the shore of the lake. On Tuesday the 8th of February 2011, Warwick Hill the Lincoln University Engineering Technician accompanied Pauline and I to both Te Waihora and Wairewa to measure vertical profiles in the lakes. During this time we used the Lincoln University boat to measure the water temperature, pH, DO, turbidity and nutrients at different depths on the lakes. Water samples were pumped up to the surface with the use of a bilge pump.
Sampling days were chosen with an aim of selecting a variety of different weather conditions. Weather forecasts were taken from www.metservice.co.nz. During monitoring
weather conditions were noted down and Niwa’s Cliflo climate database was later used to
5
Figure 2a: Sampling Locations at Te Waohora (Google Maps). Timberyard Road Domain , Lower Selwyn Hutts Walkway , Kaituna Lagoon , and the Vertical Profiles
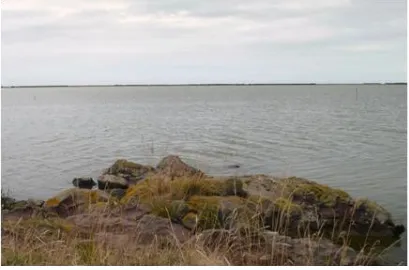
6 Figure 2c. Timberyard Road Domain Monitoring Site
7
Section 4 Results
4.1 Surface Water Conditions
4.1.1 Temperature
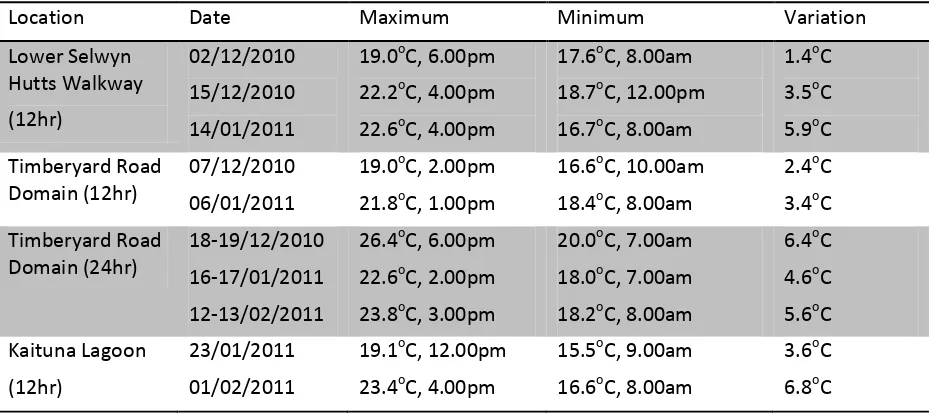
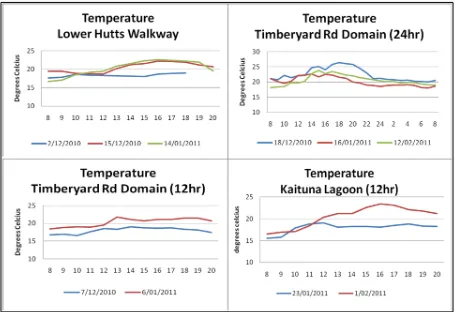
The largest water temperature variation was recorded at Kaituna Lagoon on the 1st of February 2011 as 6.8oC (Table 1). The minimum water temperature on this occasion was 16.6oC at 8.00am and the maximum water temperature was 23.4oC at 4.00pm. This was followed closely by a variation of 6.4oC at Timberyard Road on the 18th of the same month. In this instance the minimum water temperature was 20.0oC at 7.00am (December 19th 2010) with the maximum measurement 26.4oC at 6.00pm the evening before.
The smallest water temperature variation was recorded as 1.4oC at the Lower Selwyn Hutts Walkway on the 2nd of December 2010 (table 1). Here the minimum water temperature was recorded at 8.00am as 17.6oC and the maximum of 19.0oC at 6.00pm. This was followed by a variation of 2.4oC on the 7th of December 2010 at the Timberyard Road Domain.
As would be expected water temperatures were at their lowest in the earlier hours of the morning with 8.00am recorded most frequently (Figure 3). In all, five from ten minimum temperatures were recorded at this time. This occurred twice at the Timberyard Road Domain, twice at the Lower Selwyn Hutts Walkway, and once at Kaituna Lagoon.
Table 1: Water Temperature variation maximums and minimums
Location Date Maximum Minimum Variation
Lower Selwyn Hutts Walkway (12hr) 02/12/2010 15/12/2010 14/01/2011
19.0oC, 6.00pm 22.2oC, 4.00pm 22.6oC, 4.00pm
17.6oC, 8.00am 18.7oC, 12.00pm 16.7oC, 8.00am
1.4oC 3.5oC 5.9oC Timberyard Road
Domain (12hr)
07/12/2010 06/01/2011
19.0oC, 2.00pm 21.8oC, 1.00pm
16.6oC, 10.00am 18.4oC, 8.00am
2.4oC 3.4oC Timberyard Road
Domain (24hr)
18-19/12/2010 16-17/01/2011 12-13/02/2011
26.4oC, 6.00pm 22.6oC, 2.00pm 23.8oC, 3.00pm
20.0oC, 7.00am 18.0oC, 7.00am 18.2oC, 8.00am
6.4oC 4.6oC 5.6oC Kaituna Lagoon
(12hr)
23/01/2011 01/02/2011
19.1oC, 12.00pm 23.4oC, 4.00pm
15.5oC, 9.00am 16.6oC, 8.00am
8
The most frequently documented maximum water temperature time was 4.00pm. This was recorded three times, twice at the Lower Selwyn Hutts Walkway and once at Kaituna Lagoon. At Timberyard Road Domain the water temperature tended to peak earlier in the day between 1.00-3.00pm with the exception of December 18th where it peaked at 6.00pm (Figure 3).
Figure 3. Water temperature diurnal variation
4.1.2 pH
9 Table 2: pH variation maximums and minimums
Date Maximum Minimum Variation
Lower Selwyn Hutts Walkway 02/12/2010 15/12/2010 14/01/2011 8.78, 6.00pm 8.72, 3.00pm 8.70, 2.00pm 8.06, 8.00am 8.32, 8.00am 8.43, 8.00am 0.72 units 0.40 units 0.27 units Timberyard Road Domain (12hr) 07/12/2010 06/01/2011
8.82, 3 & 4.00pm 8.99, 8.00pm 8.51, 8.00am 8.57, 2.00pm 0.31 units 0.42 units Timberyard Road Domain (24hr) 18-19/12/2010 16-17/01/2011 12-13/02/2011 9.21, 8.00pm 9.07, 2.00pm 9.42, 7.00pm 8.38, 5.00am 8.31, 12.00am 8.72, 9.00am 0.83 units 0.76 units 0.70 units Kaituna Lagoon 23/01/2011
01/02/2011 9.50, 8.00pm 10.08, 7.00pm 8.72, 8.00am 9.24, 8.00am 0.78 units 0.84 units
10
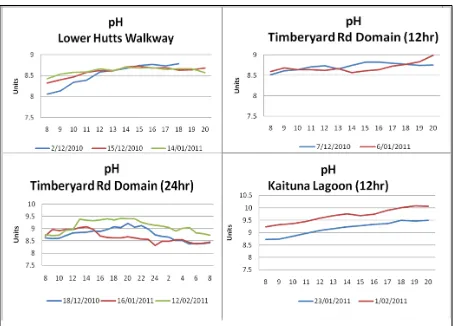
As with water temperature, the minimum pH levels were most frequently found to occur at 8.00am. Six from ten minimum pH readings were documented at this time of the morning across all three monitoring locations (table 2). pH peaks were most frequent between 7.00-8.00pm with five from ten measured at this time. 7.00pm was recorded as having the maximum pH twice, at the Lower Selwyn Hutts Walkway and Kaituna Lagoon, and 8.00pm three times, twice at Timberyard Domain and once at Kaituna Lagoon (Figure 4).
4.1.3 Dissolved Oxygen
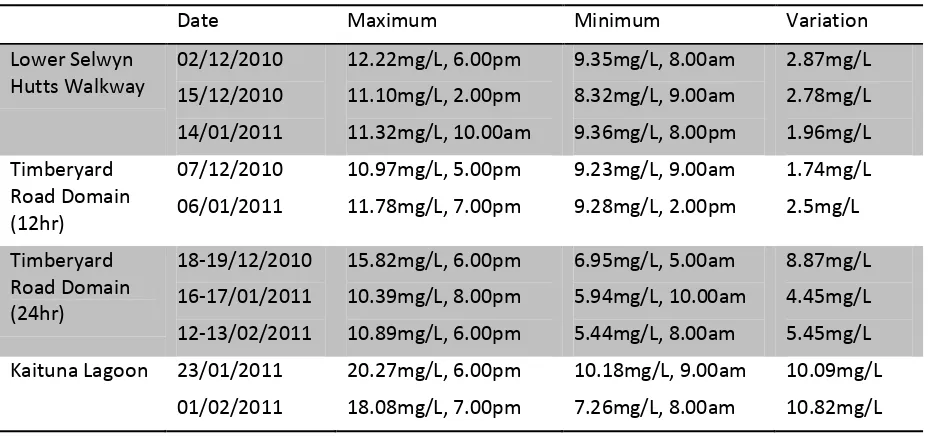
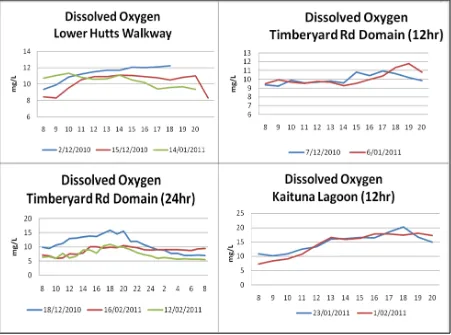
On the 1st of February 2011 at Kaituna Lagoon the largest variation in DO occurred. This saw a total DO rise of 10.82mg/L, increasing from 10.18mg/L at 9.00am to 20.27mg/L at 6.00pm (table 3). Timberyard Road Domain also experienced a large DO increase of 8.87mg/L on the 18th of December 2010. DO measurements recorded at the Lower Selwyn Hutts Walkway were significantly lower with the maximum variation being 2.87mg/L on the 2nd of February 2011 (graph set 3). The lowest variation in DO was recorded at the Timberyard Road Domain on the 7th of December 2010. On this occasion there was an increase in DO of 1.74mg/L. A similarly low increase was also recorded at the Lower Selwyn Hutts Walkway of 1.96mg/L.
8.00am and 9.00am were the most frequently recorded times for minimum DO levels (table 3). In total seven from ten minimums were recorded at these times across all three monitoring locations. 6.00pm was the most common time for maximum DO occurring on four from four occasions and again across all three monitoring sites.
Table 3. DO variation maximums and minimums
Date Maximum Minimum Variation
Lower Selwyn Hutts Walkway 02/12/2010 15/12/2010 14/01/2011 12.22mg/L, 6.00pm 11.10mg/L, 2.00pm 11.32mg/L, 10.00am 9.35mg/L, 8.00am 8.32mg/L, 9.00am 9.36mg/L, 8.00pm 2.87mg/L 2.78mg/L 1.96mg/L Timberyard Road Domain (12hr) 07/12/2010 06/01/2011 10.97mg/L, 5.00pm 11.78mg/L, 7.00pm 9.23mg/L, 9.00am 9.28mg/L, 2.00pm 1.74mg/L 2.5mg/L Timberyard Road Domain (24hr) 18-19/12/2010 16-17/01/2011 12-13/02/2011 15.82mg/L, 6.00pm 10.39mg/L, 8.00pm 10.89mg/L, 6.00pm 6.95mg/L, 5.00am 5.94mg/L, 10.00am 5.44mg/L, 8.00am 8.87mg/L 4.45mg/L 5.45mg/L Kaituna Lagoon 23/01/2011
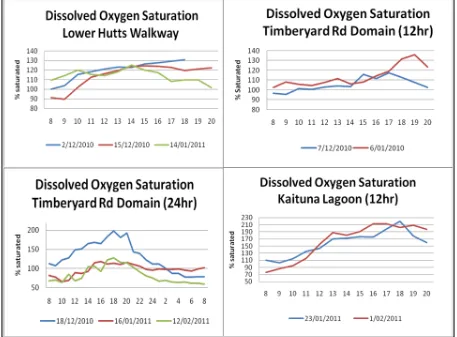
11 Figure 5. Diurnal DO variation
Dissolved Oxygen Saturation
12
Table 4. Dissolved oxygen saturation variation maximums and minimums
Date Maximum Minimum Variation
Lower Selwyn Hutts Walkway 02/12/2010 15/12/2010 14/01/2011 130.7%, 6.00pm 124.3%, 3.00pm 125.3%, 2.00pm 100.1%, 8.00am 89.8%, 9.00am 101.8%, 8.00pm 30.6% 34.5% 23.5% Timberyard Road Domain (12hr) 07/12/2010 06/01/2011 117.3%, 5.00pm 136.0%, 7.00pm 95.5%, 9.00am 102.6%, 8.00am 21.8% 33.4% Timberyard Road Domain (24hr) 18-19/12/2010 16-17/01/2011 12-13/02/2011 198.2%, 6.00pm 117.8%, 4.00pm 127.5%, 6.00pm 77.6%, 5.00am 66.2%, 10.00am 58.9%, 8.00am 120.6% 51.6% 68.6% Kaituna Lagoon 23/01/2011
01/02/2011 219.4%, 6.00pm 212.9%, 4.00pm 103.0%, 9.00am 76.1%, 8.00am 116.4% 136.8%
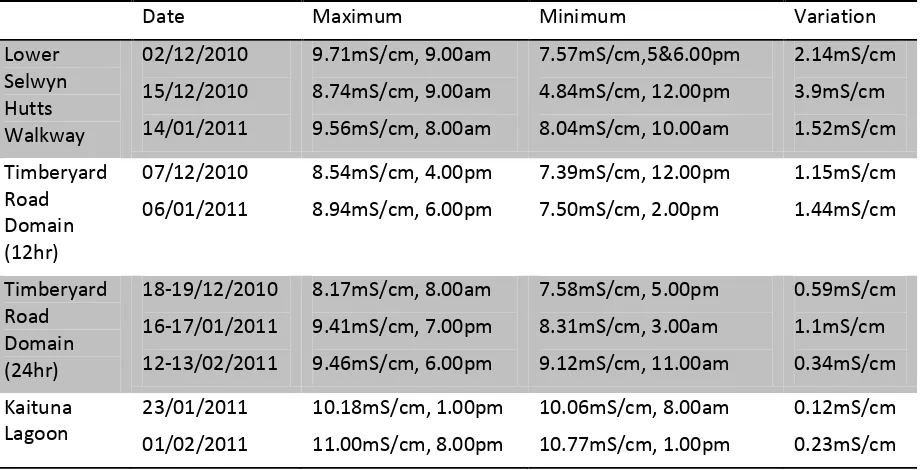
13 4.1.4 Conductivity
The portable probe measured conductivity in milli Siemens per centimetre (mS/cm). Conductivity ranged from 4.84-11.00mS/cm across the three different monitoring locations (Table 5, Figure 7). The largest variation was recorded at the Lower Selwyn Hutts Walkway on the 15th of December 2010. This saw a minimum conductivity measure of 4.84mS/cm at midday (during heavy rain) and a high of 8.74mS/cm earlier in the day at 9.00am. The smallest variation was recorded as 0.12mS/cm at Kaituna Lagoon on the 23rd of January 2011. On this day conductivity varied from a minimum of 10.06mS/cm at 8.00am to 10.18mS/cm at 6.00pm.
Table 5: Conductivity variation maximums and minimums
Date Maximum Minimum Variation
14 Figure 7. Diurnal conductivity variation
4.1.5 Turbidity
15
Table 6: Turbidity (NTU) variation maximums and minimums
Date Maximum Minimum Variation
Lower Selwyn Hutts Walkway 02/12/2010 15/12/2010 14/01/2011 116, morning 170, afternoon 316, afternoon 69, afternoon 62, morning 81, morning 47 108 235 Timberyard Road Domain (12hr) 07/12/2010 06/01/2011 89, morning 292, afternoon 73, afternoon 160, morning 16 132 Timberyard Road Domain (24hr) 18-19/12/2010 16-17/01/2011 12-13/02/2011 203, 7.00pm 380, 5.00pm 279, 9.00am 105, 3.00pm 142, 1.00pm 198, 5.00am 98 238 81 Kaituna Lagoon 23/01/2011 01/02/2011 69, morning 20, afternoon 49, afternoon 19, morning 20 1
16 4.1.6 Nutrients; NO3-N and PO4
Due to an error in the measurements carried out (using distilled water as a blank and an unfiltered, turbid sample yielding results that were too high), NO3-N and PO4 measurements
were not accurate for the majority of the sampling carried out.
However, a reliable set of nitrate and phosphate samples were taken on the last 24 hour monitoring excursion at Timberyard Road Domain. On this occasion all nutrient water samples were filtered through a 0.45um filter prior to reagent addition. Nitrate measurements ranged from <DL to 0.6mg/L. Of the 12 samples carried out on this day, 7 were below detectable levels (<DL) as shown on Figure 8.
Figure 9: NO3-N and PO4 Variation at Timberyard Road Domain, 12/02/2011
Phosphate results showed a larger variation than for nitrate. The maximum PO4
17
4.2 Water Quality Depth Profiles
4.2.1. Main parameters
Water quality profiles were conducted out from the Lower Selwyn Hutts Walkway shoreline and out from Timberyard Road Domain on two separate occasions. Profiles taken at Timberyard Road Domain did not include turbidity or nutrient sampling as the bilge pump was not there to bring the water to the surface. The lake was approximately 1m deep at the sampling points.
Table 7: Water quality profile results, Lower Selwyn Hutts Walkway Depth
(m)
Water Temperature (oC)
pH
(units)
Dissolved Oxygen (mg/L)
DO Saturation (%)
Conductivity
(mS/cm)
Turbidity
(NTU)
Surface 17.9 9.50 101.7 8.47 10.29 331
0.5 17.6 9.51 101.3 8.5 10.31 367
1.0 20.0 8.89 99.3 8.26 10.10 455
Temperature and turbidity were greatest at depth. However, pH, DO, conductivity and turbidity values were all slightly lower at 1.0m depth at the Lower Selwyn Hutts Walkway (Table 8). Similar results were recorded out from Timberyard Road Domain.
4.2.2. NO3-N and PO4
Profile sampling was carried out offshore from the Lower Selwyn Hutts Walkway. Nitrate measurements showed little variation through the profile however phosphates were notably lower at the surface than at depth.
Table 8: NO3-N and PO4 Profile Results
Depth (m)
NO3-N (mg/L)
PO4 (mg/L)
Surface 0.3 0.99
0.5 0.1 1.75
18
Section 5 Discussion
Measuring diurnal variation in Te Waihora/Lake Ellesmere was important as it aides in our understanding how the environment changes over a 12 or 24 hour period. Large extremes in temperature, pH, DO, salinity, turbidity and nutrients can have a detrimental affect on aquatic ecology. This includes the animals, plants, fish, invertebrates and micro-organisms which depend upon the lake for their survival. Salinity, pH, DO and temperature stressors are naturally variable and are directly toxic to biota, however natural biological communities are generally adapted to site specific conditions (ANZECC, 2000). Nutrients and turbidity stressors are not toxic but still have the potential to directly influence eco-systems and biota.
5.1 Diurnal Variations in Key Parameters
Water temperature is an important water quality parameter, influencing the amount of oxygen that can be dissolved in the water (Course Reader, ERST203). Warmer water temperatures can accelerate photosynthesis and in turn lead to eutrophication. For the protection of aquatic eco-systems it is recommended that water temperatures do not increase more than 2oC from their natural temperatures. As indicated in Table 1, there was only one day (02/12/2010) that water temperatures stayed within this variation. The largest water temperature increase was recorded as 6.4oC, posing a potential threat to sensitive aquatic species.
pH measures how acidic or alkaline water is on a scale of 1-14. Animals and plants are adapted to certain ranges and increases or decreases outside of this range can lead to species loss or stress (Course Reader, ERST203). pH naturally varies as a result of photosynthetic activity as well as by the geology and soils within the catchment. pH also increases with increased salinity, for example a typical estuary would have a pH of 8.5 while freshwater would have a typical pH of 6.5-7.5. It is recommended that for the protection of aquatic ecosystems pH does not vary more than 0.5 units outside the natural range for freshwater or 0.2 units for marine waters. Te Waihora/Lake Ellesmere, which is brackish in nature, had a maximum variation of 0.84 units and a minimum of 0.27 units (table 2).
Dissolved oxygen is fundamental to the fish, invertebrates, micro-organisms and plants living in Te Waihora/Lake Ellesmere. It is given out as a by-product of photosynthesis and taken up through respiration. Aquatic plants and algae release DO into the water during the day and where there is excessive vegetation present the water can become super-saturated as is the case at Te Waihora/Lake Ellesmere. For the protection of aquatic eco-systems it is recommended that DO saturation remains above 70% saturated (Course Reader, ERST203).
19
site was within close vicinity of the Selwyn River and this potentially had an impact on the results.
It was expected that pH and DO would peak at the warmest part of the day and return to normal overnight. With the shallow depth of the lake and the lack of riparian vegetation and shade the variation in water quality parameters was expected to be substantial. The latter was found to be true; however the former was proven different with pH and DO values only twice peaking at the warmest part of the day (15/12/2010 and 14/01/2011, both at the Lower Selwyn Huts Walkway (Tables 2 and 3). For pH, DO and water temperature, values generally peaked much later in the day than expected, most commonly between the hours of 6.00-8.00pm.
5.2 Turbidity and Nutrients
The change that occurred during the Wahine Storm of 1968 resulted in Te Waihora/Lake Ellesmere switching from a macrophyte dominated environment to a phytoplankton environment (Jellyman et al., 2009). This regime change is colloquially known as “flipped”. It is common that when “flipping” occurs, as at Te Waihora, that there is a decrease in water
clarity and an increase in turbidity as a result of wind driven resuspension of sediments. Turbidity can reduce light transmission and many types of pollution, such as nitrogen and phosphorous, can attach to the suspended solids (Course Reader, ERST203). The results show that turbidity was highly variable throughout a 24 hour period and that variation was frequently affected by wind; an example of this can be seen on Figure 8. On the 16th of January a very strong southerly change occurred just after 1.00pm. High winds persisted until just after 7.00pm. The graph clearly shows that during the time of very high winds turbidity increased to very high levels.
Nutrient concentrations were only measured reliably on one occasion, but showed overall low, constant NO3-N concentrations, but irregular PO4 concentrations. The latter was also
observed over this period at Wairewa/Lake Forsyth nearby, which experienced sudden sharp peaks in PO4 concentrations (up to 0.8 mg/L; 2011 summer student - Pauline Robinson
pers comm.)
5.3 The Effect of Weather Conditions
20
Domain. At this site aquatic vegetation was not as evident to the naked eye. During this
day air temperatures recorded at the Hart’s Creek weather station reached a maximum of
31.6oC and wind throughout the day was only moderate.
At the other end of the spectrum the days with the smallest variation in water quality parameters occurred on the 7th of December 2010 at Timberyard Road Domain (Figure 3) and the 14th of January 2011 at the Lower Selwyn Huts Walkway. On the 7th of December the morning wind came from a southerly direction changing to north easterly at about 2.00pm. The minimum temperature recorded was at 8.00am as 8.4oC and the maximum at 3.00pm as 20.6oC.
The results indicate that the highest variation in water quality parameters occur on hot days with lower wind speeds. On hot, calm days water temperature showed the greatest increase and pH, DO and conductivity variation was more sizable than days of high winds and overcast conditions. With higher wind speed temperature increased as did pH but not as sizably as on days with little or no wind. During windy conditions conductivity variation was higher but DO variation was less.
5.4 Limitations of Study
Throughout this study there have been errors which have occurred during sampling. These mainly relate to nutrient samples and have resulted in the majority of the nutrient data being omitted from this report. It is also important to mention that the portable probe that was used for sampling was calibrated in the first week of the research. It was later tested in February 2011 and the pH probe was found to be 0.34units off.
21
5.5 Recommendation for Further Study
This study focused solely on diurnal variation at three separate points on the lake from the shore. In the future research could be carried out in which diurnal variation is measured spatially, say at five points in one location, and at different depths. Seasonal changes of diurnal variation would be interesting, as would diurnal variation with the spit open, particularly in relation to conductivity. It would be beneficial to carry out comprehensive invertebrate counts and identification to compliment the sampling results.
Section 6 Conclusion
The studentship which ran throughout the 2010/2011 summer was an opportunity to
measure and document diurnal variation in one of Canterbury’s most important water
22
Reference List
ANZECC & ARMCANZ. (2000). Australian and New Zealand guidelines for fresh and marinewater quality.
Canterbury Regional Council. (1999). Lake Ellesmere, Te Waihora. Christchurch, New Zealand: Canterbury Regional Council.
Hayward, S. & Ward, J. (2009). Water Quality in the Ellesmere Catchment. In: Hughey, K. & Taylor, K. (Eds.), Te Waihora/ Lake Ellesmere: State of the Lake and Future Management (pp.21-31). Christchurch, New Zealand: EOS Ecology.
Hughes, H., McColl, R., & Rawlence, D. (1974). A review of the lake and its catchment. DSIR Information Series 99. Wellington, New Zealand: Sigma Print.
Jellyman, D. & Smith, C. (2009). Native fish and fisheries. In: Hughey, K. & Taylor, K. (Eds.), Te Waihora/ Lake Ellesmere: State of the Lake and Future Management (pp.42-48). Christchurch, New Zealand: EOS Ecology.
Jellyman, D., Walsh, J., Winton, M., & Sutherland, D. (2009). A review of the potential to re-establish macrophyte beds in Te Waihora (Lake Ellesmere). Christchurch, New Zealand: Environment Canterbury.
Sagar, P., Hawes, I., Stephens, S., Jellyman, D., & Kelly, D. (2004). Lake Ellesmere (Te Waihora): a review of water clarity and the potential for macrphyte growth, and the benthic invertebrates, fisheries and birds, and their feeding relationships. Christchurch, New Zealand: Environment Canterbury.
Taylor, K. (1996). The Natural Resources of Lake Ellesmere (Te Waihora) and its Catchment.
Christchurch, New Zealand: Canterbury Regional Council.
Ngai Tahu & DOC (2005) Te Waihora Joint Management Plan, Christchurch, New Zealand.
Wilks, T. (2010). Response of benthic invertebrate fauna to fluctuating lake levels and salinity concentrations in Te Waihora/ Lake Ellesmere. Unpublished Master’s thesis,
Canterbury University, Christchurch, New Zealand.
23
Appendices
Note that all NO3-N and PO4-P concentrations, except those measured at Timberyard Rd
Domain on 12/2/2011 (and possibly at Lower Selwyn Huts on 2/12/2010) are in error. They were measured on unfiltered water samples and the high turbidity of the lake water has interfered in the analysis, causing values to be too high.
A. Lower Selwyn Huts site data
Date 2/12/2010
Time (hr)
Temp (oC) DO (mg/L) DOsat (%) pH Cond
(mS/cm)
Weather Conditions
8 17.6 9.35 100.1 8.06 9.66 Very windy, o/c
9 17.8 9.91 103.6 8.14 9.71
10 18.6 10.88 115.4 8.34 9.65 Wind dropping
11 18.4 11.21 118.5 8.39 9.65
12 18.3 11.51 121.2 8.59 8.66 Warming, cloudy
13 18.2 11.7 123 8.62 8.71
14 18.1 11.69 122.8 8.67 8.67
15 18 12.06 126.6 8.74 8.12 Cooling, rain spots
16 18.7 12 127.6 8.77 8.15 Rain stopped, still
17 18.9 12.1 129.2 8.73 7.57
18 19 12.22 130.7 8.78 7.57 Calm
Time (hr)
NO3-N (mg/L)
PO4 (mg/L) Turbidity
(FAU)
10 0 0.7 88
15.3 0.1 0.67 53
Date 15/12/2010
Time (hr)
Temp(oC) DO (mg/L) DOsat (%) pH Cond
(mS/cm)
Weather Conditions
8 19.4 8.43 91.1 8.32 8.64 Lt rain, warm, still
9 19.4 8.32 89.8 8.4 8.74
10 18.9 9.55 102.2 8.47 8.41 Colder, windier
11 18.8 10.55 112.7 8.58 5.38
12 18.7 10.91 116.2 8.62 4.84 RAIN (heavy)
13 20.2 10.9 119.6 8.61 6.33 Clearing
14 21.2 11.1 124 8.71 4.93 Blue sky, windy
15 21.5 11.06 124.3 8.72 6.33
16 22.2 10.91 124.2 8.68 7.58 Very windy
17 22.1 10.79 122.8 8.69 7.65
18 21.9 10.52 119.5 8.63 8.03 Calmed down
19 21.1 10.83 121.1 8.64 8.3
24 Time
(hr)
NO3-N (mg/L)
PO4 (mg/L) Turbidity
(FAU)
10 1.2 1.75 47
15.3 0 1.13 128
Date 14/01/2011
Time (hr)
Temp (oC) DO (mg/L) DOsat (%) pH Cond(mS/cm) Weather
Conditions
8 16.7 10.71 109.5 8.43 9.56 Overcast, still
9 17.1 11.07 114.1 8.54 9.53
10 18.5 11.32 119.9 8.58 8.04 Wind starting up
11 19.1 10.81 115.7 8.59 9.12
12 19.4 10.59 114.3 8.66 8.95 Sun, WINDY
13 20.9 10.62 118.2 8.62 9.1
14 21.5 11.1 125.3 8.7 9.24 Still windy
15 22.3 10.48 120.1 8.68 9.22
16 22.6 10.18 117.5 8.69 9.18
17 22.4 9.42 108.1 8.65 9.37 Really windy
18 22.2 9.6 109.9 8.66 9.38
19 21.9 9.66 109.8 8.66 9.48
20 19.5 9.36 101.8 8.57 9.42 Windy new direct
Time (hr)
NO3-N (mg/L)
PO4 (mg/L) Turbidity
(FAU)
10 2.9 0.67 62
25 B. Timberyard Road Picnic Area
Date 7/12/2010
Time (hr) Temp (oC) DO (mg/L) DOsat (%) pH Cond (mS/cm) Weather
Conditions
8 16.8 9.39 96.7 8.51 7.73 Overcast
9 17 9.23 95.5 8.61 7.83 light rain, wind
10 16.6 9.88 101.4 8.64 7.81
11 17.6 9.61 100.6 8.71 7.78
12 18.5 9.68 103 8.73 7.39 Sun coming out
13 18.3 9.81 104 8.65 7.58
14 19 9.61 103.3 8.74 8.28
15 18.7 10.84 115.8 8.82 8.47 Wind dying out
16 18.6 10.44 111.4 8.82 8.54
17 18.7 10.97 117.3 8.79 8.49
18 18.3 10.65 112.9 8.77 8.51
19 18.1 10.21 107.8 8.74 8.46
20 17.4 9.84 102.4 8.75 8.45
Time (hr) NO3-N
(mg/L)
PO4 (mg/L) Turbidity
(FAU)
9 0 0.47 68
15.3 0 0.83 56
Date 6/01/2011
Time (hr) Temp (oC) DO (mg/L) DOsat (%) pH Cond (mS/cm) Weather
Conditions
8 18.4 9.51 102.6 8.59 8.59 Rain clearing, ltNE
9 18.8 9.94 107.9 8.68 8.58
10 19 9.67 105.5 8.64 8.49 WINDY
11 18.9 9.57 104.4 8.64 8.53
12 19.5 9.76 107.8 8.62 8 Clearing, windy
13 21.8 9.66 111.5 8.66 7.97
14 21.1 9.28 105.9 8.57 7.5
15 20.7 9.54 108.2 8.61 7.79 No wind, hot sun
16 21.1 10 114.3 8.64 8.45 Wind now S
17 21.1 10.39 118.9 8.72 8.86 Wind moving NE/S
18 21.5 11.37 131.4 8.77 8.94
19 21.5 11.78 136 8.83 8.65
26
Time (hr) NO3-N
(mg/L)
PO4 (mg/L) Turbidity
(FAU)
9 1.1 2.7 121
12 1.56 2.9 150
16 2.33 4.7 220
20 1.3 2.8 131
24 hr sampling
Date 18/12/2010
Time (hr)
Temp (oC) DO (mg/L) DOsat (%) pH Cond
(mS/cm)
Weather Conditions
8 21.1 9.93 113 8.62 7.9 Muggy, overcast
9 20.7 9.5 107.1 8.59 7.71
10 22.1 10.55 122.3 8.61 7.76
11 21.5 11.12 127.1 8.71 7.73 Light breeze
12 22 12.88 148.9 8.83 7.69 Cloud breaking up
13 22.1 13.06 151 8.84 7.69
14 24.7 13.57 164.7 8.86 7.72
15 25.1 13.75 168.3 8.91 7.63
16 24.1 13.71 164.5 8.89 7.74 HOT
17 25.8 14.79 183.1 8.97 7.58
18 26.4 15.82 198.2 9.08 7.72 Still hot
19 26.1 14.54 181.4 9.05 7.71
20 25.8 15.5 192.3 9.21 7.8 Cloudy, muggy
21 24.5 11.87 143.5 9.06 7.79
22 23 11.86 139.6 9.12 7.87 Sunset, windy
23 21.1 10.77 122.1 8.98 7.76
24 21.2 9.81 111.4 8.75 7.75
1 20.9 8.94 111.1 8.68 7.73
2 20.8 8.92 100.5 8.65 7.8 Light rain
3 20.5 7.76 87.1 8.52 7.95
4 20.6 7.72 86.8 8.51 7.99
5 20.3 6.95 77.6 8.38 8.04 Sun rise
6 20.1 7.00 77.9 8.41 8.09
7 20 7.04 78.2 8.39 8.16
27 Time
(hr)
NO3-N (mg/L)
PO4 (mg/L) Turbidity
(FAU)
9 0.6 2.2 119
11 2.7 0.89 100
13 2.3 2.22 100
15 1.8 0.93 120
17 2.3 0.95 104
19 2.6 1.29 153 Boat nearby
21 1.7 1.15 90
23 2.7 1.27 110
1 1.9 1.04 97
3 1.7 1.19 80
5 1.4 1.18 104
7 1.7 1.69 104
Date Time (hr)
Temp (oC) DO (mg/L) DOsat (%) pH Cond
(mS/cm)
Weather Conditions
8 21.1 7.14 81.9 8.7 8.51 Windy
9 20.2 6.84 77.2 8.96 8.59
10 19.6 5.94 66.2 8.92 8.56 Calm, warm, NW
11 20.3 6.06 68.5 8.97 8.54
12 22.2 7.59 89.1 8.96 8.57
13 22.3 7.42 87.1 9.04 8.44 Still, warm
14 22.6 7.82 92.2 9.07 8.56 Rapid change to S
15 21.7 9.97 115.1 8.96 8.43
16 22.5 10.09 117.8 8.7 8.52
17 22.3 9.55 111.1 8.64 8.97
18 21.6 9.91 114 8.63 9.23 Wind same
19 21.2 9.7 110.3 8.62 9.41
20 20 10.39 115.6 8.67 9.36 Calmed down
21 19.7 9.96 110.2 8.63 9.34
22 19 9.75 106.2 8.58 9.25
23 18.8 9.06 98.1 8.56 8.92 Dark
24 18.5 8.88 95.7 8.31 8.81 Very still
1 18.8 9.06 98.6 8.48 9.04
2 19 8.98 97.7 8.49 8.98
3 19 9.02 98.2 8.54 8.31 Light drizzle
4 19.1 9.01 98.3 8.55 8.9 RAIN
5 18.9 8.84 95.2 8.43 8.86
6 18.2 8.77 94 8.37 8.86
7 18 9.29 99.1 8.41 8.86 Rain cleared
28 Time
(hr)
NO3-N (mg/L)
PO4 (mg/L) Turbidity
(FAU)
9 2.8 1.17 138
11 2.8 1.14 116
13 2.5 1.01 107
15 2.4 2.25 205
17 5.5 2.41 286
19 4.3 2.75 239
21 3.4 1.94 181
23 2.6 2.02 158
1 3.8 2.84 170
3 2.7 1.43 184
5 2.4 1.6 179
7 3.7 1.79 173
Date 12/02/11
Time (hr)
Temp (oC) DO (mg/L) DOsat (%) pH Cond
(mS/cm)
Weather Conditions
8 18.2 6.34 67.5 8.75 9.19 Overcast
9 18.4 6.58 70.5 8.72 9.2 Warm
10 18.5 5.94 63.6 8.74 9.13 Wind stirring
11 19.8 7.72 85.1 8.93 9.12
12 19.7 6.15 67.7 8.96 9.24
13 20.3 6.65 74.2 9.39 9.21 Warm
14 22.7 8.93 104.2 9.34 9.2
15 23.8 8.9 106 9.33 9.28 Hot, windy
16 22.8 7.9 92.5 9.36 9.28
17 23.5 10.31 122.3 9.40 9.29
18 22.9 10.89 127.5 9.35 9.46
19 22.3 10.01 116.2 9.42 9.32 Wind died, warm
20 22 9.93 114.5 9.4 9.32
21 21.5 9.07 103.6 9.4 9.32 Light rain
22 21.1 8.05 91.2 9.26 9.23
23 20.8 7.22 81.2 9.19 9.33 Stopped raining
24 20.4 6.77 75.6 9.14 9.33
1 20.2 6.01 66.8 9.11 9.31 RAIN
2 20.2 6.2 68.9 9.05 9.28 Stopped raining
3 19.7 5.88 64.7 8.91 9.16 Started again
4 19.9 5.72 63.2 9.02 9.22
5 19.8 5.87 64.5 9.05 9.24 Heavy rain
6 19.3 5.62 61.1 8.83 9.23
7 19.1 5.64 61.2 8.8 9.2 Stopped raining
29 Time
(hr)
NO3-N (mg/L)
PO4 (mg/L) Turbidity
(FAU)
9 0.3 0.28 210
11 0.6 1.71 166
13 0.3 1.04 165
15 0 0.73 178
17 0 0.24 153
19 0 0.39 150
21 0.2 0 156
23 0 0.91 158
1 0 0.24 159
3 0 0.56 157
5 0 0.31 149
7 0.4 0.41 190
C. Kaituna Lagoon
Date 23/01/11
Time (hr) Temp (oC) DO (mg/L) DOsat (%) pH Cond
(mS/cm)
Weather Conditions
8 15.5 10.9 109.8 8.72 10.15 RAIN
9 15.8 10.18 103 8.74 10.14 Rain cleared
10 17.9 10.82 114.1 8.86 10.13 Sunny & calm
11 18.8 12.55 135.1 8.98 10.14
12 19.1 13.27 143.8 9.09 10.15 Still, warm, o/c
13 18.1 15.99 170.3 9.16 10.18 Rain starting
14 18.2 16.13 172.2 9.23 10.1 Wind, no rain
15 18.2 16.53 176.5 9.28 10.16 Wind change
16 18.1 16.49 175.8 9.33 10.11 O/c, light wind
17 18.5 18.47 198.4 9.37 10.12
18 18.8 20.27 219.4 9.49 10.07 Slight wind, o/c
19 18.3 16.68 178.9 9.47 10.08
20 18.2 14.89 159.4 9.5 10.06
Time (hr) NO3-N
(mg/L)
PO4 (mg/L) Turbidity (FAU)
10 1.8 0.74 53
30
Date 01/02/11
Time (hr) Temp (oC) DO (mg/L) DOsat (%) pH Cond(mS/c
m)
Weather Conditions
8 16.5 7.26 76.1 9.24 10.85 Warm, still, sunny
9 16.9 8.36 86.2 9.32 10.8
10 17.1 9.05 94.3 9.37 10.88 Slight breeze
11 18.4 10.76 115.3 9.46 10.87 lt wind, warm, sun
12 20.4 13.87 154.3 9.59 10.83
13 21.2 16.55 187.4 9.69 10.77 Wind Increasing
14 21.2 15.88 181 9.76 10.82 Wind stronger
15 22.6 16.28 190.7 9.69 10.96
16 23.4 17.85 212.9 9.74 10.94 Wind dying, warm
17 23.1 17.86 212.2 9.90 10.93 Calm, slt rain
18 22.1 17.39 202.7 10 10.96 Wind change
19 21.8 18.08 209 10.08 10.95
20 21.2 17.24 197.1 10.06 11
Time (hr) NO3-N
(mg/L)
PO4 (mg/L) Turbidity (FAU)
10 0.9 1.78 15
Waterways Centre for Freshwater Management University of Canterbury & Lincoln University Private Bag 4800
Christchurch New Zealand
Phone +64 3 364 2330 Fax: +64 3 364 2365