Utilization of Pediatric Hospitals in New York State
Robert K. Kanter, MD*, and Matthew Egan, BA‡
ABSTRACT. Background. Little published informa-tion is available regarding the proporinforma-tion of hospitals that offer pediatric services at specified levels, or the actual utilization of such services.
Objective. To determine if an existing national ac-creditation process created for educational purposes identifies hospitals with a distinct utilization pattern, in a sample of pediatric inpatient activity from one state.
Methods. Hospitals in New York State were classified as “pediatric” hospitals according to their sponsorship or major participation with an accredited pediatric resi-dence program. Institutions not affiliated with pediatric residencies were considered to be the “other” hospitals. Data on hospital discharges and interhospital transfers were studied for children from 0 to 14 years old, exclud-ing neonatal Diagnosis-Related Groups. Data were ob-tained from the New York Statewide Planning and Re-search Cooperative System for 1996, 1997, and 2000.
Results. Sixteen percent of hospitals were considered to be “pediatric” facilities (42 of 257) by study criteria. Annual pediatric inpatient activity per “pediatric” hos-pital significantly exceeded that in “other” institutions, including hospitalizations (2249 ⴞ 1284 vs 258 ⴞ 348), number of interhospital transfers received (153ⴞ 88 vs 18ⴞ26), and number of hospitals referring interhospital transfers to each receiving hospital (36 ⴞ 17 vs 5ⴞ 7; meanⴞstandard deviation; for each comparison). State-wide, “pediatric” hospitals served two thirds of all hos-pitalized children and 70% of all children’s hospital days. “Pediatric” hospitals cared for 26.5 patients per hospital day, compared with only 2.2 per day at “other” institu-tions. Although statewide hospitalizations of children fell by 14.3% the proportion of all pediatric hospitaliza-tions served by “pediatric” hospitals increased by 3.8% from 1996 to 2000.
Conclusions. Although intended for educational pur-poses, hospital affiliation with an accredited pediatric residency program identifies a subgroup of facilities with a distinct utilization pattern, which provides care for the majority of pediatric inpatients, and serves as a resource to other hospitals.Pediatrics 2003;111:1068 –1071;
access, accreditation, designation, network, regionalization.
ABBREVIATION. SD, standrd deviation.
O
ptimal care of severely ill or injured children requires appropriate organization of hospital resources. Emergency services must be widely distributed to provide timely care for urgent local needs. Care of the most complex problems is best handled by interdisciplinary teams at compre-hensive regional pediatric hospitals. These should have a more restricted distribution to achieve the clinical volume necessary to maintain proficiency and to avoid costly redundancy. Recently, organiza-tional principles have been outlined for a regional system of pediatric acute care services.1An effective organizational framework would include categoriza-tion, identifying the capabilities and services that should be provided by facilities at specified levels. Based on such categories, facilities would be accred-ited, indicating approval from a certifying group that a facility’s intention to provide a specified level of care is justified by available resources. Finally, desig-nation (usually by a governmental agency) would implement categorization and accreditation, by di-recting patients to appropriate institutions, accord-ing to facility capabilities.Appropriate capabilities for many categories of pediatric acute care services have been addressed in the recommendations of national professional orga-nizations.2–9 Hospitals serve as a central element in the acute care system. However, little published in-formation is available regarding the proportion of hospitals that offer pediatric services at specified levels, or the actual utilization of such services. Al-though federal efforts to improve disaster prepared-ness are in progress, there are few nationwide exam-ples of accreditation or designation of pediatric acute care services, so pediatric hospitals are difficult to identify.
One existing national accreditation process per-tains to pediatric hospital services. Hospitals can be identified that sponsor or have a major participation with an accredited pediatric residency program.10 Pediatric residencies are accredited according to uni-form national standards by the Accreditation Coun-cil for Graduate Medical Education.11 Programs are evaluated according to many criteria, only some in-volving acute care. Although individual hospital ser-vices are not scrutinized in sufficient detail to eval-uate specific acute care capabilities, accredited programs are required to provide a range of pediat-ric hospital medical and surgical services, at a vol-ume sufficient to provide residents with an adequate educational experience. Thus, hospital affiliation with an accredited pediatric residency might serve as a convenient national marker for hospitals that tend From the *Department of Pediatrics, ‡College of Medicine, Upstate Medical
University, State University of New York, Syracuse, New York. Received for publication Jan 22, 2002; accepted Oct 14, 2002.
Address correspondence to Robert K. Kanter, MD, Department of Pediat-rics, Upstate Medical University, State University of New York, 750 E Adams St, Syracuse, NY 13210. E-mail: kanterr@upstate.edu
to provide pediatric care in a way that is distinguish-able from other hospitals, even without local desig-nation or regulation.
This cross-sectional study was performed to inves-tigate the relationship between hospital affiliation with an accredited pediatric residency program, and actual utilization of these hospital resources, in ob-servations of 1 state. Lacking published information on the impact of national efforts to provide compre-hensive pediatric care, such data might provide a perspective for future investigation and improve-ment of the acute care system. Our observations indicate that an existing national accreditation pro-cess is associated with distinct hospital utilization patterns.
METHODS Design and Data
For purposes of the study, those hospitals sponsoring, or hav-ing a major participation with an accredited pediatric residency program, were referred to as “pediatric” hospitals.10 Hospitals without such status were considered the “others”. Pediatric inpa-tient activity per hospital in New York State was measured as the number of hospitalized children, the number of children admitted as interhospital transfers to each receiving hospital, and the num-ber of hospitals referring interhospital transfers to each receiving hospital. Activity per “pediatric” hospital was compared with per hospital activity at the “others”. Annual activity for individual hospitals was analyzed for 1997. In addition, total annual New York statewide pediatric inpatient activity was described as the number of hospitalized patients and hospital days at “pediatric” and “other” hospitals for the most currently available data and 4-year trend (1996 and 2000). The utilization patterns identified in this study reflect choices made, or barriers faced, by providers, families, and payers. No state regulatory process requires or re-stricts admission of a child to any hospital.
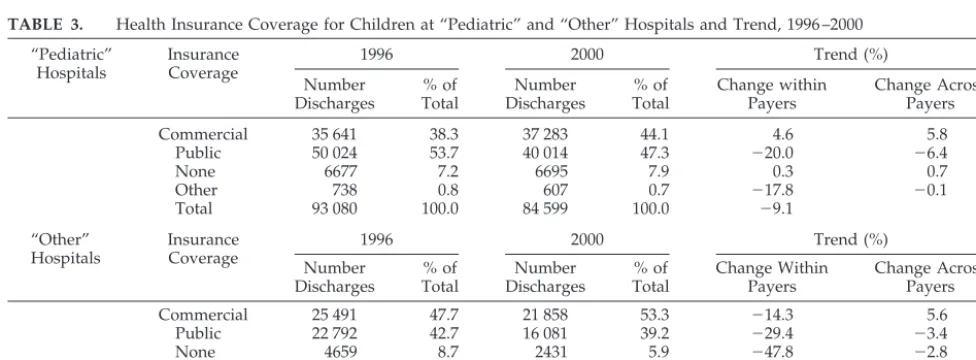
Because health insurance coverage may influence access to certain health care services, health insurance coverage for inpa-tients at “pediatric” and “other” hospitals was described for 2000, along with the 4-year trend. Health insurance coverage was clas-sified as commercial (including commercial insurance companies, health maintenance organizations, self-insured, worker’s compen-sation, and no fault), public (predominantly Medicaid, as well as Medicare and other governmental), none, or other (no charge, or “other”).
Pediatric hospital inpatient data were analyzed for children ages 0 to 14 years, excluding neonatal Diagnosis-Related Groups (385–391). The age range was selected because most evidence supporting the benefit of pediatric-specific care involves younger age groups.12,13Neonatal care was excluded from analysis because separate facilities usually are provided for such care. Data on hospital discharges, length of stay, and insurance coverage were obtained from the New York Statewide Planning and Research Cooperative System.14The data, collected for administrative pur-poses, are publicly available, with no individual patient identifi-ers.
Interhospital transfers were identified as those patients with multiple admissions, having an inpatient discharge and subse-quent readmission to a different hospital on the same or next day. These data do not include transfers from emergency departments at 1 hospital to inpatient care at another hospital. Random iden-tification numbers were provided by Statewide Planning and Re-search Cooperative System as a substitute for the patients’ real identification numbers, allowing the recognition of sequential dis-charge and readmission of transferred patients, without compro-mising anonymity.
Analysis
Hospitals were considered to be the units of analysis. Potential differences in pediatric inpatient activity between “pediatric” and “other” hospitals were analyzed by unpairedttest. Differences were considered to be statistically significant if P ⬍ .05. Total statewide activity was summarized as patient numbers and
hos-pital days. Percent change in activity from 1996 –2000 was ex-pressed within and between groups of hospitals or within and between types of insurance coverage.
RESULTS
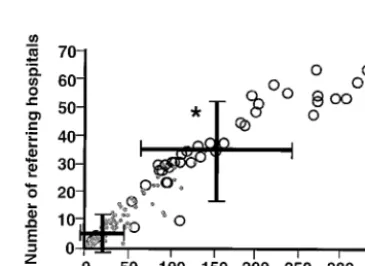
“Pediatric” hospitals accounted for 16% (42 of 257) of institutions in New York State. Annual pediatric inpatient activity per “pediatric” hospital signifi-cantly exceeded that in “other” institutions, includ-ing hospitalizations (2249 ⫾ 1284 vs 258 ⫾ 348), interhospital transfers received (153⫾88 vs 18⫾26), and the number of hospitals referring interhospital transfers to each receiving hospital (36⫾17 vs 5⫾7), respectively (P ⬍ .05; mean ⫾ standard deviation [SD]; for each comparison; Figs 1 and 2). “Pediatric” hospitals account for over 90% of institutions in the Fig 1. Annual number of pediatric hospitalizations per “pediat-ric” hospital (E) and per “other” hospital (F) (*P⬍.05; mean⫾
SD).
Fig 2. Interhospital transfers, expressed as the number of patients transferred to each receiving hospital annually (horizontal axis), and the number of hospitals referring transfers to each receiving hospital annually (vertical axis), per “pediatric” hospital (E) and
per “other” hospital (F) (*P⬍.05 for both comparisons; mean⫾
SD).
ARTICLES 1069
at Viet Nam:AAP Sponsored on August 30, 2020
www.aappublications.org/news
top tenth percentile for activity by each of these measures.
Statewide, “pediatric” hospitals provided care for two thirds of hospitalized children, and for 70% of all pediatric hospital days (Tables 1 and 2). These hos-pitals cared for an average of 26.5 pediatric patients per day compared with 2.2 per day at “other” insti-tutions. Total pediatric hospitalizations at all hospi-tals decreased by 14% and hospital days fell by 17% from 1996 to 2000. Because greater reductions oc-curred proportionately at “other” hospitals, “pediat-ric” facilities provided an increasing proportion of inpatient care of children (Tables 1 and 2).
The largest single payer for pediatric hospital care statewide was Medicaid, with 45% of hospitaliza-tions and 52% of hospital days covered by public insurance. During 1996 through 2000, the proportion of hospitalized children with commercial insurance rose by⬃5%, balanced by a similar reduction in the number having public insurance coverage. At “pedi-atric” hospitals, 47% of hospitalized children were covered by public health insurance, while 8% lacked insurance. Publicly funded and uninsured propor-tions were slightly lower at “other” hospitals (Table 3).
DISCUSSION
Although accreditation of pediatric residency pro-grams is intended for educational, not service-related purposes, the present study indicates that in 1 state, affiliation with an accredited residency identifies a subgroup of hospitals with a distinct utilization pat-tern. The majority of pediatric hospital care is con-ducted at hospitals easily identifiable by their spon-sorship or major participation with accredited pediatric residency programs. Although no attempt could be made in the present study to evaluate qual-ity of hospital care, higher clinical volume is often associated with better outcomes.12,13,15Thus, the “pe-diatric” hospitals tend to have the clinical volume that might promote high clinical quality. In contrast, some of the “other” hospitals have such low volumes of pediatric activity it might be difficult to provide high quality care for infants and children.
Expressing utilization as the number of hospital-ized children and their hospital days provides a gen-eral measure of pediatric clinical activity. Numbers of interhospital transfers, and numbers of hospitals referring transfers to each receiving hospital, provide TABLE 1. Number of Discharges of Children at “Pediatric” and “Other” Hospitals and Trend,
1996 –2000
Hospital Group
1996 2000 Trend (%)
Number Discharges % of Total Number Discharges % of Total Change Within Group Change Across Groups
“Pediatric” 93 080 63.5 84 599 67.4 ⫺9.1 3.8
“Other” 53 418 36.5 40 989 32.6 ⫺23.3 ⫺3.8
Total 146 498 100 125 588 100 ⫺14.3
TABLE 2. Number of Hospital Days for Children at “Pediatric” and “Other” Hospitals and Trend, 1996 –2000
Hospital Group
1996 2000 Trend (%)
Number Days % of Total Number Days % of Total Change Within Group Change Across Groups
“Pediatric” 473 926 67.8 406 149 70.2 ⫺14.3 2.4
“Other” 225 239 32.2 172 213 29.8 ⫺23.5 ⫺2.4
Total 699 165 100 578 362 100 ⫺17.3
TABLE 3. Health Insurance Coverage for Children at “Pediatric” and “Other” Hospitals and Trend, 1996 –2000
“Pediatric” Hospitals
Insurance Coverage
1996 2000 Trend (%)
Number Discharges % of Total Number Discharges % of Total Change within Payers Change Across Payers
Commercial 35 641 38.3 37 283 44.1 4.6 5.8
Public 50 024 53.7 40 014 47.3 ⫺20.0 ⫺6.4
None 6677 7.2 6695 7.9 0.3 0.7
Other 738 0.8 607 0.7 ⫺17.8 ⫺0.1
Total 93 080 100.0 84 599 100.0 ⫺9.1
“Other” Hospitals
Insurance Coverage
1996 2000 Trend (%)
Number Discharges % of Total Number Discharges % of Total Change Within Payers Change Across Payers
Commercial 25 491 47.7 21 858 53.3 ⫺14.3 5.6
Public 22 792 42.7 16 081 39.2 ⫺29.4 ⫺3.4
None 4659 8.7 2431 5.9 ⫺47.8 ⫺2.8
Other 476 0.9 619 1.5 30.0 0.6
a measure of each hospital’s role as a resource to other institutions in a regional system. If transfers are considered to represent interactions between nodes in a network, then institutions with a high number of such interactions can be considered to have a high degree of importance or “centrality” in that system.16 Most hospitalized children have health insurance coverage. Although the lack of health insurance may interfere with access to discretionary health care,17it is less likely that mandatory care for acute illness is dependent on insurance coverage. With public insur-ance supporting a substantial portion of the costs of pediatric hospital activity, the public has a financial interest in the efficiency, as well as the quality and accessibility of services. For example, achieving an optimal distribution of the most expensive compre-hensive services might ensure their accessibility, while avoiding costly redundancy, driven by com-petitive interests.18,19Because of their dependence on public funding, “pediatric” hospitals have a financial interest in public understanding of their services. This might include an interest in identifying them-selves more clearly.
CONCLUSIONS
A system is best understood in terms of its orga-nization, in addition to the behavior of its compo-nents in isolation, whether the system is an organ-ism20 or a system of hospital resources in a region. Before experiments can be designed to investigate how a system works, a preliminary description of the system is necessary to formulate testable hypotheses. The present observations describe utilization of the existing hospital system that serves children in 1 state. “Pediatric” hospitals are defined in a way that is generalizable, based on uniform national stan-dards. “Pediatric” hospitals identified in this way care for the majority of hospitalized children, serve as a resource to other hospitals in a region, and this activity is substantially funded by public health in-surance coverage.
REFERENCES
1. American Academy of Pediatrics, Committee on Pediatric Emergency Medicine; American College of Critical Care Medicine, Society of Crit-ical Care Medicine, Pediatric Section. Consensus report for
regionaliza-tion of services for critically ill or injured children.Pediatrics.2000;105: 152–155
2. American Academy of Pediatrics, Committee on Pediatric Emergency Medicine. Guidelines for pediatric emergency care facilities.Pediatrics. 1995;96:526 –537
3. American Academy of Pediatrics, Committee on Hospital Care, Pedi-atric Section of the Society of Critical Care Medicine. Guidelines and levels of care for pediatric intensive care units. Pediatrics. 1993;92: 166 –175
4. American College of Surgeons, Committee on Trauma.Resources for Optimal Care of the Injured Patient: 1998. Chicago, IL: American College of Surgeons; 1998
5. American Academy of Pediatrics, Task Force on Interhospital Trans-port.Guidelines for Air and Ground Transport of Neonatal and Pediatric Patients. Elk Grove Village, IL: American Academy of Pediatrics.1993 6. American Academy of Pediatrics, Section on Cardiology and Cardiac
Surgery. Guidelines for pediatric cardiovascular centers. Pediatrics. 2002;109:544 –549
7. Emergency Medical Services for Children, Task Force on Children with Special Health Care Needs. EMS for children: recommendations for coordinating care for children with special health care needs.Ann Emerg Med.1997;30:274 –280
8. American Academy of Pediatrics, Committee on Hospital Care. Facili-ties and equipment for the care of pediatric patients in a community hospital.Pediatrics.1998;101:1089 –1090
9. American Academy of Pediatrics, Committee on Hospital Care. Staffing patterns for patient care and support personnel in a general pediatric unit.Pediatrics.1994;93:850 – 854
10. American Medical Association.Graduate Medical Education Directory, 1996 –1997, and 1999 –2000.Chicago, IL: American Medical Association 11. Accreditation Council for Graduate Medical Education.Program Re-quirements for Residency Education in Pediatrics.Chicago, IL: Accredita-tion Council for Graduate Medical EducaAccredita-tion; 2001. Available at: www. acgme.org
12. Hannan EL, Racz M, Kavey RE, et al. Pediatric cardiac surgery: the effect of hospital and surgeon volume on in-hospital mortality. Pediat-rics.1998;101:963–969
13. Tilford JM, Simpson PM, Green JW, et al. Volume outcome relationship in pediatric intensive care units.Pediatrics.2000;106:289 –292 14. New York State Department of Health. New York Statewide Planning
and Research Cooperative System (SPARCS). Albany, NY: 1996, 1997, and 2001
15. Birkmeyer JD, Siewers AE, Finlayson EVA, et al. Hospital volume and surgical mortality in the United States. N Engl J Med. 2002;346: 1128 –1137
16. Scott J.Social Network Analysis.Thousand Oaks, CA: Sage Publications, Inc; 2000
17. Berk ML, Schur CL. Measuring access to care: improving information for policymakers.Health Affairs.1998;17:180 –186
18. Richardson DK, Reed K, Cutler C, et al. Perinatal regionalization versus hospital competition: the Hartford example.Pediatrics.1995;96:417– 423 19. Goodman DC, Fisher ES, Little GA, et al. The relation between the availability of neonatal care and neonatal mortality.N Engl J Med. 2002;346:1538 –1544
20. Chong L, Ray LB. Whole-istic biology.Science.2002;295:1661
ARTICLES 1071
at Viet Nam:AAP Sponsored on August 30, 2020
www.aappublications.org/news
DOI: 10.1542/peds.111.5.1068
2003;111;1068
Pediatrics
Robert K. Kanter and Matthew Egan
Utilization of Pediatric Hospitals in New York State
Services
Updated Information &
http://pediatrics.aappublications.org/content/111/5/1068 including high resolution figures, can be found at:
References
http://pediatrics.aappublications.org/content/111/5/1068#BIBL This article cites 14 articles, 10 of which you can access for free at:
Subspecialty Collections
http://www.aappublications.org/cgi/collection/hospital_medicine_sub Hospital Medicine
vices_sub
http://www.aappublications.org/cgi/collection/community_health_ser Community Health Services
_sub
http://www.aappublications.org/cgi/collection/community_pediatrics Community Pediatrics
following collection(s):
This article, along with others on similar topics, appears in the
Permissions & Licensing
http://www.aappublications.org/site/misc/Permissions.xhtml in its entirety can be found online at:
Information about reproducing this article in parts (figures, tables) or
Reprints
DOI: 10.1542/peds.111.5.1068
2003;111;1068
Pediatrics
Robert K. Kanter and Matthew Egan
Utilization of Pediatric Hospitals in New York State
http://pediatrics.aappublications.org/content/111/5/1068
located on the World Wide Web at:
The online version of this article, along with updated information and services, is
by the American Academy of Pediatrics. All rights reserved. Print ISSN: 1073-0397.
the American Academy of Pediatrics, 345 Park Avenue, Itasca, Illinois, 60143. Copyright © 2003 has been published continuously since 1948. Pediatrics is owned, published, and trademarked by Pediatrics is the official journal of the American Academy of Pediatrics. A monthly publication, it
at Viet Nam:AAP Sponsored on August 30, 2020
www.aappublications.org/news