Abstract— To reduce the potable water consumption in single-family homes and to ensure quality water to meet the growing demand for water resources, studied the grey water reuse from the lavatory, shower and washing machine for non-potable use in toilets and floor washing. Therefore, it was sought to analyze the technical and economic viability for the implementation of a low-cost treatment reuse system that aims to serve low-income families. For this purpose, the consumption was collected in a standard single-family residence and estimated in each sanitary appliance analyzed. Aiming to meet the current legislations about the quality water a comparison was made between treatment earthworm humus and wetlands, aiming to obtain the best solution that meet the technical, economic and environmental factors. To analyze the water quality parameters did the quality analyze of gray and treat water to compare the samples and check if the minimums parameters were attended to. The biological filter system presented reductions in the analyzed parameters, but It didn’t reach the minimum established in the current norms. While the Wetland system presented more satisfactory results when compared to the biological filter. The two analyzed systems presented economic viability, being that the biological filter was the most economically feasible.
Index Term— Alternative methods, Low cost treatments, Reduction of consumption.
I. INTRODUCTION
THE water is essential for life, but it is a limited and indispensable input to man’s activities. The drinking water volume available is becoming increasingly scarce due to population growth and global climate change, which has contributed to the increase in demand for water resource. Although the water on the planet is a renewable resource, it tends to deteriorate due to its indiscriminate use, compromising the water quantity with quality available for consumption in the various localities around the world (BRAGA, 2016).
According Bloch (2002) 97% of all the earth's water is in the oceans and 0.62% corresponds to fresh water. Of this percentage, approximately, half corresponds to groundwater. That is, only 1% of all fresh water is available for consumption, all around the world.
It is known that the fresh water is used to perform various human activities, among which we can highlight domestic,
industrial, irrigation, power generation and navigation use. According to the National Water Agency, Ana (2005), the greater demand for water is for irrigation, corresponding to 69% of the use, followed by urban use and animal consumption, with 11%, following the industrial use, representing 7% and 2% representing rural supply.
The domestic use accounts for only 8% of water consumption in Brazil. For Pereira (2004) 75% of the waters used for domestic purposes in Brazil return to the water bodies as a form of sewage, without due effluent treatment. The distribution of water consumption in residences occurs in the use of sanitary discharge, representing 30.9%, kitchen sink of 30%, and bath of 26.7% (YOSHIMOTO, SILVA, 2001 apud TSUTIYA, 2006).
In Brazil, in medium-sized residences, the consumption reaches 200 liters per habitant per day, being able to raise up to 400 liters in districts of higher economic level and to reduce to 120 liters per habitant per day in cities of smaller size. The consumption in the medium size residences bathrooms represents 70 to 82% of the total consumption (OLIVEIRA, 2004).
Water scarcity is aggravated in the world by social inequality, sustainable management lack and inappropriate use of the natural resources. In this panorama, we have tried to raise the population awareness about these problems and for that reason much is discussed about the reuse water (HESPANHOL; MIERZWA, 2000). In this scenario, programs for the evaluation, control and reduction of continuous and effective losses are fundamental. Water conservation is very important to preserve water resources and ensure quality water for future generations.
It is noticed the urgency implementing actions for water conservation and reduction of consumption, with the purpose of contributing to the sustainability of water resources (REBÊLO, 2011). Thus, the use of gray water becomes increasingly important for increasing water demand and reducing pollution, by reducing the amount of waste thrown into the environment. The buildings must be equipped with mechanisms that can contribute to minimizing impacts to the environment, from their construction to their final use, such as the use of alternative sources of energy and water for non-potable purposes.
The gray water reuse is not a new concept. It has been
Technical and Economic Viability for Low-Cost
Graywater Treatments: Comparison Between
Worm Humus Filter and Wetland
BRAGA
a,
R. G., JÚNIOR
b, L.U.R.
a: Teaching and Research Institution of Itajubá (FEPI), 687, Doctor Antônio Braga Filho Street, Itajubá, Minas Gerais, e-mail: [email protected]
practiced all over the world for many years. Its practice comes from Ancient Greece, with the sewage disposal and the use for irrigation. The gray water becomes an alternative source for non-potable uses and has been applied in some countries such as the United States, Japan, Canada, Germany, United Kingdom and Israel (COUTO, et al., 2014).
According to Mancuso and Santos (2003), the gray water reuse has been increasingly consolidated as an instrument of immense importance for the preservation and conservation of natural resources. In Brazil, there are already some applications of this system for non-potable consumption, but it is a new concept (BRANCATELLI, 2007).
Water reuse has been largely used in industries, especially in cooling towers, boilers, construction, green areas irrigation and in some industrial processes where the use of water with lower quality standard does not cause major problems (GONÇALVES et al., 2006).
It is not a question of thinking in the short term, but rather in the medium term when, probably like what is happening, there may be a quality drinking water lack. In this sense, gray water the reuse, which is the water from all domestic activities except for black water sources such as toilets, bidets and urinal, has been studied (OTTERPOHL, 2001).
Gray waters are classified into two categories. The clear gray water that is wastewater from the shower, wash basin and washing machine and the dark gray water that comes from kitchen sinks and dishwashers (HENZE; LEDIN, 2001).
The gray water reuse is directly related to the quality of the effluent, the treatment to be used and the final application. Water quality can vary according to location, occupation level, age group, culture, water quality and costumes. It is worth emphasizing that the implementation of reuse practices in a negligent way brings innumerable risks to health and the environment, which may jeopardize the credibility and feasibility of its implementation.
According to NBR 13.969 (1997), the effluents can be classified in different classes. Effluents are classified in class 1, 2, 3 and 4 with their respective physical, chemical and bacteriological parameters of sewage quality. The effluent for reuse in discharges of sanitary basins is classified as class 3 and for washing floors and sidewalks is classified in class 2.
The water classes for reuse must follow the water quality criteria according to the activities and uses of the water for reuse. The components present in the water vary according to the selected source and, due to this factor, it becomes possible to segregate the effluent from a set of sanitary appliances, defining the water characteristics to be reused (SINDUSCON, 2005).
Aiming to make possible the gray water reuse for a single-family residence of low income, the reuse of the waters captured at the point of consumption was applied and it was applied in the sanitary discharges of the bathrooms.
For the implementation to the reuse system, it was necessary to analyze the effluent quality and the technical aspects associated to the system, verifying the parameters and feasibility of the project. To reach the parameters established by Sinduscon (2005), as well as those indicated in NBR 13969
(ABNT, 1997), low cost treatments were applied to enable reuse. For this, a technical comparison was made between the biological filter treatment, composed of earthworm humus and sawdust with the wetlands, composed of aquatic plants of the region.
The objective is to evaluate the technical and financial aspects associated to the gray water reuse, emphasizing the rational use of water and the reduction of consumption in a single-family residence. The aim is evaluating innovative and low-cost treatments to achieve the required quality of water for reuse.
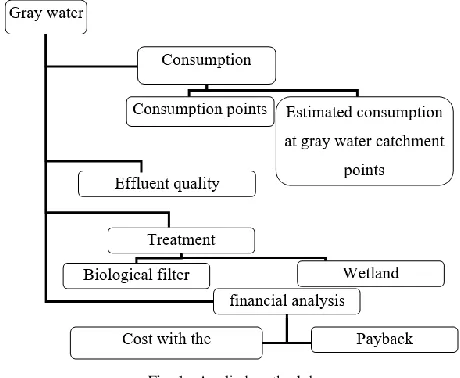
Fig. 1. Applied methodology
II. METHODOLOGY
For the gray water reuse, water balance studies were carried out, identifying the main points of consumption, sanitary parts and consumption estimation for the analyzed site to obtain the point of greatest consumption in the residence. After identifying the main points of consumption, it became necessary to carry out an analysis to the quality water to be reused. For this, a sample of the effluent was collected to evaluate the main quality parameters required according to Sinduscon (2005), as well as the parameters established by NBR 13.969 (1997).
To guarantee quality water to meet low-income populations and to enable the reuse implementation in residences, a treatment system with biological filter and wetlands was used.
The treatments methods applied consist in a pre-filter and activated carbon filter for both methods. The biological filter is carried by earthworm humus and sawdust, while the Wetland has aquatic plants and gravel and sand substrates. Figure 1 illustrates the applied methodology.
Consumption estimate
use in sanitary discharges and for the cleaning of the house. The Consumption occurred with a percentage of drinking water use for the sanitary basin as 34%, shower with 31% and washing machine with a percentage of 5%, already for the lavatory consumption this represents 6% of the consumption residence, based on USP (1999) and OLIVEIRA (2004) data.
After obtaining the monthly residence consumption and through a cadastral survey, the users number or agents consuming, the Consumer Indicator (CI) was calculated, where it is determined, according to OLIVEIRA (1999). Equation 1 is used to correct possible differences obtained in the estimation of consumption.
𝐼𝐶 =𝐶𝑚 𝑥 1000𝑁𝑎 𝑥 𝐷𝑚 (1)
Being that:
IC- Consumption indicator (L / agent / Consumer * day); Cm- Monthly Consumption (m³ / month);
Na- Consuming agents number; Dm- working days number per month.
Pipes sizing
The waters collected at consumption points were collected through an independent collector and directed to a treatment system and later to the reservation system.
The gray water collection occurred at the consumption points of the wash basin, shower and washing machine. All the effluent was conducted into the treatment system. The first tank is the decanter. Then the effluent is sent to the pre-filter, where it is intended to filter and remove the suspended solids. After the effluent passed the proposed treatment with biological filter and wetlands to later follow the activated carbon filter. The effluent already treated goes to the treated water reservoir and is stored there for use in the residence.
To carry out the gray water catchment project and to design the sewage lines, the guidelines contained in NBR 8160 (ABNT, 1999). For the reservoir design and reuse water pipes the NBR 5626 (ABNT, 1998) was used.
Employee Treatment System
For the collected waters treatment, two different treatments were analyzed to verify the efficiency of each system. However, both undergo a pretreatment consisting of a decanter to remove the larger particles in suspension and a sand filter.
Afterwards the effluent passed through the main treatment, where the comparative between the biological filter with earthworm humus and the wetlands (drowned ponds) was carried out.
The decanter adopted for the effluent pretreatment is the conventional rectangular system with vertical force (gravity action). Figure 2 illustrates the decanter with vertical flow, according to (GUEDES; CARVALHO, 1997).
Fig. 2. Decanter employee
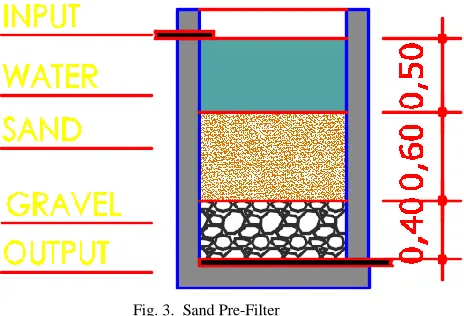
The pre-filter adopted is vertical flow downward. Composed by layers of sand and gravel, in the thicknesses shown in Figure 3, based on (TOMAZ, 2009).
The filter has a water depth of 0,50 meters. The first layer of the filter was made of medium sand, whose diameter was 0.35 meter, efficient sand, with a layer of 0,60 meters. The support layer was composed of gravel 2 (16 millimeters), whose depth is 0,40 meters (TOMAZ, 2009).
Fig. 3. Sand Pre-Filter
Fig. 4. Multi-layered filter with activated charcoal
To calculate the filters capacity, Equation 2 was used according to NBR 13.969 (ABNT, 1997), which considers detention time, filter capacity and contributors number.
𝑉𝑢 = 𝐶 × 𝑇 × 𝑁 (2)
Being that:
T-Time detention (days)
C- Filter capacity (L x habitant / day) N- Contributors Number
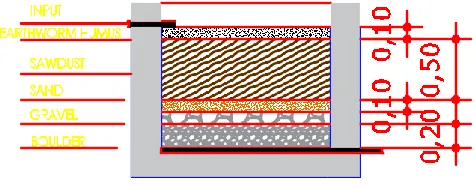
A system composed of pebbles, gravel, sand, sawdust and earthworm layers was used for the biological filter with earthworm and sawdust humus. The filter has a total height of 1.0 meter, totaling a useful volume of 0,78 cubic meters. The support layer, from the bottom up, is filled with pebbles layer of thickness of 0,20 meters, followed by a crushed layer stone whose thickness is 0,10 meters. Afterwards a layer of 0,10 meters of sand washed and 0,50 meters of wood shavings. The last layer of 0,10 meters composed of earthworm humus (SANTIAGO et al, 2012). Figure 4 represents the system.
Fig. 4. Biological filter with earthworm humus
In the treatment with wetlands, the vertical descending flow tank was used, with a total height of 1.20 meters, with a minimum holding time of 30 minutes, according to NBR 13.696 (ABNT, 1997).
It was used as filter media gravel, gravel and sand. As macrophytes, the plants were chosen from the region, which adapts better to the climate and humid environments. Zantedeschia aethiopica, known as milk cups, was used.
The Figure 5 illustrates the root zone module containing plants on a physical filter structured by a gravel layer number 2, whose thickness of 0.50 meters, covered with fine gravel to avoid the laying of vector eggs, with a thickness of 0 .10 meters. This layer of gravel lies on another layer of the filter composed of medium to coarse-grained sand with a thickness of 0.40 meters. At the bottom of this filter, a new 0.20 meters thick gravel layer is accommodated along with the pipes that collect the treated effluent, leading it out of the station, based on KAICK (2002).
Fig. 5. Wetland vertical flow
The treatment with wetlands goes through the entire process previously exemplified, resulting in a system consisting of a decanter, a pre-filter, wetlands, and subsequent activated carbon filter.
For NBR 13.696 (ABNT, 1997), the maximum depth of the water slide should be between 0 and 1 meter. The relation width x length is established in 3: 1 (TOMAZ, 2009). As a criterion for dimensioning the area of the root zone for single-family units, the one established by Philippi; Sezerino (2004) was adopted. The application range was 1 m²/person.
Gray Water Quality Analysis
Due to the potability that the ash water must present, the effluent must undergo a water quality analysis to guarantee the necessary quality for the use a certain purpose. The gray water was collected in the washbasins, shower and washing machine of the residence and were analyzed in specialized laboratory. Three samples of the gray water were collected.
Three samples were collected in each treatment process to separately evaluate the efficiency of each treatment and to guarantee the statistics and veracity of the data, as well as 3 samples of the complete treatment system were collected. Each treatment step was numbered. The decanter is step 1, pre-filter 2, main filter of 3, and finally the numbered post-filter of 4. The filter being with earthworm humus called A and Wetland was called B.
Economic analysis
For the economic feasibility study, the costs related to the implementation of the treatment system were determined, in addition to the water savings generated by the implementation of this system.
The drinking water cost was obtained through monthly water consumption at the study residence, considering the amount charged by COPASA from January 2016 to February 2017.
To calculate the drinking water cost before the reuse system implementation, it is applied the Equation 3, according to (OLIVEIRA, 2004).
𝐶𝑎𝑝 = 𝐶𝑚 × 𝑉 × 12 (3)
Being that:
Cap- Drinking water cost before the reuse implementation (R$/year)
Cm- Monthly drinking water consumption (m³/month) V- Water value consumed (R$/m³)
To determine the costs with the reuse of gray water system implantation in the building was carried out the survey of materials and accessories necessary for the installation and operation. The prices of materials in specialized stores were investigated.
Equation 4 is used to calculate the drinking water saving the implementation of the water reuse system, based on (OLIVEIRA, 2004).
𝐸water = 𝐶𝑚 × 𝑃 × 𝑉 × 12 (4)
Being that:
Ewater- Drinking Water Economics after the reuse implementation (R$/year)
Cm- Drinking water consumption (m³/month)
P- Consumption percentage that will be replaced by the reuse water
V- Water consumed value (R$/m³)
The economic feasibility investment analysis for the water reuse system for house cleaning, garden rule and sanitary discharge was carried out using the Payback Method, according to HIRSCHFELD (2009), (Equation 5).
𝑃 =𝐺𝐿 (5)
III. RESULTSANDDISCUSSIONS
Through collection in the field, one can obtain the consumption points in the residence analyzed, being a lavatory, a shower, a washing machine and a toilet.
Consumption was adopted according to data collected from surveys of residences with the same pattern as the study object.
Consumption estimate
The real consumption in the residence occurred through the values provided by (COPASA, 2017). The average consumption in the building is 16 m³ of water per month. To correct possible variations in water consumption, the consumption indicator was calculated, being 0.11 m³/ consumer agent per day.
The highest consumption in the residence is characterized by the use in the sanitary discharges, followed by the shower and the kitchen sink. The lowest consumption is in house cleaning and garden irrigation. For the reuse, it was used the waters coming from the lavatory, shower and washing machine to be reemployed in the discharge and cleaning and irrigation of garden.
It can be observed that monthly consumption in the sanitary basin totals a percentage of 34% and garden watering plus household cleaning totals 6%, which represents 6.4 m³ of water consumption in the residence. The other consumptions from the shower, lavatory and washing machine represent 42%, totaling a consumption of 6.72 m³, which indicates that the supply of gray water for the sanitary basin supply is higher and will meet the required consumption.
Pipes sizing
The sewer lines were dimensioned. For the bathroom extensions, there was contribution of the lavatory and shower, totalizing a nominal diameter of 40 millimeters, however it was adopted 50 mm, since it is the market value for siphoned box. For the service area, 50 mm was adopted, since the minimum drainage pipe is 50 mm.
Analyzing the recommendations regarding the ventilation columns design, the nominal diameter of 40 mm was defined, since the ventilation pipe meets 3 UHC.
The reservoir was designed to serve two consumption days. Daily consumption for catchment points totals 0.224 cubic meters. To meet two demand days of 0.213 cubic meters/day requires a reservoir of 0.426 cubic meter. Therefore, a lower commercial tank of 500 liters is used.
Employee Treatment System
For the worm humus treatment system, the configuration shown in Figure 6 was obtained. The effluent passed through the decanter, followed by the pre-filter, the biological filter and the activated carbon filter.
For the wetlands treatment system, the same procedures described and illustrated above were employed. Figure 7 depicts the system of primary, primary and post-treatment pretreatment steps.
Fig. 7. Treatment sequence with Wetland
Gray Water Quality Analysis
Samples of the effluent from the lavatory, shower and washing machine were collected in 3 samples and analyzes were carried out to identify their respective quality parameters to employ the appropriate treatment.
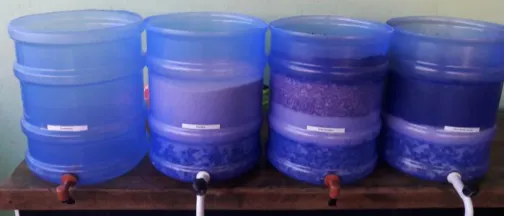
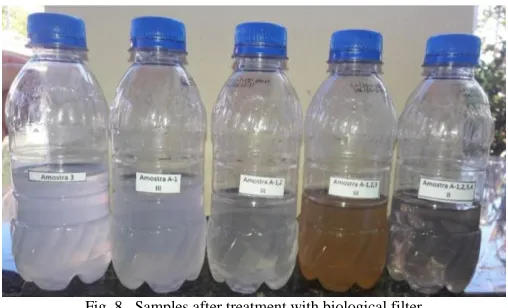
For the biological filter treatment system, samples were collected throughout the system to perform a comparison between the treatment steps and to verify the efficiency of each filter system, as shown in Figure 8, with Sample 3 being the effluent without any Sample A-1 represents the effluent already passed through the decanter, Sample A-1.2 the effluent passed through the decanter plus the sand pre-filter, Sample A-1,2,3 the effluent passed through the decanter, More pre-filter and biological filter. Finally, Sample A-1,2,3,4 is used which represents the effluent completely treated by the system.
Fig. 8. Samples after treatment with biological filter
As a result, the parameters shown in Table I were obtained. Samples 1, 2 and 3 are the raw effluents collected. The samples I, II, and III represent the samples that were collected after each treatment step of the biological filter.
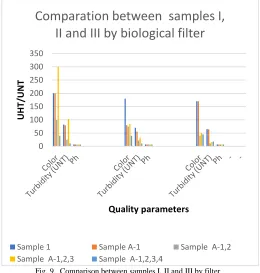
It can be observed that there was a great variation between the samples collected I, II and III. According to Figure 9 the most efficient samplings were those of number II and III. This
is due to the effluent being in contact with the filter system for a longer time, having a more significant the color and turbidity reduction. When analyzing the parameters individually, it was observed that the pH of the samples remained constant in all treatment stages, with only color reduction and turbidity.
TABLEI
RESULTS OF THE BIOLOGICAL FILTER TREATMENT SYSTEM
Water Quality Parameters
SAMPLE
1
Sample I
A-1 A-1,2 A-1,2,3 A-1,2,3,4 Color (UHT) 200 200 100 300 40 Turbidity (UNT) 82 79 25 103 11
pH 7,2 7,2 7,0 6,8 7,0 Water Quality
Parameters
SAMPLE
2
Sample II
A-1 A-1,2 A-1,2,3 A-1,2,3,4
Color (UHT) 180 80 75 85 40 A-1,2 A-1,2,3 A-1,2,3,4 Turbidity (UNT) 70 56 22 33 11
pH 7,1 7,1 7,1 7,1 7,0 6,8 7,0
Water Quality Parameters
SAMPLE
3
Sample III
A-1 A-1,2 A-1,2,3 A-1,2,3,4
Color (UHT) 170 170 40 50 45 85 40 A-1,2,3,4
Turbidity (UNT) 65 64 11 16 18 22 33 11
pH 7,1 7,0 6,9 7,0 7,0 7,1 7,1 7,0
TABLEII
RESULTS OF THE WETLAND TREATMENT SYSTEM
Water Quality Parameters
SAMPLE
1
Sample I
B-1 B-1.2 B-1.2,3 B-1.2.3.4 Color (UHT) 200 200 100 55 5 Turbidity (UNT) 82 79 25 18 4
pH 7,2 7,2 7,0 7,2 7,0 Water Quality
Parameters
SAMPLE
2
Sample II
B-1 B-1.2 B-1.2.3 B-1.2.3.4
Color (UHT) 180 80 75 40 7,5 A-1,2 A-1,2,3 A-1,2,3,4 Turbidity (UNT) 70 56 22 12 6
pH 7,1 7,1 7,1 7,0 7,1 6,8 7,0
Water Quality Parameters
SAMPLE
3
Sample III
B-1 B-1.2 B-1.2.3 B-1.2.3.4
Color (UHT) 170 170 40 40 5 85 40 A-1,2,3,4
Turbidity (UNT) 65 64 11 9 4 22 33 11
Fig. 9. Comparison between samples I, II and III by filter
When comparing the results obtained with those established by NBR 13.969 (ABNT, 1997), the minimum for turbidity is 10 UNT and the minimum reached was 11 UNT. Therefore, the treatment system did not meet the minimum standards required. While for Sinduscon (2005) the turbidity must be less than 2 UNT, but the reached was 11 UNT. The minimum color to be reached is 10 UH and the reached color was 40 UH. The pH must be between 6 and 9 and this has been reached. So, the treatment did not reach the minimum.
Finally, samples were collected throughout the wetlands treatment system to make a comparison between the systems and to verify the efficiency of each filter system, as shown in Figure 10. Sample 3 the effluent without any treatment, the Sample B-1 represents the effluent already passed through the decanter, Sample B-1,2 the effluent passed through the decanter plus the sand pre-filter, Sample B-1,2,3 the effluent passed through the decanter, plus pre-filter And wetlands. The sample B-1,2,3,4 is used to represent the effluent completely treated by the system.
Fig. 10. Samples after treatment with wetlands
As a result, the parameters shown in Table II were obtained. Samples 1, 2 and 3 are the raw effluents collected. Samples I, II, and III represent the samples that were collected at each Wetland treatment stage.
It can be observed that there was not a great variation among the collected samples I, II and III. According to Figure 11 there was a significant reduction of the parameters analyzed. The color and turbidity parameters showed reductions in all the samples and the pH remained constant.
Fig. 11. Comparison between samples I, II and III by wetland
When comparing the results obtained with those established by NBR 13.969 (ABNT, 1997), the minimum for turbidity is 10 UNT and the minimum reached in the Wetland treatment was 4 UNT. Therefore, the treatment system complied with the minimum standards required by NBR 13.969 (ABNT, 1997).
While for Sinduscon (2005) the turbidity must be less than 2 UNT, but the reached was 4 UNT. Therefore, this parameter was not reached. The minimum color to be reached is 10 UH and the reached color was 5 UH. The pH must be between 6 and 9 and this has been reached. Therefore, for these parameters the treatment was efficient.
It is considered the pH values between 7.00 and 7.99 to be within the neutrality range, the which provides the microbial bacteria growth adapted to these values, as for example the nitrifying agents (MANDIGAN et al., 2003).
The pH values presented reduced changes, when it was compared the input and effluent, even after passing through the different arrangements prototypes, ranging from 7.2 to 7.00.
Mavioso (2010) used root zones in the synthetic effluent treatment and reported low pH variation, with a maximum variation of 6.5%. The author relates this stability to a system maturity. Kadlec and Knight (1996) say that in wetland treatment systems, pH is related to the characteristics of the filter media (or soil), which may be more alkaline or acidic, ranging from 6.7 to 7.8.
0 50 100 150 200 250 300 350
UH
T/UN
T
Quality parameters
Comparation between samples I,
II and III by biological filter
Sample 1 Sample A-1 Sample A-1,2
Sample A-1,2,3 Sample A-1,2,3,4
0 50 100 150 200 250
UNT/
UH
T
Quality parameters
Comparison between samples I, II
and III by wetland
Samble 1 Samble B-1 Samble B-1,2
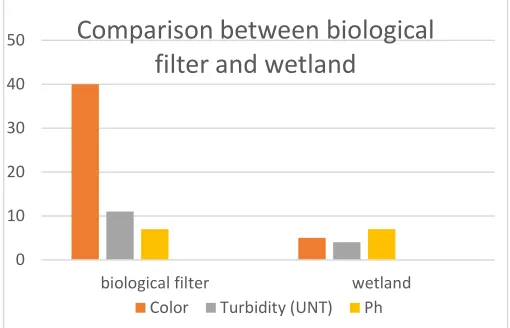
When comparing the two-treatment systems Wetland is the one that presents the highest efficiency and the parameters reductions analyzed (Figure 12). The color obtained in the biological filter treatment system was 40 HU. In contrast, in the Wetland system it presented 5 HU, making it more efficient. In the turbidity parameter, the biological filter presented 11 UNT and Wetland 4 UNT.
Fig. 12. Efficiency comparison between biological filter and Wetland
Economic analysis
There is a drinking water cost before the reuse implementation in the amount of R$ 1309.44, with monthly drinking water consumption of 16 m³/month and water value consumed R$ 6.82/m³.
All materials and accessories necessary for the installation and water collection operation, treatment and distribution system were surveyed.
The cost with the implantation of the treatment system with biological filter of worm humus is of R$ 1,290,48. While the cost with the implementation of the Wetland treatment system is R$ 3,594.27.
It is observed that the Wetland system demands a greater investment, since the amount of sand to be used in the construction of the system is higher when compared to the treatment system with biological filter, being the most significant input.
The drinking water saving generated by the reuse system implementation is calculated based on the water value and the monthly consumption. For that, a consumption percentage must be reduced by 42%. Therefore, there is an economy of R$ 523.78/year.
Oliveira (2005) obtained a drinking water saving, with the implantation of the reuse system, of 25.6%, using as root zone treatment.
Analyzing the investment return period for the biological filter treatment system, it is observed that it takes 3 years to pay off the investment. While for the Wetland system it takes 7 years to deduct the investment value. It is observed that the biological filter system is more economically viable compared to the Wetland treatment system, since the latter has a higher investment value because of the sand amount in the system.
IV. CONCLUSION
Problems associated with water scarcity have led many countries to study other sources to meet the high demand for water resources. The gray water reuse is one of the alternatives employed with the purpose of generating water with quality to meet the high demand.
Thus, technical and economic analysis was carried out with the reuse system implementation in a popular residence. To carry out the sizing of the system, it was necessary to draw up consumption in the final uses in each sanitary appliance, as well as the treatment system to be used to guarantee the water quality and the costing to analyze the financial system viability.
In the consumption survey and water sectorization resources it is concluded that the highest water consumption occurs in the sanitary basins. Therefore, the reuse was carried out in order to meet the demand of this appliance along with washing floors and garden watering (40%). Samples of the washing machine shower and washbasin were collected for this purpose, which presents 42% of the consumption.
To meet the quality standards of reuse water we analyzed system with biological filter and Wetland.
For the treatment system with biological filter of earthworm humus it is concluded that it was efficient in the color and turbidity removal, but did not reach the minimum disposed in NBR 13.969 (ABNT, 1997). The color obtained in the system was 40 UH and turbidity of 11 UNT, with a minimum of 10 UNT. According to Sinduscon (2005) the color must be less than 10 UH and turbidity less than 2 UNT. So, the system with biological filtration is not technically feasible.
For the system with Wetland it is concluded that this is the one that presented better technical efficiency. The system reached the minimum specified in NBR 13.969 (ABNT, 1997), for turbidity of 10 UNT, the reached in the treatment of Wetland was 4 UNT. However, if analyzed according to Sinduscon (2005) this did not reach the minimum in turbidity of 2 UNT.
A comparison between the two treatment systems shows that Wetland is more technically feasible, as it presented results close to the minimum stipulated.
Economic analysis has shown that the biological filter system is more viable compared to Wetland. For the treatment system with biological filtration the return period is 3 years with an investment of R$ 1,290.48. For the Wetland system there is 7 years, with an investment of R$ 3,594.27. This is due to the price of sand used in the system.
However, analyzing the environmental side, it is concluded that the water reuse practice brings great benefits, since it reduces the demand for surface and underground water, protects the water resources and reduces the discharge of sewage on the water sources.
ACKNOWLEDGMENTS
The authors acknowledge the financial assistance provided by the Foundation for Research Support of Minas Gerais, FAPEMIG.
REFERENCES
[1] ABNT, NBR 5.626, 1998. Icy Water Installations, Brazilian Association of Technical Standards, Rio de Janeiro.
[2] ABNT, NBR 8.160, 1999. Sanitary sewage systems - Design and execution, Brazilian Association of Technical Standards, Rio de Janeiro.
0 10 20 30 40 50
biological filter wetland
Comparison between biological
filter and wetland
[3] ABNT, NBR 13.969, 1997. Septic tanks - Complementary treatment units and final disposal of liquid effluents - Design, construction and operation, Brazilian Association of Technical Standards, Rio de Janeiro.
[4] NATIONAL AGENCY OF WATER - ANA. Water Bulletin 2005. Available at: http://www.ana.gov.br. >. Accessed on: 15 Feb. 2015. [5] BLOCH, D., 2002. Water: Right to Life. Available at:
<http://ircsa.org.br/semana/aguavida.htm>. Accessed on: 22 Oct. 2015. [6] BRAGA, R. G. Technical and economic evaluation for the gray water
reuse in an educational institution in the municipality of Itajubá. In: National Congress of the Environment of Poços de Caldas, 2016, Poços de Caldas. Anais V.8, N.1, 2016. Available at: <http://www.meioambientepocos.com.br/anais-2016/index.php>. Accessed on: 13 jun. 2017.
[7] BRANCATELLI, R. SP begins to invest in water reuse. The State of São Paulo, May 6. 2007. Cities / Metropolis, Environment Notebook, p.c. 12. [8] COUTO, E.A., et al. Greywater treatment in airports using anaerobic filter followed by UV disinfection.: an efficient and low-cost alternative. Journal of Cleaner Production, 2014,
http://dx.doi.org/10.1016/j.jclepro.2014.07.065.
[9] SANITATION COMPANY OF MINAS GERAIS - COPASA. Water bill for Jan/2017. Brasópolis, 2017.
[10] GONÇALVES, R. F. et al (Coord.). Rational Use of Water in Buildings. Project PROSAB. Rio de Janeiro: ABES, 2006.
[11] GUEDES, A.B.; CARVALHO J.M. Operation and Maintenance of ETA'S. Technical Advice on water and sewage treatment, CAGERA, 1997.
[12] HENZE, M; LEDIN, A. Types, characteristics and quantities of classic, domestic wastewaters. New York. IWA Published, 2001.
[13] HESPANHOL, I..; MIERZWA, J. C. Program for the management of water and effluents in industries for rational use and reuse. Sanitary and Environmental Engineering, v. 4, n. ½, p. 11-15, 2000.
[14] HIRSCHFELD, H. Economic engineering and cost analysis: Practical applications for economists, engineers, investment analysts and administrators - 7. ed. - 5. reimpr. São Paulo: Atlas, 2009.
[15] KADLEC, R.H. E KNIGHT, R.L. Treatment Wetlands. Boca Raton, Florida: Lewis Publishers. 1996, 893p.
[16] KAICK, T.S.VAN. Sewage Treatment Plant by Root Zones: A Proposal for Appropriate Technology for Basic Sanitation in the Coast of Paraná, 2002. Master's thesis, postgraduate program in Technology. Federal Center for Technology of Paraná, Curitiba, 2002.
[17] MANCUSO, P. C. S..; SANTOS, H. F. Water reuse. Barueri, S.P.: Malone, 2003.
[18] MAVIOSO, J. F. Treatment of wastewater through beds of macrophytes: influence of vegetation. Dissertation (Environmental Engineering) University of Lisbon. Lisbon, 2010. 84p.
[19] OLIVEIRA, L.H. Methodology for the implementation of a rational water use program in buildings, 1999. Thesis (Doctorate). Polytechnic School, University of São Paulo, São Paulo, 1999.
[20] OLIVEIRA, Y. V. Use of the Serial Water Balance for the Dimensioning of Rainwater Storage Structure: Case Studies, 2004. Master's Dissertation. Graduate Program in Environmental Engineering. UFSC. Florianopolis, 2004.
[21] OLIVEIRA. S.M. Utilization of rainwater and water reuse in single-family homes: Case study in Palhoça, 2005. Conclusion of a civil engineering course - Federal University of Santa Catarina, Florianopolis, 2005.
[22] PEREIRA JR., J. S. Water Resources - Conceptualization, availability and uses. Brasília, 2004.
[23] OTTERPOHL, R. Black, brown, yellow, grey – The new colors of sanitation. Water 2, p. 31-41, out 2001.
[24] PHILIPPI, L. S; SEZERINO, P. H. Application of Wetlands-type Systems in the Treatment of Wastewater: Use of Filters Planted with Macrophytes. Florianopolis: Ed. Do Autor, 2004. PNCDA - National Program to Combat Water Waste, 2004.
[25] REBÊLO, M. M. P. S. Characterization of ash and black waters of residential origin and analysis of the efficiency of anaerobic reactor with baffles. 2011. 113 f. Dissertation (Master in Engineering: Water Resources and Sanitation) - Federal University of Alagoas. Center of Technology, Maceio, 2011.
[26] SANTIAGO, F. S., et al. Bioágua Familiar: Gray Water Reuse for food production in the semiarid region. Dom Helder Camara Project, Recife, 2012.
[27] SINDUSCON - Union of the Civil Construction Industry of the State of São Paulo. Manual of Conservation and Reuse of water in buildings. São Paulo, 2005.
[28] TOMAZ, P. Course on rainwater management. In: Digital Books. Chapter 59 - Wetland built to improve the quality of rainwater, 2009. Available at: <http://www.pliniotomaz.com.br/downloads/capitulo59_wetland.pdf>. Accessed on: 02 May. 2017.
[29] TSUTIYA, M. T. Water supply. 3. Ed. São Paulo: Department of Hydraulic and Sanitary Engineering of the Polytechnic School of the University of São Paulo, 2006.
[30] SÃO PAULO UNIVERSITY - USP. Water Use Program - PURA, 1999. Available at: <http://pura.poli.usp.br/main.html>. Accessed on: ten. 2016.