Numerical Study of Active Mass Damper
Application on Cable-Stayed Bridge Structure Using
Artificial Neural Network Algorithm
Herlien D. Setio and Andri S. Gunawan
Department of Civil Engineering, Faculty of Civil and Environmental Engineering, Institut Teknologi Bandung
Email: [email protected], [email protected]
Abstract-- Along with the remarkable advances of IT and
material science, the active vibration control of civil
engineering structures is also progressing significantly both in its algorithm as well as in its implementation on structures. The artificial neural network controller that has been appreciated for its adaptability, robustness, and excellent capability in input-output mapping of structural systems is proposed in this study.
The calculation of the control algorithm in mathematical formulated methods which is time consuming, will be replaced by a neural network controller (neuro-controller).
The purpose of this study is to evaluate the effectiveness of active control strategy by using Artificial Neural Network (ANN) algorithm on a complex and large cable-stayed bridge structure. A multi layer neural network was designed and tested in the computer simulation of structural control of the bridge. First, an earthquake loading was used to obtain the training data needed by the neuro-controller. Then, the trained neuro-controller was implemented in the structure to reduce the bridge response for different dynamic loadings. Non-linearity problems, which may result from either large displacements or material non-linearity as well as from damages were also taken into consideration in the study.
To demonstrate the effectiveness of the proposed strategy, numerical simulations were performed using a benchmark cable-stayed bridge subjected to three recorded earthquake loadings.
The control mechanism was achieved by placing an Active Mass Damper (AMD) system on the bridge deck and on top of the pylons. The simulation results show that the AMD with the ANN controller algorithm can effectively reduce the responses of the bridge with reasonable control forces, thus showing great promise for its implementation in non-linear complex structures.
Index Term-- Active-control, Cable-stayed Bridge, Active Mass Damper, Artificial Neural Network
1. INTRODUCTION
Damaging earthquakes and other environmental loadings provide powerful reminders of how vulnerable we are in facing the forces of nature. Consequently, new development and innovative concepts of structural protection should be introduced to better protect the structures along with their
safety requires that the resistance of all the elements of the structure should be greater than the demand associated with the design loading as regulated in the building codes. A strength based design approach can only be applied when strength is the dominant design requirement. But this design approach is no longer effective for certain structures such as a very tall building or a long span bridge which can be categorized as flexible structures. Another solution is to modify the behavior of the structure so that its response due to external loadings can be reduced significantly. This approach can be done by implementing a structural control system to the structure.
The trend towards more flexible structures and the necessity of more severe design constraints of motion such as space platforms, free vibration measurement facilities, high speed trains, or semiconductor manufacturing centers, in conjunction with the advances in material science and phenomenal progress in IT, leads to the possibility of applying vibration control system to civil structures. The system has been applied to modern civil structures under unusual or severe excitations, and structures with critical functions such as hospitals and power plants. The vibration control system can also be applied to structures requiring a high serviceability, such as long bridges, sky-scrappers, towers, and any other structures with high flexibility.
Generally, the structural control system can be divided into three main groups, which are active control, passive control, and hybrid control as a combination of active and passive systems.
A passive control is a system which does not need additional any external energy to make the structure adaptable to external loads. Some examples of passive control system are tuned mass damper and base isolation.
Bridges, especially long-spanned bridges are very sensitive under dynamic loading such as winds and earthquakes. The tendency of long-spanned bridges to be flexible can cause large amounts of deformation under dynamic loads. This deformation can be very dangerous for the commuter traversing the bridge, and may cause the bridge to be closed until the danger subsides. This is the reason why active control may be introduced as one of the solution to encounter the problem.
Control forces, should be generated to the structure as fast as possible to maintain its stability. When the structure to be controlled becomes large and complex, the control force computation will be time consuming and cause the system to not perform as was expected. To encounter this problem, faster calculation devices or better and more efficient control algorithm should be introduced. The Artificial Neural Network (ANN) is one of the methods with faster calculation time than the classic optimal control. This paper proposes using ANN to control the dynamic system as the substitute of the classic optimal control algorithm for cable-stayed bridges.
Back Propagation Learning (BPL) methode is used to train the ANN. This method of training is one of the supervised learning and designed to operate in a feed forward multi-layered network.
The hybrid ant colony optimization principle is used in the input weighting calculation. This methode is expected to give the optimal input weighting results so that the error between the target output and the ANN output will be as small as it was defined.
2. ACTIVE VIBRATION CONTROL OF STRUCTURE
Vibration control is any effort or method in reducing structural response by giving the structure an ability to cope with external forces. In this case, an additional control system is implemented by mounting the structure with certain devices that can produce control forces to counteract the external excitations.
A structure with many degrees of freedom, actively controlled and subjected to dynamic external loadings, can be represented by the following Eq. (1),
)
(
)
(
)
(
)
(
)
(
t
C
x
t
Kx
t
Du
t
Ef
t
x
M
(1) where M, C and K represent respectively the mass, dampingand stiffness matrices, x(t) is displacement vector, f(t) a vector representing external excitation, and u(t) is the control force vector generated from the Active Mass Damper (AMD). D
and E are the location matrices of the control force and the
excitation, respectively. The structural system may exhibit some non-linearities resulting from material as well as from geometric non-linearities.
The state-space representation of dynamic motion of the structure is given in the Eq. (2).
)
(
)
(
)
(
)
(
t
Az
t
Bu
t
Hf
t
z
(2)
where
) ( ) ( ) ( t t t x x z (3)
C M K M I 0A 1 1
D M 0 B 1
E M 0 H 1
(4)
In classical linear optimal control, the control vector u(t) is chosen in such a way that a performance index J, defined in Eq. (5), can be minimized
tft f
f
t
t
J
t
dt
t
t
J
J
0)
,
,
,
,
(
,
),
(
),
(
0 0 21
z
z
z
z
u
u
(5)Using the Lagrangian Multiplier, Eq. (5) can be solved for u
)
(
)
(
2
1
)
(
)
(
)
(
t
G
t
z
t
R
B
P
t
z
t
u
1 T(6)
0
2
2
1
Q
P
A
P
B
PBR
PA
1 T T (7)Therefore, the behavior of the optimally controlled structure using closed-looped control system can be written in the final equation
z
(
t
)
(
A
BG
)
z
(
t
)
Hf
(
t
)
(8)
z
(
0
)
z
0The matrices Q and R are weighting matrices, whose magnitudes are assigned according to the relative importance attached to the state variables and to the control forces in the minimization procedure. The larger Q compared to Rmeans that the reduction of the response is considered to be more important, which leads to the larger control force required by the system. These matrices are chosen based on the targeted response of the structures and the capability of the system in generating the control forces.
3. ARTIFICIAL NEURAL NETWORK (ANN)
An Artificial Neural Network (ANN) is a mathematical model that tries to simulate the structure and functionalities of biological neural networks in processing information. The ANN algorithm, in contrast to the optimal control algorithm, takes a significantly shorter time to calculate the control forces. The ANN algorithm needs only a set of input and output, which is usually the accepted value of the system. The representation of such a neural network can be seen in Figure 1
Fig. 1. Representation of neural system [Sarangapani, J]
Acording to Andrej Krenker [Andrej Krenker et al], .”the basic building block of every artificial neural network is an artificial neuron, which is a simple model (function). Such a model has three simple sets of mathematical rules: multiplication, summation and activation”. The input signals of the network are weighted individually and propagated in the form of a potential difference. Dendrite carries the signals from one neuron into the soma by multiplying each signal with the weighted function.
In the soma, the artifical neuron integrate the weighted signal and bias, then transmit it through the axons. The axons are connected through synapses with the dendrit of the neighboring neuron. The integration of the previously weighted inputs and bias which is passing through the synapses is the output of the artifial network.
The ANN algorithm then constructs a set of transfer function, which basically consists of simple regression functions in various forms. The process of constructing a transfer function is known as the training process. In this study, the accepted value for the ANN algorithm training or learning process is the value obtained by using optimal control algorithm, which will be discussed in more detail later on. The excellent capability of ANN in the input and output mapping of the neural system makes it possible to calculate the control forces very quickly.
The training process is an iteration of weighting values of the elements of the neural system until the ANN reaches the actual function within the tolerated error. Figure 2 shows the diagram of the training process.
Dendrite
Soma
Axon
Synapses
j i i ij j
y
x w ( )
j j
x f y
,
i ij
Fig. 2. Artificial Neural Network training process diagram [Setio]
This study uses several layers of neurons, where the number of neuron layers can be chosen according to the complexity of the system. The architecture of the neural network using three
hidden layers can be seen in Figure 3. The neurons between the layers are interconnected by the weights illustrated by the lines between the neurons (Vij, Wkl, and Umn).
Fig. 3. Artificial Neural Network architecture using three hidden neuron layers
The neurons in the ANN contain some activation functions that process the input data from the previous layer, and then transfer the output data to the next layer. The activation functions use some simple linear functions and log-sigmoid functions.
Back Propagation Learning (BPL) is one of the methods to train the ANN. This method of training is one of the supervised learning and designed to operate in a feed forward multi-layered network. Whenever the output gives a wrong result, the weights are adjusted so that the error between the target output and the ANN output will be as small as it was defined.
“Ant Colony Optimization (ACO) is a metaheuristic algorithm in which a colony of artificial ants cooperate in finding good solutions to complex discrete optimization problems ” [Dorigo].
Indirect communication mediated by the environment using cooperation of the artificial ants as relatively simple agents is a key design component of the ACO.
According to Dorigo, the ACO algorithms can be used to solve both static and dynamic combinatorial optimization problems. Static problems are problems where the definition of the problems are given only once at the beginning and does
not change during the solving process. Meanwhile, the dynamic problems have a dynamic characteristic along with the problem solving stage.
The convergence speed of the ANN learning process is strongly dependant on the initial weighting matrix choice. If the initial weighting matrix is not chosen properly, the BPL may fail to give the output which is close to those targeted. The ACO-BPROP method which is a hybrid type of the ANN learning method with a very good convergence speed.
The learning process can be carried out by steps as follow:
Define a possible discrete solution, with assumed maximum and minimum values
Define the architecture of the ANN together with their maximum and minimum values
Define the best discrete weighting matrix for Max-Min ACO algorithm
Carry out the Back Propagation Learning algorithm until acceptable errors achieved
4. CONTROL STRATEGY
Using structural properties of the bridge, stiffness matrix K, mass matrix M, damping matrix C, non-linear time history analisys is carried out to obtain uncontrolled dynamic
Artificial Neural Network
Input ANN Output Error
Optimal Control Method Target Output
Weight adjustment
+
_
(t)
1 a
(t)
2 a
1) -(t
1 a
1) -(t
2 a
1) -(t
u
(t)
u
LAPIS 1 LAPIS 2 LAPIS 3 LAPIS
MASUKAN
LAPIS KELUARAN
Vij
Input Layer
Wkl
Umn
Output Layer
Wkl
1st Hidden Layer
2nd Hidden Layer
responses of the structure under earthquake loadings. The response data are used to design the control system which will be implemented to the structure.
The location of sensors and the control force actuators are determined based on the structure responses of uncontrolled structure calculated previously. The control force actuators should be placed at certain chosen locations so that the system works effectively and efficiently. The new structural system with the AMD is analyzed using optimal control algorithm as mentioned in Eq. (6), (7), and (8).
The structure response resulting from optimal control algorithm will then be used as input data for the ANN training process. The Cape Mendocino Earthquake – Cape Mendocino, is the earthquake excitation used in the training of the ANN. Once the training process reaches the defined convergence, it can be said that the structure is smart and ready to be tested for other types of dynamic loadings. The dynamic performance of the smart structure, which has been equiped with the Active
Mass Damper (AMD) system, can then be evaluated using other earthquake excitations.
5. STRUCTURE MODEL
The Russky bridge, in Vladivostok, Russia, was chosen as the case study in the numerical analysis. This bridge was built in the Eastern Bophorous lane to serve the Asia-Pacific Economic Cooperation held in Vladivostok in 2012. The bridge connect the Nazimov Peninsula main island to Russky island, where the main conference activity took place. This time, Russky bridge is the longest cable-stayed bridge in the world where the main span reaches 1104 m. The pylon height is the second highest after the Millau Viaduct in France. The bridge design was determined based on the shortest distance between the two coasts of the island, and taking into consideration the environmental conditions such as temperature, wind, snow etc. The bridge structure model can be seen in Figure 4 .
Fig. 4. The Russky bridge structure model [Mostovik]
The bridge has 168 cables where the shortest cable is 135.771 m long and the longest is 579.83 m. The cables are modeled as truss elements and sagging effects is taken into account.
The material property data used in the structural analysis are:
Concrete for the pylon and pre-stress concrete for the girder: density (γ) = 25 kN/m3, elasticity modulus (E) = 33 x 106 kPa, Poisson Ratio = 0.2, shear modulus (G) = 13.75 x 10⁶ kPa.
Steel girder: density (γ) = 77 kN/m3, elasticity modulus (E) = 200 x 106 kPa, Poisson Ratio = 0.3, shear modulus (G) = 76.9231 x 10⁶ kPa.
Steel cable: : density (γ) = 91 kN/m3, elasticity modulus (E) = 195 x 106 kPa,
Fig. 5. Structure model of bridge pylon [Mostovik]
6. ACTIVE MASS DAMPER SYSTEM
The active mass damper system implemented to the bridge structure consists of spring, viscous damper, actuator which are mounted in parallel, and a mass damper is mounted in
serial configuration to the system mentioned previously. The active mass damper system is illustrated in Figure 6.
Fig. 6. Active mass damper system
The mass dampers are mounted both in the girder to stabilize the bridge deck, and in the pylons to reduce the overall bridge responses. The placement scheme is decided by taking into account the position on the deck which has the maximum deformation on uncontrolled state under earthquake loading. Four horizontal dampers are placed on top of each Pylon, and several vertical dampers which varies from 3 to 15 dampers are placed on the girder of the bridge.
The control devices employed on the structures to generate control force are hydraulic actuators, where the placement scheme can be seen in Figure 7 and Figure 8. The placement scheme is determined by taking into account the position on the deck which has the maximum deformation on uncontrolled state under earthquake load.
Fig. 7. Active mass damper location in the bridge girder
a) b)
Fig. 8. a) Hydraulic actuator MTS Series 201, Type 201.17
b) Active mass damper placement scheme
7. RESULTS
Point A at the middle of the bridge (vertical degree of freedom) and point B (on top of the pylon) are chosen to represent structure components in the evaluation of the structure response. The structure was excited using 3 earthquakes : Cape Mendocino Earthquake – Cape
Mendocino, Imperial Valley Earthquake – El Centro Differential Array, and Chi-Chi Earthquake – TCU068.
The relative nodal displacement at the middle of the girder bridge span (point A) without and with active mass damper can be seen in Figure 9 to Figure 11.
Fig. 9. The relative nodal displacement at the middle of the girder bridge span (point A) for uncontrolled and optimal controlled
structure (Cape Mendocino Earthquake – Cape Mendocino)
0 5 10 15 20 25 30
-5.2 -5 -4.8 -4.6 -4.4 -4.2 -4 -3.8 -3.6
Time vs Relative Displacement - (Cape Mendocino - Cape Mendocino) Point A - Girder
Time (sec)
R
e
l.
D
is
p
la
c
e
m
e
n
t
(m
)
Uncontrolled Optimal Controlled
-600 -400 -200 0 200 400
-200 -100 0 100 200 300 400 500 600
Undeformed Shape
x (m)
y
(m
)
Vertical AMD Horizontal AMD
01 02 03 04 05
06 07 08 09 10 11 12
Fig. 10. The relative nodal displacement at the middle of the girder bridge span (point A) for uncontrolled and optimal controlled structure (Imperial Valley Earthquake – El Centro Differential Array)
Fig. 11. The relative nodal displacement at the middle of the girder bridge span (point A) for uncontrolled and optimal controlled
structure (Chi-Chi Earthquake – TCU068)
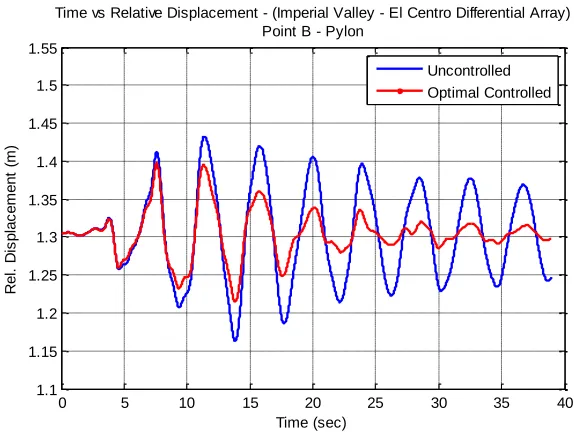
It can be seen that the active mass damper provides significant extra damping to the structure so that the structure respons very well and the seismic response was greatly reduced. Similar observation can also be made for the relative nodal displacement on top of the pylon.
Figure 12 to Figure 14 show the relative nodal displacement on top of the pylon (point B) for uncontrolled and optimal controlled structure.
0 5 10 15 20 25 30 35 40
-5.2 -5 -4.8 -4.6 -4.4 -4.2 -4 -3.8 -3.6
Time vs Relative Displacement - (Imperial Valley - El Centro Differential Array) Point A - Girder
Time (sec)
R
e
l.
D
is
p
la
c
e
m
e
n
t
(m
)
Uncontrolled Optimal Controlled
0 10 20 30 40 50 60 70 80 90 -5
-4.5 -4 -3.5
Time vs Relative Displacement - (CHI-CHI - TCU068) Point A - Girder
Time (sec)
R
e
l.
D
is
p
la
c
e
m
e
n
t
(m
)
Fig. 12. The relative nodal displacement at the top of the pylon (point B) for uncontrolled and optimal controlled structure (Cape
Mendocino Earthquake – Cape Mendocino)
Fig. 13. The relative nodal displacement at the top of the pylon (point B) for uncontrolled and optimal controlled structure (Imperial
Valley Earthquake – El Centro Differential Array)
0 5 10 15 20 25 30
1.1 1.15 1.2 1.25 1.3 1.35 1.4 1.45 1.5 1.55
Time vs Relative Displacement - (Cape Mendocino - Cape Mendocino) Point B - Pylon
Time (sec)
R
e
l.
D
is
p
la
c
e
m
e
n
t
(m
)
Uncontrolled Optimal Controlled
0 5 10 15 20 25 30 35 40
1.1 1.15 1.2 1.25 1.3 1.35 1.4 1.45 1.5 1.55
Time vs Relative Displacement - (Imperial Valley - El Centro Differential Array) Point B - Pylon
Time (sec)
R
e
l.
D
is
p
la
c
e
m
e
n
t
(m
)
Fig. 14. The relative nodal displacement at the top of the pylon (point B) for uncontrolled and optimal controlled structure (Chi-Chi
Earthquake – TCU068)
As mentioned previously, the structure response resulting from the optimal control algorithm was then used as input data for the ANN training process. Cape Mendocino Earthquake – Cape Mendocino, was chosen as the earthquake excitation and used for the training of the ANN. The response of the controlled structure calculated with the ANN algorihm is compared to that obtained from classical optimal control algorithm calculated previously.
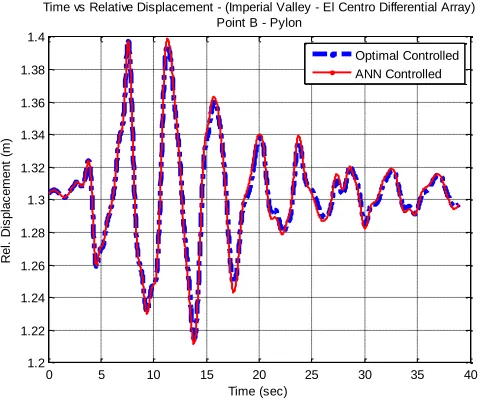
Figure 15 to Figure 20 show the comparison between the relative nodal displacements of the bridge which are obtained from the optimal control algorithm and from Artificial Neural Network (ANN) algorithm. It can be seen that the ANN algorithm gives results which are very close to those obtained from the optimal control algorithm even for earthquake loadings which were not used in the training process.
Fig. 15. The relative nodal displacement at the middle of the girder bridge span (point A) for optimal controlled and ANN controlled
structure (Cape Mendocino Earthquake – Cape Mendocino)
0 10 20 30 40 50 60 70 80 90 1.1
1.15 1.2 1.25 1.3 1.35 1.4 1.45 1.5 1.55
Time vs Relative Displacement - (CHI-CHI - TCU068) Point B - Pylon
Time (sec)
R
e
l.
D
is
p
la
c
e
m
e
n
t
(m
)
Uncontrolled Optimal Controlled
0 5 10 15 20 25 30
-5 -4.9 -4.8 -4.7 -4.6 -4.5 -4.4 -4.3 -4.2 -4.1 -4
Time vs Relative Displacement - (Cape Mendocino - Cape Mendocino) Point A - Girder
Time (sec)
R
e
l.
D
is
p
la
c
e
m
e
n
t
(m
)
Fig. 16. The relative nodal displacement at the top of the pylon (point A) for optimal controlled and ANN controlled structure
(Imperial Valley Earthquake – El Centro Differential Array)
Fig. 17. The relative nodal displacement at the middle of the girder bridge span (point A) for optimal controlled and ANN controlled
structure (Chi-Chi Earthquake – TCU068)
0 5 10 15 20 25 30 35 40
-4.9 -4.8 -4.7 -4.6 -4.5 -4.4 -4.3 -4.2 -4.1 -4 -3.9
Time vs Relative Displacement - (Imperial Valley - El Centro Differential Array) Point A - Girder
Time (sec)
R
e
l.
D
is
p
la
c
e
m
e
n
t
(m
)
Optimal Controlled ANN Controlled
0 10 20 30 40 50 60 70 80 90
-4.8 -4.7 -4.6 -4.5 -4.4 -4.3 -4.2 -4.1 -4
Time vs Relative Displacement - (CHI-CHI - TCU068) Point A - Girder
Time (sec)
R
e
l.
D
is
p
la
c
e
m
e
n
t
(m
)
Fig. 18. The relative nodal displacement at the top of the pylon (point B) for optimal controlled and ANN controlled structure (Cape
Mendocino Earthquake – Cape Mendocino)
Fig. 19. The relative nodal displacement at the top of the pylon (point B) for optimal controlled and ANN controlled structure (Imperial
Valley Earthquake – El Centro Differential Array)
0 5 10 15 20 25 30
1.1 1.15 1.2 1.25 1.3 1.35 1.4 1.45 1.5 1.55
Time vs Relative Displacement - (Cape Mendocino - Cape Mendocino) Point B - Pylon
Time (sec)
R
e
l.
D
is
p
la
c
e
m
e
n
t
(m
)
Optimal Controlled ANN Controlled
0 5 10 15 20 25 30 35 40
1.2 1.22 1.24 1.26 1.28 1.3 1.32 1.34 1.36 1.38 1.4
Time vs Relative Displacement - (Imperial Valley - El Centro Differential Array) Point B - Pylon
Time (sec)
R
e
l.
D
is
p
la
c
e
m
e
n
t
(m
)
Fig. 20. The relative nodal displacement at the top of the pylon (point B) for optimal controlled and ANN controlled structure (Chi-Chi
Earthquake – TCU068)
In the whole, it is clearly seen that the response using ANN algorithm is identical to the response calcualted using the classical optimal control algorithm where the difference between the two control methods is relatively very small.
The control forces alimented to the stucture are depicted in Figure 21 to Figure 26 for the actuators in the middle of the bridge span and on top of the pylon excited by Cape
Mendocino Earthquake–Mendocino, Imperial Valley Earthquake – El Centro Differential Array), and Chi-Chi Earthquake – TCU068.
Meanwhile, the control force required to control the bridge structure is relatively high in magnitude. The highest control force requirement is 80 kN for actuator number 1(Point A) and 23 kN for actuator number 13 (Point B).
Fig. 21. Control force for Actuator at the middle of bridge span (point A) for optimal controlled and ANN controlled structure (Cape Mendocino Earthquake – Cape Mendocino)
0 10 20 30 40 50 60 70 80 90
1.15 1.2 1.25 1.3 1.35 1.4
Time vs Relative Displacement - (CHI-CHI - TCU068) Point B - Pylon
Time (sec)
R
e
l.
D
is
p
la
c
e
m
e
n
t
(m
)
Optimal Controlled ANN Controlled
0 5 10 15 20 25 30
-100 -50 0 50 100
Time vs Control Force - (Cape Mendocino - Cape Mendocino) Actuator No.1
Time (sec)
F
o
rc
e
(
k
N
)
Fig. 22. Control force for Actuator at the top of the pylon for optimal controlled and ANN controlled structure (Cape Mendocino
Earthquake – Cape Mendocino)
Fig. 23. Control force for Actuator at the middle of bridge span (point A) for optimal controlled and ANN controlled structure (Imperial
Valley Earthquake – El Centro Differential Array)
0 5 10 15 20 25 30 -25
-20 -15 -10 -5 0 5 10 15 20 25
Time vs Control Force - (Cape Mendocino - Cape Mendocino) Actuator No.13
Time (sec)
F
o
rc
e
(
k
N
)
Optimal Controlled ANN Controlled
0 5 10 15 20 25 30 35 40 -100
-80 -60 -40 -20 0 20 40 60 80 100
Time vs Control Force - (Imperial Valley - El Centro Differential Array) Actuator No.1
Time (sec)
F
o
rc
e
(
k
N
)
Fig. 24. Control force for Actuator at the top of the pylon for optimal controlled and ANN controlled structure (Imperial Valley
Earthquake – El Centro Differential Array)
Fig. 25. Control force for Actuator at the middle of bridge span (point A) for optimal controlled and ANN controlled structure (Chi-Chi
Earthquake – TCU068)
0 5 10 15 20 25 30 35 40
-25 -20 -15 -10 -5 0 5 10 15 20 25
Time vs Control Force - (Imperial Valley - El Centro Differential Array) Actuator No.13
Time (sec)
F
o
rc
e
(
k
N
)
Optimal Controlled ANN Controlled
0 10 20 30 40 50 60 70 80 90
-150 -100 -50 0 50 100 150
Time vs Control Force - (CHI-CHI - TCU068) Actuator No.1
Time (sec)
F
o
rc
e
(
k
N
)
Optimal Controlled ANN Controlled
0 10 20 30 40 50 60 70 80 90
-25 -20 -15 -10 -5 0 5 10 15 20 25
Time vs Control Force - (CHI-CHI - TCU068) Actuator No.13
Time (sec)
F
o
rc
e
(
k
N
)
The following Tables 1-3 present the relative displacement comparison between the classical control and the ANN control methods. Again, it can clearly be seen that the effectiveness of the proposed methods applied in a large bridge structure can be highly appreciated.
Using linear optimal algorithm, the overall structure is showing a reduction of its response. For the deck, the
reduction quantity varies around 42-49% for vertical response in RMS value, while for the horizontal response of the pylons, the reduction varies around 42-49% in RMS value as well.
On the other hand, the ANN control algoritm, for the overall structure gives almost the same reduction level compared to those obtained from the classical optimal control. The level of structural response reduction is quite good as can be seen for all the earthquake excitations used in the study.
Table I
Relative displacement comparison (Cape Mendocino Earthquake – Cape Mendocino)
Table II
Relative displacement comparison (Imperial Valley Earthquake – El Centro Differential Array)
Table III
Relative displacement comparison (Chi-Chi Earthquake – TCU068)
8. CONCLUSION
The ANN control technique for controlling the seismic response of a large cable-stayed bridge structure subjected to earthquakes was described. Numerical simulations of the
benchmark bridge were carried out to evaluate the effectiveness of the system.
RMS Abs. Peak RMS Abs. Peak RMS Abs. Peak
A (Girder) 0.2412 0.5906 0.1386 0.4512 0.1393 0.4547
B (Pylon) 0.0637 0.1367 0.0369 0.1084 0.0371 0.1088
RMS Abs. Peak RMS Abs. Peak
A (Girder) 42.53% 23.60% 42.27% 23.01%
B (Pylon) 41.99% 20.66% 41.64% 20.39%
Node
Relative Displacement (m)
Uncontrolled Optimal Controlled ANN Controlled
Reduction (%)
Optimal Controlled ANN Controlled
Node
RMS Abs. Peak RMS Abs. Peak RMS Abs. Peak
A (Girder) 0.2322 0.5320 0.1162 0.3883 0.1203 0.3938
B (Pylon) 0.0613 0.1406 0.0311 0.0936 0.0322 0.0951
RMS Abs. Peak RMS Abs. Peak
A (Girder) 49.97% 27.01% 48.19% 25.97%
B (Pylon) 49.31% 33.41% 47.37% 32.39%
Node
Relative Displacement (m)
Uncontrolled Optimal Controlled ANN Controlled
Reduction (%)
Optimal Controlled ANN Controlled
Node
RMS Abs. Peak RMS Abs. Peak RMS Abs. Peak
A (Girder) 0.1478 0.5754 0.0746 0.4814 0.0741 0.4823
B (Pylon) 0.0390 0.1389 0.0199 0.1226 0.0198 0.1220
RMS Abs. Peak RMS Abs. Peak
A (Girder) 49.54% 16.35% 49.88% 16.19%
B (Pylon) 49.00% 11.72% 49.25% 12.16%
Node
Relative Displacement
Uncontrolled Optimal Controlled ANN Controlled
Reduction (%)
Optimal Controlled ANN Controlled
The study shows a good result in overall response reduction. The application of active mass dampers on a cable-stayed bridge structure could reduce the structure response under earthquake loadings effectively.
Furthermore, the ANN algorithm is also a suitable substitute for the optimal control algorithm to calculate the control force. By using the ANN algorithm, not only can the time delay be reduced significantly, the structure response can also be reduced in a very similar manner to the optimal control algorithm. The ANN algorithm ability to train itself has made the overall system be more adaptable and flexible to external loads as well as the structural changes. Thus, the ANN algorithm is feasible to be applied on other large scale structures where non-linearity is an important difficulty to be considered.
REFERENCES
[1] Andrej Krenker, Janez Bester, and Andrej Kos, “Introduction to the Artificial Neural Networks”, University of Ljubljans Slovenia.
[2] Arka P. Reksowardojo, Setio, H.D., “Active Control Application
on Cable-Stayed Bridge Structure Using Artificial Neural Network Algorithme”, The Second International. Conferrence and Built Environment, Bandung, 19 – 20 November 2013, pp. 245 – 256.
[3] Chang, C.C., Yang, H.T.W., “Control of Building Using Active
Tuned Mass Damper”, Journal of Engineering Mechanics, ASCE, 121(3), pp.355-366, 1995.
[4] Dorigo, M., Stutzle, T., “Ant Colony Optimization”, The MIT
Press. Cambridge, Massachusetss, and London, 2004.
[5] Dyke, S.J., Caicedo, J.M., Turan, G., Bergman, L.A. and Hague, S., “Phase I – Benchmark control problem for seismic response of cable-stayed bridges”. Journal of Structural Engineering, ASCE 129(7), 857-872, 2003.
[6] Gawronski, W. K., “Advanced Structural Dynamics and Active
Control of Structures”, Springer-Verlag New York, Inc., New York, 2004.
[7] Hrovat, D., Barak, P. and Rabins, M., “Semi-Active Versus
Passive or Active Tuned Mass Dampers for Structural Control”, Journal of Engineering Mechanics, Vol. 109, No. 3, May/June 1983, pp. 691-705,1983.
[8] Mostovik, “Vladivostok Bridge, Cable Stayed – Variant III Design
Review”, COWI A/S, Denmark, 2009.
[9] Sarangapani, J., “Neural Network Control of Nonlinear
Discrete-Time Systems”, CRC Press. New York, 2006.
[10] Setio, H. D., Primatama, A., “Artificial Neural Network And Its Application In Vibration Control of Structures”, The Latest Development of Civil Engineering (LDCE), February 25,Jakarta, 2015.
[11] Setio, S., Setio, H.D. and Jezequel, L., “Modal Analysis of
![Fig. 1. Representation of neural system [Sarangapani, J]](https://thumb-us.123doks.com/thumbv2/123dok_us/1353978.1644134/3.612.181.438.323.435/fig-representation-of-neural-system-sarangapani-j.webp)
![Fig. 2. Artificial Neural Network training process diagram [Setio]](https://thumb-us.123doks.com/thumbv2/123dok_us/1353978.1644134/4.612.116.408.224.384/fig-artificial-neural-network-training-process-diagram-setio.webp)
![Fig. 4. The Russky bridge structure model [Mostovik]](https://thumb-us.123doks.com/thumbv2/123dok_us/1353978.1644134/5.612.68.541.279.404/fig-the-russky-bridge-structure-model-mostovik.webp)
![Fig. 5. Structure model of bridge pylon [Mostovik]](https://thumb-us.123doks.com/thumbv2/123dok_us/1353978.1644134/6.612.167.442.417.526/fig-structure-model-bridge-pylon-mostovik.webp)