Volume 1, Issue 5, Pages 121-126, June 2017
© 2017 AJAST All rights reserved. www.ajast.net
Design a Reconfigurable Smart Sensor Interface for Industrial Wireless Sensor
Networks Stacks with Multi-Processor Support
A.Ahmed Meeran Mydeen
1, Dr.M.Anto Bennet
2, Kelwin Inasu
3, M.Venkatesh
4and C.Suthesh
51
Assistant Professor, Department of Electronics and Communication Engineering, Veltech, Avadi, Tamilnadu India. 2
Assistant Professor, Department of Electronics and Communication Engineering, Veltech, Avadi, Tamilnadu India. 3
UG Student, Department of Electronics and Communication Engineering, Veltech, Avadi, Tamilnadu India. 4
UG Student, Department of Electronics and Communication Engineering, Veltech, Avadi, Tamilnadu India. 5UG Student, Department of Electronics and Communication Engineering, Veltech, Avadi, Tamilnadu India.
Article Received: 18 May 2017 Article Accepted: 04 June 2017 Article Published: 07 June 2017
1. INTRODUCTION
Wireless Sensor Networks (WSN) have been employed to collect data about physical phenomena in various applications such as habitat monitoring, and ocean monitoring, and surveillance. As an emerging technology brought about rapid advances in modern wireless telecommunication, Internet of Things (IoT) has attracted a lot of attention and is expected to bring benefits to numerous application areas including industrial WSN systems, and healthcare systems manufacturing. WSN systems are well-suited for long-term industrial environmental data acquisition for IoT representation. Sensor interface device is essential for detecting various kinds of sensor data of industrial WSN in IoT environments. It enables us to acquire sensor data. Thus, we can better understand the outside environment information. However, in order to meet the requirements of long-term industrial environmental data acquisition in the IoT, the acquisition interface device can collect multiple sensor data at the same time, so that more accurate and diverse data information can be collected from industrial WSN. With rapid development of IoT, major manufacturers are dedicated to the research of multisensor acquisition interface equipment. There are a lot of data acquisitions multiple interface equipments with mature technologies on the market. But these interface devices are very specialized in working style, so they are not individually adaptable to the changing IoT environment. Meanwhile, these universal data acquisition interfaces are often restricted in physical properties of sensors (the connect number, sampling rate, and signal types). Now, micro control unit (MCU) is used as the core controller in mainstream data acquisition interface device. MCU has the advantage of low price and low power consumption, which makes it relatively easy to implement. But, it performs a task by way of interrupt, which makes these multisensor acquisition interfaces not really parallel in collecting multisensor data. On the other hand, FPGA/CPLD has unique hardware logic control, real-time performance, and
synchronicity, which enable it to achieve parallel acquisition of multisensor data and greatly improve real-time performance of the system. FPGA/CPLD has currently becomes more popular than MCU in multisensor data acquisition in IoT environment. However, in IoT environment, different industrial WSNs involve a lot of complex and diverse sensors. At the same time, each sensor has its own requirements for readout and different users have their own applications that require different types of sensors. It leads to the necessity of writing complex and cumbersome sensor driver code and data collection procedures for every sensor newly connected to interface device, which brings many challenges to the researches. Sensor data acquisition surface device is the key part of study on industrial WSN application. In order to standardize a wide range of intelligent sensor interfaces in the market and solve the compatibility problem of intelligent sensor, the IEEE Electronic Engineering Association has also launched IEEE1451 smart transducer (STIM) interface standard protocol suite for the future development of sensors. The protocol stipulates a series of specifications from sensor interface definition to the data acquisition.
But, the sensors with the protocol standard have a high cost and still lack popularity in industrial WSN in IoT environment. Nevertheless, at present examples of intelligent sensors available on the market and compliant with this standard are still limited. To solve these problems, some dedicated hardware interfaces based on the IEEE 1451 have been recently proposed, and they are capable of interfacing with different sensor typologies . These interface devices are usually based on relatively complex dedicated electronic board. It is obvious that such restriction should be released, and a reconfigurable multisensor data acquisition interface with good compatibility and normative interface standard needs to be developed in IoT environment. By focusing on the A B S T R A C T
In the work, to solve the existing problems, a new method is proposed to design a reconfigurable smart sensor interface for industrial WSN in IoT environment, in which peripheral interface component (PIC 16F877A) is adopted as the core controller. Thus, it can read data in serial and in real time with high speed on multiple different sensor data. The standard of intelligent sensor interface specification is adopted for this design. The work presents a system that can be used to monitor the water quality in industries. The temperature sensor is used to monitor the temperature of water. Humidity sensor used for measure the moisture level. PH sensor used to measure the PH content in the water. All sensors are connected on the microcontroller and the status of the sensors is send to the control section continuously. The data transmission is done by Zigbee. The received data is updated on the PC and the values of sensors are displayed on LCD and also the values are updated on internet.
Volume 1, Issue 5, Pages 121-126, June 2017
© 2017 AJAST All rights reserved. www.ajast.net
above issue, our work designs and realizes a reconfigurable smart sensor interface for industrial WSN in IoT environment. This design presents many advantages as described. Secondly, a new design method is proposed in this project for multisensor data acquisition interface that can realize plug and play for various kinds of sensors in IoT environment.
2. LITERATURE SURVEY
Water distribution systems present a significant challenge for structural monitoring. They comprise a complex network of pipelines buried underground that are relatively inaccessible. Maintaining the integrity of these networks is vital for providing clean drinking water to the general public. There is a need for in-situ, on-line monitoring of water distribution systems in order to facilitate efficient management and operation. In particular, it is important to detect and localize pipe failures soon after they occur, and pre-emptively identify „hotspots‟, or areas of the distribution network that are more likely to be susceptible to structural failure. These capabilities are vital for reducing the time taken to identify and repair failures and hence, mitigating impacts on water supply [1]. Defined as a way of tracking and addressing changes in the biophysical and social environment during project implementation, Environmental Impact Assessment follow-up also called Environmental Monitoring and Compliance is a legal requirement. According to Cameroonian EIA regulations, Environmental Management Plans elaborated during the Impact Assessment process, should be subject to administrative and technical surveillance as defined by article 27 of decree no 2013/0171/PM of 14th February 2013 (replacing decree no 2005/0577/PM of 23/02/2005) on the modalities for carrying out EIAs. In addition, the World Bank‟s 1988 Operational Directives on Environmental Guidelines requires periodic and annual EIA follow-up, while Article 20 of Operational Policy 4.01 outlines monitoring requirements for projects subjected to World Bank funding. Environmental Monitoring therefore helps mitigate and address all the foreseeable and unforeseeable environmental and social impacts of proposed projects thus closing the gap created by condition setting, predicted impacts and impacts that actually occur. In Cameroon, the methodology adopted for the realization of EIA follow-up differs on a case by case basis and from sector to sector. This paper seeks to present the methodology employed in EIA follow-up of some key Onshore Oil and Gas sector projects. The paper intends to draw from experience and lessons learnt during EIA follow-up, highlighting the specific day to day environmental performance indicators that enabled the gap between impact prediction during EIA and impact occurrence during EMP implementation and follow-up to be closed [2].
In order to reduce the costs of wind energy, it is necessary to improve the wind turbine availability and reduce the operational and maintenance costs. The reliability and availability of a functioning wind turbine depend largely on the protective properties of the lubrication oil for its drive train subassemblies such as the gearbox and means for lubrication oil condition monitoring and degradation detection. The wind industry currently uses lubrication oil analysis for detecting gearbox and bearing wear but cannot
detect the functional failures of the lubrication oils. The main purpose of lubrication oil condition monitoring and degradation detection is to determine whether the oils have deteriorated to such a degree that they no longer fulfill their functions. This paper describes a research on developing online lubrication oil condition monitoring and remaining useful life prediction using particle filtering technique and commercially available online sensors. It first introduces the lubrication oil condition monitoring and degradation detection for wind turbines. Viscosity and dielectric constant are selected as the performance parameters to model the degradation of lubricants. In particular, the lubricant performance evaluation and remaining useful life prediction of degraded lubrication oil with viscosity and dielectric constant data using particle filtering are presented. A simulation study based on lab verified models is provided to demonstrate the effectiveness of the developed technique [3]. Driven by population growth and the need for increased agricultural production, water resources are coming under intense pressure across Asia. Annual water withdrawal and return flows are higher than in any other region. The volume of wastewater generated annually, excluding agricultural drainage, is some 142 km3.1 Inadequate provision of sanitation facilities, sewerage and wastewater treatment results in significant quantities of this wastewater reaching water bodies that may service human consumption [4].The Chattooga River Watershed, located in NE Georgia, NW South Carolina, and SW North Carolina, contains some of the most scenic and valuable water resources in the region. The Chattooga River is designated as a wild and scenic river and serves as the headwaters for water supplied to numerous cities. The mix of public and private lands presents considerable challenges to addressing sources of stream degradation. The EPA has listed several streams in the Chattooga Watershed as being impaired by suspended sediment and has established Total Maximum Daily Loads (TMDLs) [5].The parameters involved in the water quality determination such as the pH level, turbidity and temperature is measured in the real time by the sensors that send the data to the base station or control/monitoring room. This paper proposes how such monitoring system can be setup emphasizing on the aspects of low cost, easy ad hoc installation and easy handling and maintenance. The use of wireless system for monitoring purpose will not only reduce the overall monitoring system cost in term of facilities setup and labor cost, but will also provide flexibility in term of distance or location. In this paper, the fundamental design and implementation of WSN featuring a high power transmission Zigbee based technology together with the IEEE 802.15.4 compatible transceiver is proposed. The developed platform is cost-effective and allows easy customization. Several preliminary results of measurement to evaluate the reliability and effectiveness of the system are also presented [6].
Volume 1, Issue 5, Pages 121-126, June 2017
© 2017 AJAST All rights reserved. www.ajast.net
monitoring system can be setup emphasizing on the aspects of low cost, easy ad hoc installation and easy handling and maintenance. The use of wireless system for monitoring purpose will not only reduce the overall monitoring system cost in term of facilities setup and labor cost, but will also provide flexibility in term of distance or location[7].We describe a method for using spatially referenced regressions of contaminant transport on watershed attributes (SPARROW) in regional water-quality assessment. The method is designed to reduce the problems of data interpretation caused by sparse sampling, network bias, and basin heterogeneity. The regression equation relates measured transport rates in streams to spatially referenced descriptors of pollution sources and land-surface and stream-channel characteristics. Regression models of total phosphorus (TP) and total nitrogen (TN) transport are constructed for a region defined as the non-tidal conterminous United States [8]. The emerging compressed sensing (CS) theory can significantly reduce the number of sampling points that directly corresponds to the volume of data collected, which means that part of the redundant data is never acquired. It makes it possible to create standalone and net-centric applications with fewer resources required in Internet of
Things (IoT). CS-based signal and information
acquisition/compression paradigm combines the nonlinear reconstruction algorithm and random sampling on a sparse basis that provides a promising approach to compress signal and data in information systems [9]. The use of wireless system for monitoring purpose will not only reduce the overall monitoring system cost in term of facilities setup and labor cost, but will also provide flexibility in term of distance or location. In this paper, the fundamental design and implementation of WSN featuring a high power transmission Zigbee based technology together with the IEEE 802.15.4 compatible transceiver is proposed. The developed platform is cost-effective and allows easy customization [10,11].
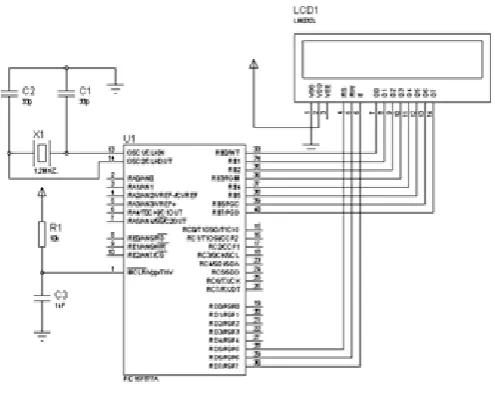
Figure 1: Block diagram of smart sensor interface for industrial WSN Environment
3. PROPOSED SYSTEM
The work proposes a system that can be used to monitor the water quality in industries. The temperature sensor is used to monitor the temperature of water. Humidity sensor used for measure the moisture level. PH sensor used to measure the PH content in the water. All sensors are connected on the microcontroller and the status of the sensors is send to the control section continuously. The data transmission is done by Zigbee. The received data is updated on the PC. Also the values are updated on internet. The values of sensors are displayed on LCD. The work presents a system that can be used to monitor the water quality in industries. The temperature sensor is used to monitor the temperature of water. Humidity sensor used for measure the moisture level. PH sensor used to measure the PH content in the water. All sensors are connected on the microcontroller and the status of the sensors is send to the control section continuously. The data transmission is done by Zigbee. The received data is updated on the PC. Also the values are updated on internet. The values of sensors are displayed on LCD.
Figure 2: Control Section
Power Supply for PIC Microcontroller
The Fig 1 shown above is the block diagram of smart sensor interface for industrial WSN Environment. It consists of several such as Humidity, Temperature, CO2 & pH Sensors,
LCD Display, ZIGBEE and PIC Microcontroller. The PIC Microcontroller is used to interface all the sensors and also used to store the data. The Temperature Sensor can be used to detect the high temperature. The Humidity Sensor detects air and sends the data to the microcontroller. The CO2 Sensor
Volume 1, Issue 5, Pages 121-126, June 2017
© 2017 AJAST All rights reserved. www.ajast.net
Figure 3 : Power supply
Discussion
Based on the results of a comprehensive assessment it was found that the greatest capacity required for implementation of the innovations by "Tretiy Park" is located in the area of financial and human resources. The emphasis should be done on these areas to form the planned innovation policy. Therefore, the innovation policy links all the policies and strategies of the enterprise and determines the location of each function implemented by the enterprise within the overall business. The role of the innovation policy in the innovation management lies in the innovative activity regulation and management. The innovation policy seems to be a core – a key unit in the development of the strategies of the enterprise at all levels of functional units. The financial strategy is one of the key components in the development of a comprehensive innovation strategy of the enterprise.
The power supply section is the important one. It should deliver constant output regulated power supply for successful working of the work. A 0-12V/1 mA transformer is used for this purpose. The primary of this transformer is connected in to main supply through on/off switch& fuse for protecting from overload and short circuit protection it is shown fig 4. The secondary is connected to the diodes to convert 12V AC to 12V DC voltage. And filtered by the capacitors, which is further regulated to +5v, by using IC 7805.
Temperature sensor
The fig 5 shows below of LM35 is an integrated circuit sensor that can be used to measure temperature with an electrical output proportional to the temperature (in oC).The LM35 generates a higher output voltage than thermocouples and may not require that the output voltage be amplified.
Figure 4: Pin diagram of LM35 Sensor
The Zigbee module acts as both transmitter and receiver. The Rx and Tx pins of ZIGBEE are connected to Tx and Rx of 8051 microcontroller respectively. The data‟s from microcontroller is serially transmitted to Zigbee module via UART port. Then Zigbee transmits the data to another Zigbee. The data‟s from Zigbee transmitted from Dout pin. The Zigbee from other side receives the data via Din pin shown in fig 6.
Figure 5: ZigBee platform
Fig 7 shows the beacon mode, a device watches out for the coordinator's beacon that gets transmitted at periodically, locks on and looks for messages addressed to it. If message transmission is complete, the coordinator dictates a schedule for the next beacon so that the device „goes to sleep'; in fact, the coordinator itself switches to sleep mode. While using the beacon mode, all the devices in a mesh network know when to communicate with each other. In this mode, necessarily, the timing circuits have to be quite accurate, or wake up sooner to be sure not to miss the beacon. This in turn means an increase in power consumption by the coordinator's receiver, entailing an optimal increase in costs.
Figure 6: Beacon Network Communication
Volume 1, Issue 5, Pages 121-126, June 2017
© 2017 AJAST All rights reserved. www.ajast.net
Figure 8: Simulation output
Fig 8 shown the non-beacon mode will be included in a system where devices are „asleep' nearly always, as in smoke detectors and burglar alarms. The devices wake up and confirm their continued presence in the network at random intervals. On detection of activity, the sensors „spring to attention', as it were, and transmit to the ever-waiting coordinator's receiver (since it is mains-powered). However, there is the remotest of chances that a sensor finds the channel busy, in which case the receiver unfortunately would „miss a call'.
4. EXPERIMENTAL RESULT
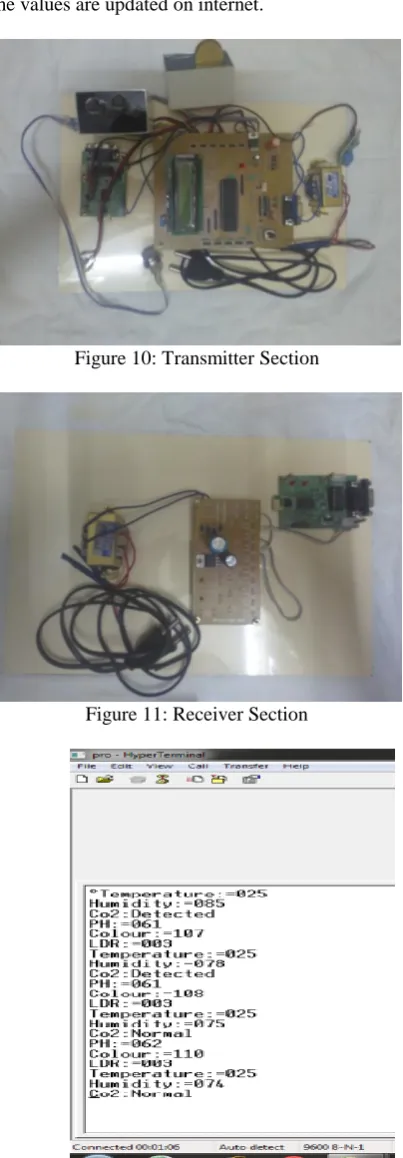
A sensor interface device is essential for sensor data collection of industrial wireless sensor networks (WSN) in IoT environments. Thus, it can read data in serial and in real time with high speed on multiple different sensor data shown in fig 9&10. In fig11, Transmitter section is a system that can be used to monitor the water quality in industries.
Figure 9: Proteus Simulation Output
The temperature sensor is used to monitor the temperature of water. Humidity sensor used for measure the moisture level. PH sensor used to measure the PH content in the water. All sensors are connected on the microcontroller and the status of the sensors is send to the control section continuously. The data transmission is done by Zigbee. The data reception is done by Zigbee shown in fig12. The received data is updated on the PC and the values of sensors are displayed on LCD and also the values are updated on internet.
Figure 10: Transmitter Section
Figure 11: Receiver Section
Volume 1, Issue 5, Pages 121-126, June 2017
© 2017 AJAST All rights reserved. www.ajast.net
5. CONCLUSION
The work describes a reconfigurable smart sensor interface for industrial WSN in IoT environment. The system can collect sensor data intelligently. It was designed based on IEEE1451 protocol by combining with PIC and the application of wireless communication. It is very suitable for real-time and effective requirements of the high-speed data acquisition system in IoT environment. The application of PIC greatly simplifies the design of peripheral circuit, and makes the whole system more flexible and extensible.
REFERENCES
[1] S. Li, L. Xu, X. Wang, and J. Wang, 2012, vol. 6, no. 2, pp. 165–187, “Sensor Networks For Monitoring And Control Of water distribution system” Enterp. Inf. Syst.
[2] Q. Li, Z. Wang, W. Li, J. Li, C. Wang, and R. Du, , 2013, vol. 7, no. 3, pp. 237–271, “Environmental Monitoring and Compliance Methodology” Enterp. Inf. Syst.
[3] L. Wang, L. D. Xu, Z. Bi, and Y. Xu, Feb. 2014, vol. 10, no. 1, pp. 408–418,“ Lubrication Oil Condition Monitoring and Remaining Useful Life Prediction with Particle Filtering” IEEE Trans. Ind. information.
[4] Y. Fan, Y. Yin, L. Xu, Y. Zeng, and F. Wu, 2014, vol. 10, no. 2, pp. 1568–1577, “Water pollution in Asia: The urgent need for prevention and monitoring,” IEEE Trans. Ind. Information.
[5] AntoBennet, M, Resmi R. Nair, Mahalakshmi V, Janakiraman G “Performance and Analysis of Ground-Glass Pattern Detection in Lung Disease based on High-Resolution Computed Tomography”, Indian Journal of Science and
Technology, Volume 09 (Issue 02):01-07, January 2016.
[6] AntoBennet, M, Sankaranarayanan S, Ashokram S, Dinesh Kumar T R, “Testing of Error Containment Capability in can Network”, International Journal of Applied Engineering Research, Volume 9, Number 19 (2014) pp. 6045-6054.
[7] L. Xu, 2013, vol. 30, no. 3, pp. 211–213, “ Water Quality Monitoring System Using Zigbee Based Wireless Sensor Network,” Syst. Res. Behav. Sci.
[8] Z. Pang et al. 2013, pp. 529–534, “Regional interpretation of water-quality monitoring data,” in Proc. IEEE 15th Int. Conf. Adv. Commun. Technol. (ICACT).
[9] Z. Pang et al. 2013, “An RTOS-based architecture for industrial wireless sensor network stacks with multi-processor support,” in Proc. Ind. Technol. (ICIT). , pp. 1216–1221.
[10]F. Ciancetta et al. May 2007, vol. 7, no. 5, pp. 882–889, “Plug-n-play smart sensor based on web service,” IEEE Sensors J.
[11] Hameed, A.H., Mostafa, S.A. and Mohammed, M.A., 2013. Simulation and evaluation of WIMAX handover over homogeneous and heterogeneous networks. American