Abstract—In 1999, Typhoon 9918 struck Kyushu Island, which is located in Western Japan. Due to the storm surge and wind waves, the typhoon caused enormous damage to maritime structures. In this paper, the Improved Central Pressure Method is used to estimate the number of damage cases of damaged maritime structures along the coast caused by Typhoon 9918. Based on 74 previous typhoons, the Improved Central Pressure Method creates an index that determines the vulnerability of the coast to a typhoon with a specified path. This index is estimated using the path of Typhoon 9918 as determined from the location and the direction of the typhoon at a latitude of 30° N. The vulnerability index of maritime structures is calculated based on the path of the typhoon and coastline. The number of damage cases is estimated using the vulnerability index and the central pressure of the typhoon at a latitude of 30° N. Based on the results, the Central Pressure Method can be used to estimate the damage level of maritime structures that will occur along the coast before a typhoon strikes.
Index Terms—Central pressure method, damage level, typhoon, vulnerability.
I. INTRODUCTION
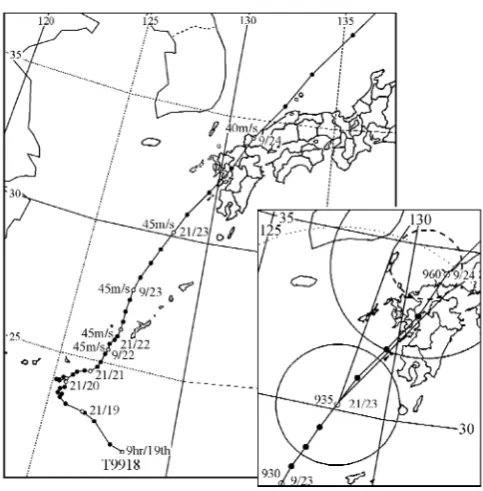
As shown in Fig. 1, Typhoon 9918 struck Kyushu Island, which is located in Western Japan. The inset in Fig. 1 shows the storm area where the wind speed exceeded 25 m/s as forecasted by the JMA. The dotted circle in the inset shows the area where the wind speed exceeded 15 m/s. The long-dash circle is the 70% probability circle for the location of the center of Typhoon 9918 at 09:00 on 24th September, 1999. An anomalous storm surge was induced in the closed sea of the western region of Kyushu Island (Fig. 2) by Typhoon 9918. The maximum anomaly was estimated to be about 3 m at the northern part of the west coast of Yatsushiro Sea [1]. The maximum sea level was equivalent to about 2.2 m above Highest High Water Level (H.H.W.L).
The damage due to the storm surges and wind waves caused by Typhoon 9918 was reported by the government of Kumamoto Prefecture. A total of 16 people were killed, 62772 houses were damaged or destroyed and 1883 houses were flooded.
Manuscript received February 10, 2012; revised February 29, 2012. R. Hashimura is with Department of EcoDesign, Sojo University, Kumamoto, Kumamoto Prefecture 860-0082, Japan (e-mail: ryusuke@ eco.sojo-u.ac.jp).
K. Takikawa is with Research and Education Center of Coastal Environmental Science, Kumamoto University, Kumamoto, Kumamoto Prefecture 860-8555, Japan (e-mail: taki2328`kumamoto-u.ac.jp).
The significant storm surge due to Typhoon 9918 caused extensive flooding. In the northern part of the western coast of Yatsushiro Sea, 12 people were killed by the storm surge. The actual total number of damaged maritime structures cases facing the west coast of Yatsushiro Sea, denoted by N, is 87. This is the largest number of damage cases in at least the last 50 years.
The damage of structures means breaching of dikes, cracking of seawalls, overturning of breakwaters, shift of breakwaters, removal of rubble from groins, etc.
The number of damage cases is the sum of the cases of damage of structures in each coastline for each typhoon. If the same seawall is damaged at two points along the coastline, it is counted as two damage cases.
In this paper, the number of damaged maritime structures attributed to Typhoon 9918 was estimated using the Improved Central Pressure Method. The Improved Central Pressure Method uses a vulnerability index for the given coast and typhoon passage [2], [3]. This index is based on the damage caused by 74 typhoons in the past 25 years. The number of damage cases is estimated based on the path of Typhoon 9918 as determined from the typhoon’s location and direction of movement at latitude of 30° N.
Fig. 1. Track of Typhoon 9918 along with its probability circles as given by the Japan Meteorological Agency (JMA). The wind speed is in m/s, and the date is given as hours/day. In the inset, the pressure in hPa is given instead of
the wind speed.
Using the Improved CP Method to Forecast Damage Level
of Maritime Structures Caused by Typhoon 9918
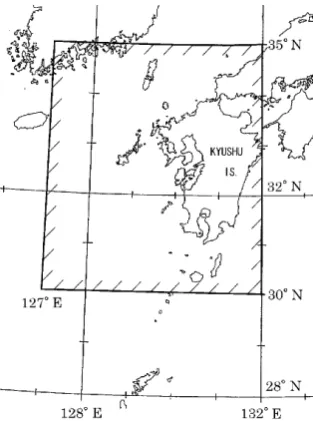
Fig. 2. The 4 coastal regions located in Kumamoto Prefecture.
The vulnerability index of maritime structures at the coast is given from the path and the coast. The damage level, which is shown by the number of damage cases, is estimated using the vulnerability index and the central pressure of the typhoon at latitude of 30° N. Similar estimations have been done for each of the other paths.
II. OUTLINE OF TYPHOON 9918
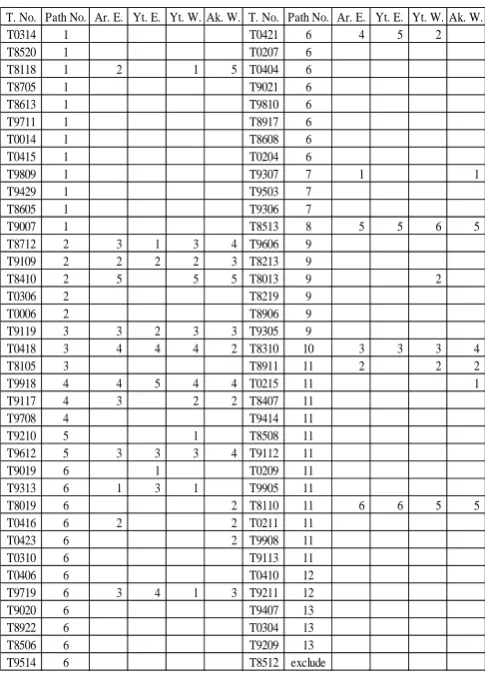
The 74 typhoons, which passed through an area delineated by a latitude of 30° and 35° N and a longitude of 127° and 132° E between 1980 and 1994, were divided into 13 groups based on their paths (Fig. 3, Fig. 4) [4].
Fig. 3. Surrounded area including Kyushu Island
Fig. 4. Historical typhoon paths
The path of Typhoon 9918 is shown in Fig. 1. The longitude of the typhoon’s position at latitude of 30° N was 128.3° E. The direction of progress was 22.5° clockwise from north. Therefore, Typhoon 9918 can be classified as a No. 4 Typhoon based on the classification shown in Fig. 4. The classification is based on latitude of 30° N, since at this point the typhoon’s direction of movement is roughly fixed and the scale becomes stable.
III. ESTIMATION OF THE SMOOTHED NUMBER OF DAMAGE CASES USING THE IMPROVED CENTRAL PRESSURE METHOD
The number of damage cases for each coast is defined as the number of maritime structures damaged by each typhoon, which can be given by (1)
Ns = (Nd/Nt) × 100 (1) where Ns is the smoothed number of damage cases, Nd is the number of damage cases caused by each typhoon for each coast, and Nt is the total number of damage cases by all typhoons for this particular coast. The smoothed number of damage cases indicates the contribution to the total damage cases for the coast by each typhoon.
The smoothed number of damage cases is expected to increase rapidly with an increase in the maximum wind speed [4]. This trend can be expressed by (2).
Ns = exp [{(Vmax – m)} ln8/10] (2) where Vmax is the maximum wind speed near the typhoon centre, Ns is the smoothed number of damage cases. The values of m for lines in Fig. 5 are 17, 25, 29, 33, 37, 41, and 44 m/s.
Equation (3) is deduced from the relationship between the maximum wind speed near the center and the central pressure, P, of the 74 typhoons,
Fig. 5. Central pressure and smoothed number of damage cases
From the relation of the maximum wind speed near the center and the central pressure of 74 typhoons at a latitude of 30˚ N, (4) can expressed by substituting (3) into (2). Ns=exp[{(-2.932×10⁻³P2+5.209518P
-2262.334518-m) ln8}/10] (4) where P is the central pressure of the typhoon [5], [6].
The horizontal axis in Fig. 5 shows central pressure of the typhoon at latitude of 30° N. The vertical axis shows the smoothed number of damage cases. The symbols represent the different coasts. The lines a to g in Fig. 5 show the theoretical values predicted using (4), with the values of m varying from 44 to 17. The numerical values, 1 to 6, shown outside of the figure, denote the six areas delineated by the lines b to f.
Table I shows the number of areas in which the plotted point is located. When no damage occurs, the number is not shown. The number given in Table II is termed the “sensitivity value” for central pressure of typhoon based on the number of damage cases. The sensitivity value indicates the vulnerability of the coast to the individual typhoon paths. It should be noted that a typhoon with the largest smoothed number of damage cases at the coast does not always have the largest sensitivity value. For example, Yatsushiro western coast is easily damaged by the typhoons in paths No. 2, 8, and 11, but is not weak for the typhoons in the paths No. 7, 12, and 13.
Table II shows the maximum sensitivity value for each path at the individual coasts. This table indicates the vulnerability index for an individual typhoon path at each coast.
IV. THE APPLICATION OF THE PATHS TO TYPHOON 9918 The central pressure of typhoon 9918 was 935 hPa at a latitude of 30° N. Based on Table 2, the maximum sensitivity value for the western coast of Yatsushiro Sea for path No. 4 is 4. From Fig. 4, it can be seen that Region 4 is located between lines d and e. Thus, the smoothed number of damage cases, Ns, is obtained from (4) for the sensitivity value of 4 and the central pressure of typhoon, 935 hPa. The maximum smoothed number of damage cases, Ns, is 29.9, which is
obtained by substituting m = 29 for line e. Similarly, the minimum smoothed number of damage cases, Ns, is 13.0, which was obtained by substituting m = 33 for line d. Therefore, the range for the smoothed number of damage cases along the western coast of Yatsushiro Sea for Typhoon 9918 lies between 13.0 and 29.9
TABLE I: SENSITIVITY VALUES FOR PARTICLES PATHS OF TYPHOON
TABLE II: MAXIMUM SENSITIVITY VALUES FOR THE SMOOTHED NUMBER OF DAMAGE CASES
The total number of damage cases along the western coast of Yatsushiro Sea during the 25 years from 1980 to 2004 was N = 307. The number of damage cases for Typhoon 9918 is estimated to be from 13.0% to 29.9% of 307, that is, from 40 to 92. The estimated number of damage cases closely adhere to the actual number of damage cases (N = 87). This fact proves that the Improved Central Pressure method is a usable theory.
On the other hand, comparing the track of Typhoon 9918, shown in Figs. 1 with the 13 tracks given in Fig. 4, the path of Typhoon 9918 is considered to be similar to the paths No. 3, 4, 5, 6, 7, or 8. In this paper, the number of damage cases for paths No. 3 to 8 is discussed.
Based on Table 2, the maximum sensitivity value along the western coast of Yatsushiro Sea for path No. 3 is 4. Thus, the result is the same as assuming a No.4 case. Therefore, the estimated number is from 40 to 92.
T. No. Path No. Ar. E. Yt. E. Yt. W. Ak. W. T. No. Path No. Ar. E. Yt. E. Yt. W. Ak. W.
T0314 1 T0421 6 4 5 2
T8520 1 T0207 6
T8118 1 2 1 5 T0404 6
T8705 1 T9021 6
T8613 1 T9810 6
T9711 1 T8917 6
T0014 1 T8608 6
T0415 1 T0204 6
T9809 1 T9307 7 1 1
T9429 1 T9503 7
T8605 1 T9306 7
T9007 1 T8513 8 5 5 6 5
T8712 2 3 1 3 4 T9606 9 T9109 2 2 2 2 3 T8213 9
T8410 2 5 5 5 T8013 9 2
T0306 2 T8219 9
T0006 2 T8906 9
T9119 3 3 2 3 3 T9305 9
T0418 3 4 4 4 2 T8310 10 3 3 3 4
T8105 3 T8911 11 2 2 2
T9918 4 4 5 4 4 T0215 11 1
T9117 4 3 2 2 T8407 11
T9708 4 T9414 11
T9210 5 1 T8508 11
T9612 5 3 3 3 4 T9112 11
T9019 6 1 T0209 11
T9313 6 1 3 1 T9905 11
T8019 6 2 T8110 11 6 6 5 5
T0416 6 2 2 T0211 11
T0423 6 2 T9908 11
T0310 6 T9113 11
T0406 6 T0410 12
T9719 6 3 4 1 3 T9211 12
T9020 6 T9407 13
T8922 6 T0304 13
T8506 6 T9209 13
T9514 6 T8512 exclude
Path No. 1 2 3 4 5 6 7 8 9 10 11 12 13 Ar. E. Close d 2 5 4 4 3 4 1 5 0 3 6 0 0
Yt. E. Close d 0 2 4 5 3 5 0 5 0 3 6 0 0
Yt. W. Close d 1 5 4 4 3 2 0 6 2 3 5 0 0
Based on Table II, the maximum sensitivity value along the western coast of Yatsushiro Sea for path No. 5 is 3. Performing a similar calculation yields the range for the number of damage cases for Typhoon 9918 as 5.7% to 13.0% of 307, that is, from 17 to 40. These values are a little smaller than the actual number (L = 87). Thus, the maximum sensitivity value for path No. 6 is 2. The maximum sensitivity value for path No. 7 is 0.
Based on Table 2, the maximum sensitivity value along the western coast of Yatsushiro Sea for path No. 8 is 6. The smoothed number of damage cases, Ns, is obtained from (4) for the sensitivity value 6 and the central pressure of typhoon, 935 hPa. The minimum smoothed number of damage cases is 68.6, which is obtained by substituting m = 25 for line f. Thus, the minimum number of damage cases for Typhoon 9918 is estimated to be 68.6% of 307, that is, 211. This number is large compared with the actual number (N = 87). This means that the western coast of Yatsushiro Sea is a more vulnerable to path No. 8.
V. DISCUSSION
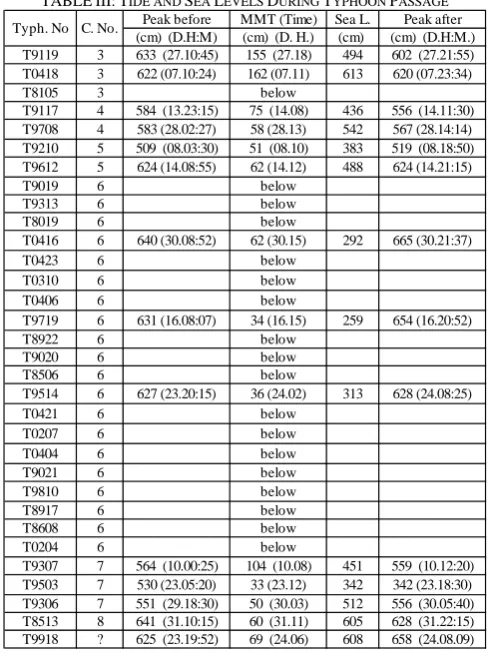
The application of paths No. 3, 4, 5, 6, 7, and 8 to Typhoon 9918 shows that the estimated values of the number of damage cases of maritime structures along the western coast of Yatsushiro Sea differ greatly. It is shown that the estimated damage level along the western coast of Yatsushiro Sea is largely affected by the changes in the path of the typhoon. Table III shows the maximum meteorological tide and the sea level due to the typhoons following paths No. 3 to 8, and the tide due to Typhoon 9918 based on data from the Misumi tide station (Fig. 2).
Under normal circumstances, the maximum meteorological tide does not occur at the same time as the maximum astronomical tide. The third column (Peak before) in Table 3 indicates the peak sea level and the time (day, hour, and minute) when the maximum astronomical tide occurred prior to the maximum meteorological tide. The fourth column (MMT) indicates the maximum meteorological tide and the time (day and hour). The fifth column (Sea L.) is the sea level when the maximum meteorological tide occurred. The sixth column (Peak after) indicates the peak sea level and the time (day, hour, and minute) when the maximum astronomical tide occurred subsequent to the maximum meteorological tide. In Table III, “below” is used to indicate that the maximum meteorological tide value was below 30 cm.
Fig. 6. Example of tidal elevation of Typhoon 9119 at Misumi tide station.
TABLE III: TIDE AND SEA LEVELS DURING TYPHOON PASSAGE Peak before MMT (Time) Sea L. Peak after (cm) (D.H:M) (cm) (D. H.) (cm) (cm) (D.H:M.) T9119 3 633 (27.10:45) 155 (27.18) 494 602 (27.21:55)
T0418 3 622 (07.10:24) 162 (07.11) 613 620 (07.23:34)
T8105 3 below
T9117 4 584 (13.23:15) 75 (14.08) 436 556 (14.11:30)
T9708 4 583 (28.02:27) 58 (28.13) 542 567 (28.14:14)
T9210 5 509 (08.03:30) 51 (08.10) 383 519 (08.18:50)
T9612 5 624 (14.08:55) 62 (14.12) 488 624 (14.21:15)
T9019 6 below
T9313 6 below
T8019 6 below
T0416 6 640 (30.08:52) 62 (30.15) 292 665 (30.21:37)
T0423 6 below
T0310 6 below
T0406 6 below
T9719 6 631 (16.08:07) 34 (16.15) 259 654 (16.20:52)
T8922 6 below
T9020 6 below
T8506 6 below
T9514 6 627 (23.20:15) 36 (24.02) 313 628 (24.08:25)
T0421 6 below
T0207 6 below
T0404 6 below
T9021 6 below
T9810 6 below
T8917 6 below
T8608 6 below
T0204 6 below
T9307 7 564 (10.00:25) 104 (10.08) 451 559 (10.12:20)
T9503 7 530 (23.05:20) 33 (23.12) 342 342 (23.18:30)
T9306 7 551 (29.18:30) 50 (30.03) 512 556 (30.05:40) T8513 8 641 (31.10:15) 60 (31.11) 605 628 (31.22:15) T9918 ? 625 (23.19:52) 69 (24.06) 608 658 (24.08.09) Typh. No C. No.
For Typhoon 9117, which followed path No. 4, the maximum meteorological tide occurred 3.5 hours before the second maximum astronomical tide. The sea level at this time was rather low, 436 cm. Thus, it can be assumed that the damage caused by Typhoon 9117 was not due to the storm surge. There is no other typhoon that followed path No. 4. For Typhoon 9918, although the maximum meteorological tide occurred 2 hours before the second maximum astronomical tide, the sea level was rather high, 608 cm. For this reason, when using path No. 4 conditions, the estimated number of damage cases is a small compared to the actual number (N = 87).
For Typhoon 9119, which followed path No. 3, the maximum meteorological tide was 155 cm, which is the largest value between 1945 and 1994. However, it occurred 1 hour after the time of the minimum astronomical tide, while the sea level at the maximum meteorological tide was low at 494 cm, which is shown in Fig. 6. For this reason, when using path No. 3 conditions, the estimated number of damage cases is smaller than the actual number.
For Typhoon 0418, which followed path No. 3, the maximum meteorological tide was 162 cm, which is the largest value between 1945 and 2004. The sea level at this time was 613 cm, which was the highest sea level at the time when the maximum meteorological tide occurred. Thus, it can be assumed that the damage caused by Typhoon 0418 was due to the severe storm surge. For this reason, when using path No. 3 conditions for Typhoon 0418, the estimated number of damage cases is roughly similar to the actual number.
Typhoon 9918 and 613 cm for Typhoon 0418) [6]. Therefore, the estimated number of damage cases is similar to the actual number of damage cases. The maximum sensitivity value of Typhoon 0418 for path No. 3 for the western coast of Yatsushiro Sea is 4. This value is the same as the maximum sensitivity value of 4 for path No. 4 of Typhoon 9918.
The storm surge is small for typhoons that follow paths No. 5, 6, and 7. For this reason, when using paths No. 5, 6, or 7 conditions, the estimated number of damage cases is very small compared to the actual number.
The sea level at the maximum storm surge induced by Typhoon 8513, which followed path No. 8, was high, 605 cm. The maritime structures along the western coast of Yasushiro Sea suffered serious damage caused by the storm surge and the wind waves during high tide. For this reason, when using path No. 8 conditions, the estimated minimum number of damage cases (N = 211) is a larger than the actual number (N = 87).
In fact, for both Typhoons 8513 and 9918, the sea level at the maximum meteorological tide was high (608 cm for Typhoon 9918 and 605 cm for Typhoon 8513). However, the estimated number of damage cases is 2.5 times larger than the actual number of damage cases.
The maximum sensitivity value of Typhoon 8513 for path No. 8 for the western coast of Yatsushiro Sea is 6. This value is large compared with the value of 4 for path No. 4. These facts show that the western coast is vulnerable to the typhoon path of No.8. At latitude of 30° N, the central pressure of Typhoon 8513 for path No. 8 was 960 hPa, Typhoon 9918 for path No.4 was 935 hPa, and Typhoon 0418 for path No. 3 was 940 hPa. The reason is that the real path of Typhoon 9918 was different from the path of Typhoon 8513, which followed path No. 8.
VI. CONCLUSIONS
In 1999, Typhoon 9918 struck Kyushu Island, which is in the western part of Japan, causing enormous damage to maritime structures. The number of damage cases to maritime structures caused by Typhoon 9918 was estimated using the Improved Central Pressure Method and compared with the actual number of damage cases. When path No. 4 conditions, which were determined by the position and the direction of the typhoon at latitude of 30° N were applied, the estimated number was a similar to the actual number. Compared to the actual number, the estimated number of damage cases for path No. 3 conditions was the same as for path No. 4; for path No. 5 condition the estimated number was much smaller, while for path No. 8 conditions it was
much larger than the actual number. This can be explained by noting that, except for path No. 5 typhoon, serious storm surges were observed for paths No. 3, 4, and 8 typhoons. This paper shows that the western coast of Yatsushiro Sea for path No.8 is the most vulnerable coastal area.
The Improved Central Pressure method can be used to estimate the damage level of maritime structures that will occur along the coast before a typhoon strikes. The forecasting method reported here will be used for the purpose of coastal zone management in disaster prevention works. Further, it is useful for information for storm warning and evacuation for residents along the coastlines.
ACKNOWLEDGMENT
I would like to thank emeritus Professor T. Sakai of Kyoto University for his useful advice. I am also grateful to the staff of all the public offices of the prefectures, cities, towns and land divisions located in Kumamoto and Nagasaki Prefecture who provided data and to the members of the Nagasaki Marine Observatory and the Kumamoto Meteorological Observatory for their cooperation.
This research is supported by Grant-in-Aid for Science Research (C) No.17510135 from the Ministry of Education, Culture, Sports, Science and Technology of Japan.
REFERENCES
[1] K. Takikawa and Y. Tabuchi, “Characteristics of storm surge and sea waves due to Typhoon 9918 in the Shiranui-Sea,” in Proceedings of Coastal Engineering, JSCE, Vol. 47(1), pp. 291-295 (in Japanese), 2000.
[2] R. Hashimura and K. Takikawa, “Using the improved central pressure method to forecast damage caused by typhoons,” in International Journal of Environmental Science and Development (IJESD), Vol. 2, No. 2, April pp. 146~151, 2011.
[3] R. Hashimura and K. Takikawa, “Forecasting of damage level of maritime structures caused by Typhoon 9918 based on improved CP method,” in Proc. of 2012 3rd International Conference on Environmental Science and Development (ICESD), Hong Kong, CD-ROM, Jan. pp. 276~282, 2012.
[4] R. Hashimura, “A study of forecasting method on damage level of maritime structures caused by typhoons,” in Proceedings of the 5th International Conference on Hydro-Science and Engineering, Warsaw, Poland, IAHR, pp.1-9, 2002.
[5] R. Hashimura, “Forecasting of damage of maritime structures caused by typhoons base on improved MWS method,” in Proc. of the 12nd Conference of International Association for Computer Methods and Advances in Geomechanics (IACMAG), Goa, India, CD-ROM, Oct. pp. 2992~2997, 2008.