Micro structural parameters of Silver Nano particles using
whole pattern fitting technique
Mahesh S S1, Prashanth K S2, Ananda S3, Nanda Prakash4, R.Somashekar5
Professor, Department of Physics, Acharya Institute of Technology, Bangalore 560 090,India 1
Assistant Professor, Department of Physics, New Horizon College of Engineering, Bangalore, India2
Department of Physics, Sapthagiri College of Engineering, Bangalore 560 090, India3
Research Scholar, Department of Studies in Physics, University of Mysore, Manasagangotri 4
Professor, Department of Studies in Physics, University of Mysore, Manasagangotri,
Mysore 570 006, Karnataka, India5
Abstract- Silver Nano particles are synthesized by Conventional method of biosynthesis of silver nano particles using extract of Parthenium hysterophorus. The synthesized Nano particles were subjected to XRD and SEM analysis for the characterization process for estimating the size of crystalline particle and figure out the morphology. The as-prepared powders are all nano-sized ( nm) and the same is confirmed by broadening of the X-ray diffraction peaks and Scanning electron microscopy. XRD results show that Crystallite area decreases with increasing concentration. The crystallite size (<N>), lattice strain (g in %), stacking faults (αd) and twin faults (β) determined by whole powder pattern fitting technique, developed by us.We have studied the microcrystalline parameters from XRD. Activation energy has been computed for these systems.
Key Words: Stacking and Twin faults, Micro structural parameters, WAXS,
INTRODUCTION
The systems being designed and produced at incredibly small scale of atoms and molecules.
This field of science has made its place in production of nanomaterials which are regarded as „ first generation‟ products, that includes nanoparticles, nanocrystals, nanobiomotors, nanowires, quantum dots
etc. The worldwide emergence of nanoscale sciences and engineering was marked by the announcement
of the National Nanotechnology Initiative (NNI) in Jan 2000 [1]. Nanomaterials are the leading edge
because of their unique properties which has enabled the technology to acquire the superiority in the
applied fields and made it indispensible in areas of human activity [2]. A decade ago,nanoparticles were
studies because of their size-dependent physical and chemical properties[3]. Now they have entered a
commercial exploration period [4,5] With the development, nanomaterial level is now the most advanced
ISSN (Online) 2347-3207
at least one dimension of 100 namometers or less. These novel materials are increasingly used for
commercial products, including developing new designs for medicinal applications[6].
Metal nanoparticals such as gold and silver have been recognized to be important in the fields
of chemistry, physics and biology. These particles are being processed for various purposes because of
their remarkable properties such as conductivity, biocompatibility, optical, photothermal, magnetic,
catalytic properties and also antimicrobial activity. The size and size distribution of the particles is
extremely a critical condition to be considered. Other physiochemical factors which are also important
are shape, morphology, charge, area, reactivity and chemical surroundings [7-13].Synthesis of Ag
nanoparticles can be achieved by chemical routes[14], or by means like sol-process, sol-gel process,
pyrolysis[15], chemical vapour deposition, gas condensation, co- condensation[16],thermal
decomposition, radiation assisted, microwave radiation assisted process or by bio-based protocols using
either microbial or plant extract. In the process of synthesis, aqueous solution of silver nitrate is reduced
to silver nanoparticles by the reducing agent used in the corresponding method adopted. Some of the
chemicals used by researches are citric acid [17], trisodium citrate [18], borohyride[19], DAPHP[7],
ethanol[20] for the purpose of reduction. Although chemical method is the simple one [14] the use of
environmentally benign materials like certain plant extracts, bacteria or fungi for the synthesis offers
numerous benefits of eco-friendliness, cost-effectiveness and compatibility. And since chemical synthesis
would often lead to presence of remains of toxic chemical species absorbed on the surface biological
method would be preferred. Different strains of microorganisms used are Fusarium oxyspores, Bascillus
subtillis[21], yet this still remains tedious due to the fact that microbial source always need to be handled
with lot of care due to high chances of contamination. With all this, the development of green synthesis is
now evolving into an important branch where plant extract is used. Bio-inspired synthesis offers several
other advantages like elimination of high pressure and energy as well. We have used Parthenium
hysterophorus. This plant is an obnoxious weed which is popularly called as Congress weed. This was
introduced in India in 1956 and spread over most part of the country [22]. It is known for causing skin
itching just by touch for which its considered regardless. We have worked to get the best out of this
undesirable weed, for synthesis of silver nanoparticles. On reduction silver ions present in aqueous
solution of silver complex in Parthenium extract can be demonstrated with the change in colour which is
MATERIALS AND METHODS
A.Prepation of plant extract
25g of fresh Parthenium hysterophorus leaves collected from campus of PESIT were thoroughly washed,
cut into fine pieces and boiled in 100ml millipore water for 10 minute broth was filtered using
Whatman‟s filter paper and filter was used as reducing agent to reduce silver
.
B.
Synthesis of silver nanoparticlesConventional method of biosynthesis of silver nanoparticles using extract of Parthenium hysterophorus
1mM silver nitrate solution was prepared by dissolving 0.16g of AgNO3 n 1000ml millipore
water. Extract added to silver nitrate in the ratio 1:5 and the mixture is incubated under dark conditions at
room temperature for 5 days facilitating the formation of silver nanoparticles
.
Rapid method of biosynthesis of silver nanoparticles using extract of Parthenium hysterophorus
Extract treated with 1mM AgNO3 in the ratio 1:5, the reaction mixture was subjected to
several short burst of microwave irradiation in a cyclic mode. A cycle constituting 15sec exposure to
microwave radiation and 20sec of non-exposure to prevent over heating as well as aggregation of metals.
The reaction mixture was monitored by sampling of aliquot(1ml) of solution after 5,7,9,12 and 15 cycles.
Suspension is centrifuged at a speed of 1000rpm for 30 min and pellet was collected. Wash the pellet
thoroughly and dried in a hot air oven.
C.
UV-Vis Spectrophotometric analysisChange in color of reaction mixture from yellow to reddish brown is an indication of silver nanoparticle
formation. The bio reduction of silver ions is monitored using UV Vis 1601 Shimadzu
Spectrophotometer. 1ml of sample aliquot diluted with millipore water and subjected to
spectrophotometry as function of reaction time with millipore water as reference.
D.The X-ray diffraction pattern
X-ray diffraction pattern of silver Nano particles were recorded on Rigaku Miniflex II
Diffractometer with Ni filtered, CuKα radiation of wavelength 1.542 Å, and a graphite
monochromator. The scattered beam from the sample was focused on to a detector. The
ISSN (Online) 2347-3207
scanned in the 2θ range of 60
to 600 with a scanning step of 0.020. The X-ray scattering
measurements were performed at the WAXS/SAXS beam line of the LNLS (Laboratorio
Nacional de Luz Sincroton-Campinas, Brazil), by using monochromatic beam of wavelength
1.7433 Å. The scattering intensity was registered using a one dimensional position-sensitive gas
detector for a sample-detector distance of 1641.5 mm. The scan range (2θ) was 100 to 500.
WAXS curves were obtained from the WAXS images by band integration tool supplied by X-ray
1.0 software, produced by University Mons Hainaut.
II.THEORY
A. X-ray diffraction data analysis
The contribution of crystallite size, lattice strain and stacking faults to a Bragg reflection profile
can be written as [28],
) 1 ( )
( )
( )
(s T nd e[2 ( )]e [2 ( )]e[2 ]d nd
I IP i nd i nd indshkl
hkl hkl
where Ihkl(shkl) is the intensity of a profile in the direction joining the origin to the center of the
reflection, T IP is the Fourier transform of instrument profile, e[2πiζ(nd)] is the average phase factor
due to lattice distortion(ζ) and e[2πiφ(nd)] is due to crystallite size / stacking faults(φ). L = nd (with
d=dhkl) is the column length. Equation (1) can be written in the form of Fourier series as,
Ihkl (shkl)=
n
Ahkl (n) cos{2πndhkl(s-s0)} (2)
where Ahkl (n) are corrected Fourier coefficients with Fourier coefficients of instrumental profile
function TIP(nd), s is sin/ and s0 is the value of s at the peak of the reflection. Here
afterwards, we refer to crystallite size in terms of the average number of unit cells counted in a
direction perpendicular to the Bragg plane (hkl) with a notation <N>, and the crystallite size in
Å is given by Dhkl = <N>dhkl (dhkl is the perpendicular spacing of the (hkl) planes from their
origin). These Fourier coefficients Ahkl(n) are functions of the size of the crystallite, the disorder
of the lattice and stacking faults coefficients, i.e.
Ahkl(n)=Ashkl(n).Adhkl(n).AFhkl(n) (3)
Fourier analysis of a Bragg reflection profile must always be performed [28] over the complete
We do this analysis with the available truncated range by introducing truncated correction [29].
For a paracrystalline material, with Gaussian strain distribution, Adhkl(n) turns out to
be[28,30-31],
Adhkl(n) = exp (-2 π2 n2 m g2 ) (4)
where m is the order of the reflection and g = (Δd/d) is the lattice strain. Normally one also
defines mean square strain <ε2
> that is given by g2/n. This mean square strain is dependent on n
(or column length L = nd), where as g is not. With exponential distribution function for column
length, we have,
p n if ; N p n exp 0 A p n if ; , N n 1 0 A nAShkl (5)
In the above equation α = 1/(N-p), refers to the width of the distribution and p is the smallest
number of unit cells in a column.
Warren [28] has given an integral analysis for deformation faults and twin faults in various
crystal systems. According to this paper, the shift, broadening and asymmetry of the profile are
proportional to these fault densities. The sequence of stacking layers is usually denoted by A, B
and C. The unfaulted sequence is ABCABC or CBACBA. A stacking fault can be represented
by ABCBCABC. A twin fault sequence is ABCABCBACBA. The chance of finding a stacking
fault between any two adjacent layers causing a Bragg reflection and is denoted by αd
. Normally
αd
is expressed in percentage and the average number of Bragg planes between stacking faults is
given by 1/ αd
. The twin fault probability βis defined as the chance of finding a twin fault
between any two adjacent (hkl) layers and the average number of (hkl) layers between twin
faults is 1/β. With these aspects, Veltrop [32] has obtained an equation for Fourier coefficients
AFhkl(n) in terms of the deformation faults (αd) and twin faults (β) probabilities as
0 L 2 o 0 hkls(L /h )
nd ) 2 / 1 ( 2 d d F
hkl(n) [1 3 2 3( ) ]
A (6)
whereαdand β are, respectively the deformation and twin fault probabilities, L0=h+k+l,
h20=h2+k2+l2 and L0is the volume of crystallite with specified L0. We have assumed L0 to be
positive for all reflections (for L0=3N+1 and N = 0, 1, 2, . . . ) studied here. The whole
powder pattern of samples were simulated using individual Bragg reflections represented by the
ISSN (Online) 2347-3207
) (
)
(s I BG I
hkl
hkl hkl
(7)
where ωhkl are the appropriate weight functions for the (hkl) Bragg reflection. Here s takes the
whole range (2θ ≈ 60 to 600) of X-ray diffraction recording of the sample. BG is an error
parameter introduced to correct the background estimations.
III RESULTS AND DISCUSSION
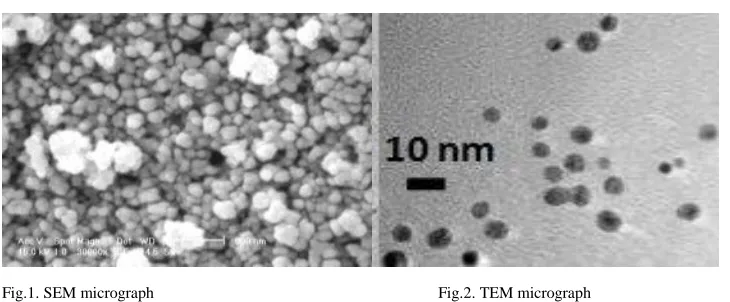
A. SEM and TEM analysis of silver nanoparticles
Powder extracted was subjected to electron microscopy studies to determine the morphology
and size of the synthesized silver nanoparticles. SEM data helped us to figure out the morphology
wherein TEM gives the size shown in Figure 1 and Figure 2.
Fig.1. SEM micrograph Fig.2. TEM micrograph
Parthenium hysterophorus leaf extract appears green in color shown Figure 3. This extract treated with 1mM and 2mM AgNO3 and incubated at room temperature for 7 days placed, the color of the change in
the color of in the suspension to reddish brown is the primary indication of the formation of silver
nanoparticles. Change in color which is due to the excitation of Suface Plasmon Resonance (SPR).In
metal nanoparticles such as silver, the conduction band and the valence band lie very close to each other
in which electrons move freely. These free electrons give rise to SPR absorption band occurring due to
the collective oscillation of electrons of silver nanoparticles in resonance with light wave. Classically, the
electric field of an incoming wave induces a polarization of the electrons with respect to much heavier
ionic core of silver nanoparticles. As a result a net charge difference occurs which in turn acts as a
restoring force. This creates a dipolar oscillation of all the electrons with the same phase. When the
frequency of the electromagnetic field becomes resonant with the coherent electron motion, a strong
Fig 3.Parthenium hysterophorus plant. Fig.4. A. Picture showing the leaf extract of Parthenium hysterophorus,
Fig.4.B. Picture showing 1mM AgNO3 solution without the leaf extract,
Fig.4C. Picture showing the resulting mixture of plant extract and silver nitrate (1:5) 5 days of incubation.
Rapid biosynthesis method, where in the mixture is irradiated with 5,7,9,12 and 15 cycles, Figure 5.
Shows the gradient in the color formation from yellow to reddish brown respectively. The reduction of
silver to nanoparticles increasingly proceeds with the increase number of cycles in other words increase
in time of exposure to radiation.
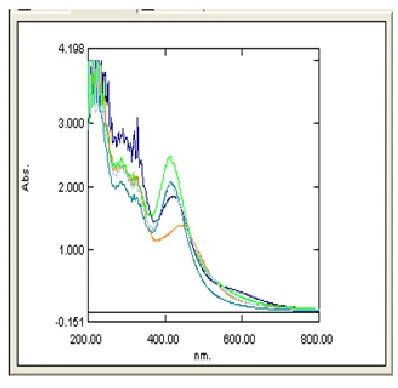
UV-Vis absorbance spectra of silver nanoparticles biosynthesized conventionally by treating 1ml
aqueous AgNO3 solution with leaf extract of Parthenium hysterophorus is shown in Figure 6. The wavelength, λmax is obtained at 426 nm with absorbance value 2.731.The sharp peak and the Surface
Plasmon Resonance band in the silver nanoparticles is shown in Figure 7 for 5th,7th,9th,12 and 15th cycles
also remain close to 420nm suggests that particles are monodispersed and distributed with no evidence of
ISSN (Online) 2347-3207
Fig.5. Picture showing the samples after rapid biosynthesis of silver nanoparticles using Parthenium hysterophorus leaf extract at the end of 5th cycle, 7th
cycle, 9th cycle, 12th cycle and 15th cycle respectively.
Fig 6. UV-Vis absorbance spectra of silver nanoparticles Conventionally Fig.7 UV-Vis absorption spectra of silver naoparticles derived using rapid biosynthesis
One major advantage of this rapid biosynthesis method is time required for the formation of
nanoparticles. Conventional incubation method takes 7days where in with the help of irradiation, silver
nanoparticles can be synthesized within few sec. The other advantages of using microwave radiation are
that it provides uniform heating around the nanoparticles and can assist the digestive ripening of such
particles without aggregation. The microwave radiation heats up a material through its dielectric loss,
which converts the radiation energy into thermal energy. Rapid microwave heating also provides uniform
nucleation and growth conditions, leading to homogeneous nanomaterials with smaller sizes. Power
dissipation is fairly uniform throughout with “deep” inside-out heating of the polar solvents, which leads
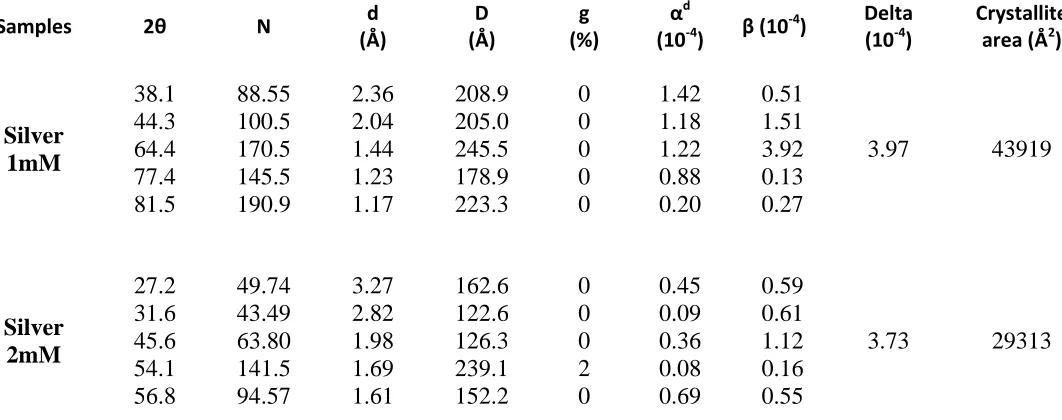
XRD patterns obtained for silver nanoparticles synthesized by rapid method using extract of
Parthenium hysterophorus at 12th cycle marked (111) indexed based had the cubic structure. The XRD
pattern of 1mM Ag ions is known to display peak at 2θ= 38.1,44.3,64.4,77.4,81.5 and 2mM Ag ions is
known to display peak at 2θ=27.2,31.6,45.6,54.1,56.8.
Average particle size can be estimated using Debye-Scherrer formula given by
D = 0.9 λ / W Cos θ
Where D is the particle size
λ is the wavelength of X ray= 0.1541nm
W is Full Width at Half Maximum (FWHM)
Calculation
D = (0.9 * 0.1541)/ 0.0157 *Cos (19)
= 9.3 nm
Hence theoretical value of the particle size is found to be 9.3nm.
A typical TEM and SEM micrographs are shown in the Figure 1&Figure 2 respectively of
silver nanoaprticles obtained by the synthesis of Parthenium hysterophorus leaf extract. With the help of these micrographs, the average particles size of silver nanoparticles is around 10nm and is cubical in
shape. TEM analysis helps us to determine the size of the particles this is due to the fact that during
transmission electron microscopy the electrons penetrate through the particle and the beam of electron are
analyzed.SEM ananlysis helps us to determine the morphology of the particle since the electrons from the
surface are reflected and the beam is of these reflected electrons are scanned. The size value is in
accordance with the theoretical value of size of the silver nanoparticles as per XRD analysis.In addition
to this the micro structural parameters were refined for individual profiles of X-ray recordings in each of
the sample and the computed values of crystallite size <N>, lattice strain (g in %), stacking fault
probability and twin fault probability are given in Table 1 for Silver nano particles using exponential
distribution function.
We observe that the average crystallite area in 1mM Ag nanoparticlesis 43919 Å2which decreases in
2mM Ag nanoparticles to 29313 Å2. Figure 8shows simulated and experimental profiles for Silver Nano
ISSN (Online) 2347-3207
Figure 8: Simulated and experimental profiles for Silver Nano particles obtained with Exponential column length distribution
The standard deviations in all the cases for the micro structural parameters are given in Table 1 as Δ. This
Δ represents the statistical percentage of deviation of the parameters. The agreement between simulated
and experimental intensity of the individual profiles in each of the samples are less than 10% of the mean
value. With these parameters given in Table 2 and Table 3 as an input, we have further refined these
parameters against the whole pattern (2θ ≈ 60 to 600) recorded from the samples by taking summation
which extends over the whole pattern [equation (7)]. We have observed small but significant changes in
these parameters with the set convergence of 1%. These changes are also given in Table 1. The goodness
of the fit between simulated and experimental profiles for the samples were given in Figure 8.
TABLE 1: Micro structural parameters and stacking faults for Silver 1 mM and Silver 2mM using exponential distribution function
Samples 2θ N d
(Å) D (Å) g (%) αd
(10-4) β (10
-4
) Delta
(10-4)
Crystallite area (Å2)
The observed variation in the micro structural parameters given in Table 1 is due to a two-fold
refinement. First we have carried out the line profile analysis of the extracted profiles from overlapping
regions, which is a standard procedure to compute the micro structural parameters. Secondly, the range of
overlapping regions determines the extent of broadening of the reflections. In fact, the broadening may
decrease if the reflections are closer together and hence results in an increase in the crystallite size values.
A closer look at the results in Table 1 and also the whole pattern indicates such a problem. It is worth
noting that none of other parameters, such as lattice strain and stacking fault probability, varied much
during the refinement against the whole pattern data of the samples. To check the reliability of the
computed deformation and twin faults, we have used a simple approximate method suggested by Warren
[28] and the expression for the twin fault is given by,
(8)
where 2θ0
CG is the center of gravity of the Bragg reflection profile and 2θ0PM is the peak
maxima, β is the twin fault and Xhkl is the constant value, which we have taken to be 0.23. For
all the samples we have computed the average twin fault probabilities are comparable to the
values obtained by incorporating an appropriate expression in the Fourier coefficients. From this
we would like to emphasize that these values are reliable and do represent the twin faults present
in the sample in a direction perpendicular to the axis of sample. In fact, 1/β represents the
number of layers between two consecutive twin fault layers. We have also approximately
estimated the deformation fault probability value αd
by making use of the following expression
given by Warren [28],
] ) /( [ ] / ) 5 . 1 [( 1 1 0
0 u b h
L d D D b hkl d S
(9)Where h0= (h2+k2+l2)1/2 , u is the un broadened component, b is the broadened component and
L0=3N+1 reflections.. A comparison with the deformation fault probability values obtained by
Fourier coefficient method (Table 1) indicates that the values are low, because there are too
many layers between two successive deformation fault layers. This is due to the fact that there
are pockets of crystalline like order in a matrix of amorphous regions. It is well known that the
Fourier method gives a reliable set of micro structural parameters and we have shown that in
addition to these values, one can also compute reliable fault probabilities.
2 ) 14.6X tan x 2
ISSN (Online) 2347-3207
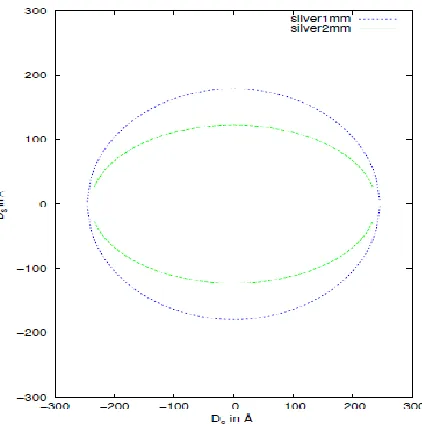
A graphical plot of the crystallite shape ellipse was obtained by taking the crystal size value
corresponding to 2θ ≈ 38.10
along the X-axis and the other parameter corresponding to 2θ ≈
81.50 along the Y-axis for 1mM Ag Nanoparticles and 2θ ≈ 27.20 along the X-axis and the other parameter corresponding to 2θ ≈ 56.80
along the Y-axis for 2mM Ag Nano particles with are
shown in Figure 10.These crystallite shape ellipse for the different samples the strength of the
samples are normally proportional to crystalline area which is equal to ellipse area determined
by micro structural parameters.It is evident that the crystallite shape ellipse area in 1mM Ag
Nano particles is greater than 2mM Ag Nano particles.The stacking faults and twin faults for
silver nanoparticles are found to be very smallwhich is shown in Figure 9.We have calculated
the probability of finding a hexagonal or cubic environment in the stacking arrangement, which
are the parameters used in the early works of Jagodzinski [27-28] and these values are given in
the Table 1.
Figure 9.The stacking faults and twin faults for silver nanoparticles Figure 10: Variation of crystallite shape ellipsoid for Silver Nano particles
IV CONCLUSION
Whole X - ray pattern fitting procedure developed by us has been used to compute micro
crystalline parameters. Electron scanning micrograph study of Ag nanoparticles gives a value of
the particle size in conformity with the X - ray results. The important aspect of this investigation
is that 1mM Ag nanoparticles have more crystalline area than 2mM Ag silver nanoparticles
small. The biosynthesis of silver nanoparticles by reducing Ag+ using the leaf extract of the plant
Parthenium hysterophorus has been demonstrated. Green synthesis approach for synthesis is advantageous over chemical methods as its economical and also eco-friendly. The formation of
silver nanoparticles is faster with rapid biosynthesis method compared to conventional
incubation method.
References:
1. Mihail C Roco. Current Opinion in Biotechnology 14, 337-346 (2003)
2. OV Salata. BioMed Central 2,1-6( 2004)
3. Murray CB, Kagan CR, Bawendi MG. Annu Rev Mater Sci 30,545-610(2000) 4. Mazzola L. NatureBiotechnology 21,1137-1143 (2003)
5. Paull R, Wolfe J, Hebert P, Sinkula M. Nature Biotechnology 21,1134-1147(2003) 6. Wilson Roa, James Xing. Nanotechnology:Public call for evidence.
7. Melissa M. Kemp, Ashavani Kumar, Shaymaa Mousa, Tae-Joon Park,Pulickel Ajayan, Natsuki Kubotera, Shaker A. Mousa, and Robert J. Linhardt. Biomacromolecules 10 (3), 589-595 (2009)
8. O‟Neal, D. P. Hirsch, L. R. Halas, N. J Payne, J. D. West. J. L.Cancer Lett. (Amsterdam, Neth.) 209, 171–176 (2004)
9. Hirsch, L. R. Stafford, R. J. Bankson, J. A. Sershen, S. R. Rivera,B. Price, R. E. Hazle, J. D. Halas, N. J. West. J. L. Proc. Natl.Acad. Sci. U.S.A. 100, 13549–13554 (2003)
10. Huang, X. El-Sayed, I. H. Qian, W. El-Sayed, M. A. J. Am. Chem.Soc. 128, 2115–2120 (2006)
11. Cognet, L. Tardin, C. Boyer, D. Choquet, D. Tamarat, P. Lounis. B. roc. Natl. Acad. Sci. U.S.A. 100, 11350–11355 (2003)
12. Skirtach, A. G. Dejugnat, C. Braun, D. Susha, A. S. Rogach, A. L.Parak, W. J. Moehwald, H. Sukhorukov, G. B. Nano Lett 5,1371– 1377 (2005)
13. Li, J. Wang, X. Wang, C. Chen, B. Dai, Y. Zhang, R. Song, M.Lv, G.Fu. D. ChemMedChem 2, 374–378 (2007)
14. Jun Sung Kim, Eunye Kuk, Kyeong Nam Yu, Jong-Ho Kim Sung Jin Park, Hu Jang Lee, So Hyun Kim, Young Kyung Park, Yong Ho Park, Cheol-Yong Hwang, Yong-Kwon Kim, Yoon-Sik Lee, Dae Hong Jeong, Myung-Haing Cho. Nanomedicine: Nanotechnology, Biology, and Medicine 3 (2007)
15. Asta, Judita PUISO. Material science 12,1392-1320 (2006)
16. Catauro M, Raucci MG, De Gaetano FD, Marotta A. J Mater Sci Mater Med 15(7):831 – 7 (2004)
17. Crabtree JH, Burchette RJ, Siddiqi RA, Huen IT, Handott LL,Fishman A. Perit Dial Int 23(4),368- 74 (2003) 18. Roldán M.V., Frattini A.L., Sanctis O.A., Pellegrini N.S. Anales AFA 17 , 212-217 (2005)
19. Panacek A, Kvitek L, Prucek R, Kolar M, Vecerova R, Pizurova N, et al. J PhysChem B 110 (33),16248-16253 (2006)
20. P.K. Sahoo , S.S. Kalyan Kamal , T. Jagadeesh Kumar, B. Sreedhar , A.K. Singh, S.K. Srivastava. Defence Science Journal 59, 447-455 (2009)
ISSN (Online) 2347-3207
23. Scardi, P. and Leoni, M., Acta. Cryst. A58, 190-200 (2002).
24. Warren B E, (1969). X – ray Diffraction, (Addision – Wesley, New York).
25. Somashekar R, Hall I H and Carr P D, J ApplCryst, 22 (1989) 363. 26. Warren B E, Prog. Met. Phys. 8, (1959) 147 – 202.
27. Warren B E and Averbach B L, J. Appl. Phys, 21 (1950) 595.