* Corresponding author: [email protected] ** Deceased.
1
For the abbreviation of Atmospheric Radiation Monitor, in Portuguese.
146305-8484- IJBAS-IJENS @ October 2014 IJENS I J E N S
particles. It is composed of a parabolic mirror focusing light onto a 64-pixel multianode photomultiplier tube. Ultraviolet-passing filters are positioned in front of the photocathode to select photons within the wavelength range of 300 to 400 nm. The data acquisition system consists of a front-end, a set of preamplifiers and FPGA-based boards able to record trigger times and waveforms from each channel. MonRAt is being designed to detect air fluorescence radiation under different atmospheric and geomagnetic conditions. Also planned are Cherenkov radiation measurements as well as atmospheric monitoring in the lidar mode.
Index Term-- Cosmic rays, atmospheric fluorescence, data acquisition system.
1. INTRODUCTION
Cosmic rays studies through measurements of atmospheric nitrogen fluorescence light have long been shown to be successful and, nowadays, experiments like HiRes [1], the Pierre Auger Observatory [2] and Telescope Array[3] employ this technique to detect cosmic ray showers with energies exceeding 1017 eV. The detection is performed by measuring the amount of near-ultraviolet light generated by de-excitation of nitrogen molecules, after their excitations or ionizations due to air shower charged particles. For ultra-high energy showers, the huge number of charged particles near the shower axis is responsible for the light generation with enough intensity to be detected
The absolute fluorescence yield is known for some electron energies, air pressures and temperatures [4], [5], [6], [7], but further and more precise results are needed, since their extrapolation is the main sources of systematic errors in the reconstruction of showers using fluorescence telescopes [8], [9]. For a given atmospheric height h, the number of fluorescence photons Nγ is proportional to number of electrons
Ne and the Fluorescence Yield (FY), which, in turn, depends
on energy deposit by electrons in the air at, air pressure P, air temperature T and the emitted radiation wavelength λ:
, , ( ), ( )
) ( )
( P h T h
dx dE FY h N h
N e
(1)
2. THE APPARATUS
International Journal of Basic & Applied Sciences IJBAS-IJENS Vol:14 No:05 33
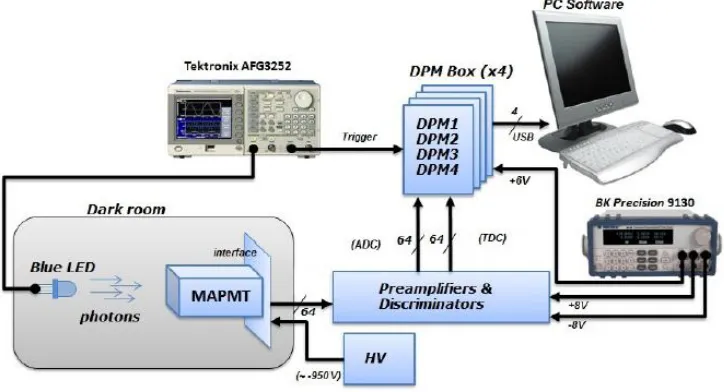
146305-8484- IJBAS-IJENS @ October 2014 IJENS I J E N S In figure 2, we show a diagram representing the main
components of the MonRAt experiment [12] [13]. The signals from the MAPMT are initially collected by a front-end interface that reads 65 analog signals: 64 anodes plus the twelfth dynode which integrates them all. These signals are sent to a stage with a double function: amplification (about 10 times in amplitude for each anode signal) and pulse formatting (TTL for all the signals). The signals are then sent to 4 boxes housing 4 DPMs (Data Processing Modules) boards each, able to handle 4 channels each (totaling 64 analog inputs). The analog inputs are sampled by 12 bit ADCs and through the trigger inputs they give the start condition for all TDC channels (by the twelfth dynode) and the stop condition for each TDC channel (by the anodes). Part of the electronics has been purchased and part has been developed in our laboratories, in the next sections we will discuss these components in detail.
2.1. MAPMT front-end board and the divider boards
The front-end board to collect and condition the MAPMT signals was manufactured by Vertilon Corporation [14]. The board (model SIB164A) provides electrical and mechanical connectivity between the MAPMT and the signal processing electronics of the experiment. The MAPMT is connected through a 76 pin socket in the lower side of the front-end board, giving inputs for the high voltage and outputs for the 64 anodes, the twelfth dynode signal and a common ground.
146305-8484- IJBAS-IJENS @ October 2014 IJENS I J E N S high voltage input. The signals from the anodes are routed to 2
connectors (J1 and J2), located on the backside of the board, that allows us to conveniently mount the system with the photocathode facing the optical arrangement and take the cables from the other side.
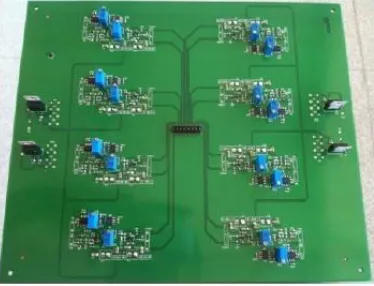
We purchased the front-end board (model SIB164A), 2 flat cables (model CNN020) with 32 channels each and 2 extra connectors (model SBC090P) to build 2 divider boards. The divider boards are designed to attach the cables and divide their signals in groups of 4 each (see figure 4). The output signals from the divider boards are then sent to another 8 boards in order to be amplified and formatted, as described in the next section.
2.2. Preamplifiers and discriminators
The signals coming from the MAPMT must be pre-amplified, since they have low amplitude and short duration (~30 ns). Thus, circuits with low noise, broadband and performing the functions of integrator, amplifier and filter are required. The active element is the operational amplifier OPA657 (see upper part of figure 5 for the preamplifier circuit). The time constant of the second stage ( = RshapeCshape) sets the rising and falling times for the signals
which must be compatible to the sampling times of ~10 ns of the analog to digital converter. Moreover, Rshape and Cshape
International Journal of Basic & Applied Sciences IJBAS-IJENS Vol:14 No:05 35
146305-8484- IJBAS-IJENS @ October 2014 IJENS I J E N S The discriminator produces digital TTL pulses when the
input signal has a higher amplitude than a threshold. For this project we used a fast analog comparator (propagation time of 7 ns), model AD8561 from Analog Devices (see lower part of figure 5 for the discriminator circuit). The input voltage (Vin_disc) is compared to a constant threshold voltage (Vth),
adjusted by the potentiometer R2. If Vin_disc is greater than Vth,
the comparator is left enabled (~3.5 V), otherwise it remains at 0 V. A digital output signal compatible with the TTL standard is then produced. A high precision stable voltage reference (2.5 V) is provided for the potentiometers. This is generated by the integrated circuit REF43GS. The comparator is configured with hysteresis by adding feedback to the non-inverting input through the resistor R3. The addition of
hysteresis to the comparator offers advantages in noisy environments, where is not desirable for the output signal to switch between states when the input signal is near threshold.
The MonRAt detector uses a set of 64 preamplifiers and discriminators, housed in 8 boards of 8 channels each, as shown in figure 6. Subsequently, the signals are sent to the DPMs.
2.3. Data processing module
The Data Processing Module (DPM), shown in figure 7, is the main circuit of the acquisition of MonRAt. It is based on a
146305-8484- IJBAS-IJENS @ October 2014 IJENS I J E N S device and is responsible for the digital signal processing and
communication with the computer via a USB port. Each module has 2 ADCs (2 channels each, totaling 4 analog input channels), 8 channels of time-to-digital conversions, the FPGA device, 24 channels of digital input/output pins and a bus interface for communication with a DB-25 connector. A USB board interface module enables communication with the computer via the communication bus of one DPM, positioned in the top of the box and called master. This master board also controls the communication of the other 3 DPMs in the box, through the DB-25 connector, and sends their data to the USB board. The USB interface uses a commercial chip transceiver (FT232BL).The analog inputs at each DPM board are 50 Ω LEMO connectors supporting high frequency signals.
Each module contains two analog-to-digital converters with a resolution of 2 channels of 12 bits and a sampling rate of 60 MSs-1. Amplitude measurements of analog signals are
International Journal of Basic & Applied Sciences IJBAS-IJENS Vol:14 No:05 37
146305-8484- IJBAS-IJENS @ October 2014 IJENS I J E N S The DPM has a single time-integrated digital converter,
TDC F1 circuit, manufactured by Acam. The F1 has 8 channels with resolution of ~120 ps per channel and 16 bit precision, which can measure time intervals between 5 ns and 7.8 μs. The resolution is adjustable by internal configuration and is calibrated by a crystal oscillator through a PLL (Phase Locked Loop)
circuit. There is only a single signal common to all stop channels. Once the signal is detected, the TDC begins the process of measurement of time and waits for the stop signals. The converted output value is placed on the digital bus, identifying the respective conversion channel. All these bus signals are connected to the FPGA, where the synthesized logic circuits are responsible for receiving the converted data and sending them to the computer via the USB port. Besides the main components mentioned above, on the board there is a device for configuration of the FPGA with JTAG (Joint Test Action Group), which stores the synthesized logic. Moreover,
there are other active and passive electronic components, which are essential for the functioning of all other devices.
For use in MonRAt we grouped 4 boxes with 4 DPMs each, totaling 64 input channels. In addition to the analog inputs, the DPM has a digital input, which activates the process of data acquisition at the analog channels in their positive transition. The set of DPMs has a single power input shared by every board with a supply voltage of +6 V and maximum current of 2.8 A. There is also another input for feeding the cooling fan, with a voltage of +12 V and maximum current of 0.15 A.
3. SOFTWARE
146305-8484- IJBAS-IJENS @ October 2014 IJENS I J E N S The program is written in C++, under Linux operating
system, and is object-oriented. The software has the main objectives of running data acquisitions, provide visualizations of the signals and output files for offline analyses. It was modeled and implemented with a structure of packages, which assembles a group of 12 classes that provides the functionality of each part of the application. The class diagram is shown in figure 9. Most relationships between classes are associations, with only one inheritance relationship between the DPM and DPMMonRAt classes, and one single dependency relationship between DPM and ftd2xx classes.
The graphic interface of the software was built from several objects belonging to the ROOT framework. Figure 10 shows the acquisition program running, taking data from a DPM board. The program features 4 visualization areas for graphics (one for each input in this given DPM) and options for writing outputs into files. These options are user selectable via checkboxes located in the upper left side and the right side. The recording options, on the right side, include the types of files that will be generated (waveforms or tables), the nomenclature (or the initial path of the files) and the DPM box data source. The content of these areas, i.e. the analog or TDC channel, can be selected by combo boxes located on the left upper side. Event counters for each device are shown on screen and a status bar displays the conditions of the connections and messages to the user. The components of the user interface feature information and instructions that are displayed when the mouse overlaps the component.
To connect a device function it is required to press the Con respective button and then press the Run button. Afterwards, the class starts pThread responsible for the device, which, in turn, executes the acquisition routine and processes the data. These routines monitor the buffer data from the USB port: when this buffer has reached a minimum amount of data, they are read and processed for validation by reading headers. After the validation, the acquisition of the event is held, otherwise it is discarded.
4.THE SINGLE PHOTOELECTRON AND THE GAIN OF INDIVIDUAL PIXELS
In order to test the MonRAt system, we performed the measurement of the gain of each channel of the MAPMT, using the single photoelectron procedure. In this procedure, we impinge the minimal amount of light (~ 1 photon) on each MAPMT pixel with a blue LED, both placed in a dark room (see figure 11), and read the resulting ADC signals, after preamplification and conversion in the DPMs. In this method, the probability of converting the photon into a single photoelectron inside the tube is maximized. Thus, obtaining the spectrum of signals of multiplied electrons in the anodes, one can measure the gain of each MAPMT channels.
International Journal of Basic & Applied Sciences IJBAS-IJENS Vol:14 No:05 39
146305-8484- IJBAS-IJENS @ October 2014 IJENS I J E N S In the left side of figure 12, we can see the single photon
spectrum for a selected channel and, on the right side, the histogram of gains for all the channels. We estimate an average gain of
1
.
78
10
6, in accordance with the manufacturer of the photomultiplier[11].5. THE LIGHT SPOT AND TRANSIT TEST
Another test to the MonRAt system was to use the same blue LED as light source in the dark room, aligned near the optical axis and positioned 2.5 m away from a small spherical mirror (15 cm of diameter). The spot size formed at the MAPMT photocathode can be seen at the upper part of figure 13(a) for an amount of light much bigger than used. Actually, this test has been performed near the single photon regime, such that this light would be impossible to be seen by naked eye. Then, the data acquisition system (MAPMT, front-end, preamplifiers and DPMs) for the 16 central pixels was turned on and the signals read through the MonRAt software. In the lower part of figure 13(a), we plot the histogram of signals: there is one central pixel with counts well above the others (showing the most illuminated pixel) and a small aberration upon two neighbors. However, the MonRAt system was able
to collect this small amount of light, which gives us confidence that the experiment can detect fluorescence photons under the desired conditions: moonless and clear night skies.
A second test was to progressively displace the LED by some centimeters to simulate a cosmic ray shower track developing in the MAPMT field of view. The result for this acquisition is given in figure 13(b).
6. CONCLUSIONS
We have presented the design of the MonRAt detector electronics and software, measurements of individual channels gains, and its expected performance under simulated conditions. MonRAt is designed for the detection of atmospheric fluorescence radiation generated by cosmic ray showers of energies greater than
10
17.5eV.146305-8484- IJBAS-IJENS @ October 2014 IJENS I J E N S
A372:527.
[5] M. Nagano et al., Astropart. Phys., 2003, 20: 293; 2004, Astropart. Phys.,22: 235.
[6] J. W. Beltz et al., Astropart. Phys., 2006, 25: 129. [7] P. Collin et al., astroph/06121110.
[8] V. de Souza, G. Medina-Tanco and J. A. Ortiz, Astropart. Phys., 2006,25: 84.
[9] B. Keilheuer et al., Astropart. Phys., 2006, 25: 256.
[10] M. A. Leigui de Oliveira et al., The MonRAt telescope for atmospheric radiation, Proc. of the 33rd ICRC (2013), Rio de Janeiro CR-IN, ID=1082;Proc. of the 32nd ICRC (2011), Beijing, Session HE.3.6, ID=1041; Atmospheric Radiation Monitor, Proc. of the 31st ICRC (2009), Lódz, Session HE.2.4, ID=0097.
[11] http://www.hamamatsu.com
[12] V. A. Ferraz, Sistema multicanal para aquisição de dados em um experimento de fluorescência atmosférica, Master Thesis, CBPF (2012), Rio de Janeiro, Brazil.
[13] A. B. Vilar, Instrumentação para observação de fluorescência de raios cósmicos com fotomultiplicadora multianódica, Master Thesis, CBPF(2009), Rio de Janeiro, Brazil.