Abstract-- In this paper, compression tests were carried out on two varieties of mangoes namely Totapuri and Tommy Atkins using a universal testing machine (UTM) in order to determine their modulus of elasticity. A detailed design procedure for developing a tactile sensor to differentiate between different ripeness levels of mango within the sensor range is presented. Each variety of the mango tested had 5 samples of different ripeness levels to test their elastic modulus. The mangoes were loaded radially and the elastic modulus obtained, was seen to be between 0.5MPa and 3.5MPa. The tactile sensor developed is based on two springs, each of which has different stiffness. This design ensures high sensitivity as well as linearity of the output. The measuring range of the sensor was selected based on the modulus of elasticity of mango fruit chosen from the compression tests carried out. The performance of the tactile sensor was studied from the simulation results obtained from a finite element model, which was developed using ANSYS Mechanical APDL software. The simulation results show that- the sensor can differentiate between different mango fruits based on their elastic modulus within the specified range of the sensor.
Index Term-- Elastic modulus, Mango fruit, Tactile Sensor, Finite element.
I. INTRODUCTION
DURING the process of selecting, packaging, transporting and pressing a fruit to check for its ripeness, mechanical damages occur in the fruit thereby leading to non-uniform ripeness which affects the taste of the fruit as a whole. Usually, fruits are harvested when they are mature and hard in order to avoid perishing during transportation. These fruits are then stored until they get ripe and ready for consumption. Mangoes, which are the case study in this work is relatively cheap and affordable. However, determining their ripeness presents some challenges since change in colour of these fruits does not necessarily guarantee their ripeness. In most cases, ripeness is determined by pressing the fruits to check if it is soft. This technique is not optimal because, in the process of pressing these fruit, it exposes the fruit to localized damage and non-uniform ripeness and when the unripe part ripens, the already ripened part tends to spoil. This has an effect on the taste and quality of the fruits and usually leads to wastage of the fruits.
A lot of researchers have carried out works in fruit sorting and ripeness detection based on imaging system as in [1]–[4], based on gas sensors and electronic nose as in [5], [6] and also based on the parameters affecting fruit quality as in[7]–[10], however little work has been reported so far in fruit sorting based on its stiffness as a function of its modulus of elasticity. Kunpeng et al [11] worked on mechanical properties and compression damage simulation by finite element for kiwifruit, he found that the average elastic modulus of kiwi fruit on radial loading is 1.71MPa. Alan et al [12] also carried out a
mechanical characterization of mango fruit using compression tests to determine the elastic modulus of the two varieties of mangoes they worked with. From their results, the range of elastic modulus on radial loading of the mangoes they worked on is between 1MPa and 2.5MPa.
Sensors which have been employed by many researchers in stiffness sensing of objects are tactile sensors. Different concepts have been applied in tactile sensor development for soft tissue stiffness measurement. However, the 2-tip configuration concept employed by [13] has an advantage of being independent of the applied displacement and applied force on the sensor. Fath El- Bab et al. [13], [14] worked on softness of tissue compliance detection applying the two springs concept to differentiate soft tissues with different stiffness, They showed that springs with cubic tip gives more stable output than springs with spherical tip. Fouly et al. [15], [16] modified the two springs concept to a three tip concept based on the fact that tissues have irregularities in their shape, and developed a new tactile sensor that compensates for irregularities in the tissue shape to differentiate between tissues with different stiffness.
Tactile sensors have a variety of industrial applications, including robotics [17], [18] haptic devices [19], biomedical sensing [20], and polymer characterization [21]. According to Lee et al [22], a tactile sensor is a device or system that can characterize mechanical properties of the targeted object or of the contact between the sensor and the object. Tactile sensors for contact force measurement have been well documented, and a number of prototype sensors have been developed [23], [24]. This paper aims to estimate the elastic modulus of mango of different levels of ripeness and to develop a tactile sensor applying the two springs concept that will differentiate mangoes of different ripeness levels due to the difference in their stiffness as a function of their elastic modulus. The measurement range of the sensor is chosen based on the experiment conducted on the mango fruits. Subsequently, the parameters of the sensor are optimized, so as to increase sensitivity and linearity of the sensor output. A finite element model is developed for analysis of the performance of the sensor with the designed parameters of the sensor.
II. COMPRESSION TESTS ON MANGO
A. Test Materials and Methods
Five samples of Totapuri mango and Five samples of Tommy Atkins mango were being tested. These mangoes selected had different ripeness levels from in order to have a wide range for the sensor. The fruits were loaded radially on a
Chiebuka T. Nnodim, Ahmed M. R. Fath El Bab, Bernard W. Ikua and Daniel N. Sila
Universal testing machine and then compressed with a (30mmx30mmx70mm) compression plate.
Fig. 1. Experimental Setup
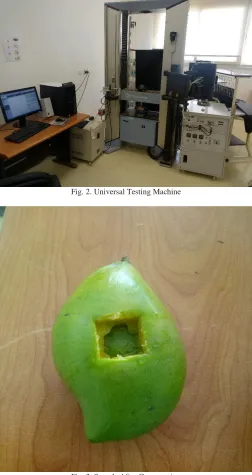
The universal testing machine as shown in Fig. 2 is the SHIMADZU AG-100kNXplus series which weighs 834kg with a maximum load capacity of 100 kN and has a power requirement of 3-phase, 200 to 230 V, 50 to 60 Hz, 7 kVA (2.0 kW). It has a cross head speed range of 0.0005 to 1000 mm/min, maximum return speed of 1200 mm/min, data capture rate is 5000 Hz, data sampling rate is 300 Hz, effective test width is 600 mm. The UTM used is shown in Fig. 2.
The compression test was carried out at a speed of 5 mm/min. The radial height of the mangoes ranged from 65mm to 70mm, as measured by Vernier calipers. The setup of the experiment is as shown in Fig. 1 and the mangoes where compressed until failure as shown in Fig.3.
Fig. 2. Universal Testing Machine
Fig. 3. Sample After Compression
The Force-displacement curve for each sample was generated from the TRAPEZIUM X software installed in the PC which is connected to the UTM. From the Force-displacement curve, the stress-strain curve for each sample was generated taking into consideration the radial height of the mangoes and the surface area of the compression plate. The modulus of elasticity was computed as shown in Equation (1)
𝐸 =𝜎
𝜖= 𝐹 𝐴 𝛿ℎ
ℎ
(1)
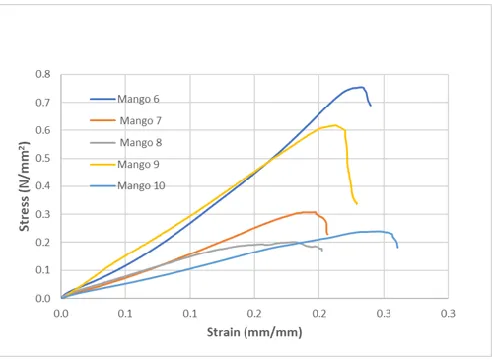
the mango. The force-displacement curves for the two types of Mangoes are shown in Figs. 4 and 5, and the stress-strain curves are shown in Figs. 6 and 7. The values of the Elastic modulus were computed from the stress strain curves, and the values are shown in Table I.
Fig. 4. Force-displacement curve for Totapuri Mango
Fig. 5. Force-displacement curve for Tommy Atkins Mango
Fig. 6. Stress-strain curve for Totapuri Mango
Fig. 7. Stress-strain curve for Tommy Atkins Mango
TABLE I
ELASTIC MODULUS OF THE TESTED MANGOES
Elastic Modulus for Totapuri Mango (MPa)
Elastic Modulus for Tommy Atkins
Mango (MPa)
Mango 1 3.23 ± 0.03 Mango 6 3.18 ± 0.15
Mango 2 1.78 ± 0.18 Mango 7 1.75 ± 0.14
Mango 3 1.1 ± 0.09 Mango 8 1.41 ± 0.15
Mango 4 1.0 ± 0.15 Mango 9 3.08 ± 0.08
Mango 5 2.42 ± 0.08 Mango 10 1.08 ± 0.27
III. SENSOR DESIGN A. Mathematical Model
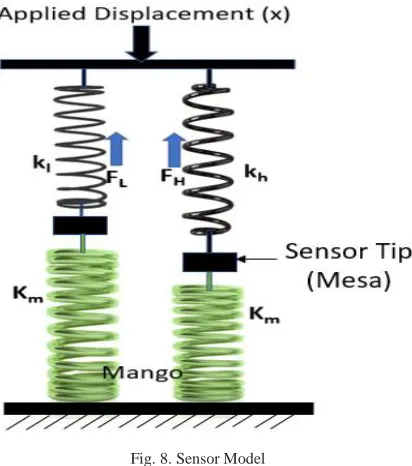
The design of the sensor consists of two springs with stiffness Kl and Kh on the left and right hand respectively as shown in Fig. 8. The mango stiffness Km is modeled as an elastic spring [25]. Kl is the lower stiffness spring while Kh is the higher stiffness spring. As the sensor is pushed through a distance, x to make contact with the mango, forces are generated on the low and high stiffness springs. These forces are FL and FH, respectively. It can be seen in Fig. 8 that Kl and Kh are in series with the mango spring Km; therefore, their equivalent stiffness KL and KH as shown in Fig. 9 is mathematically shown in Equations (2) and (3).
𝑘𝐻= 𝑘ℎ𝑘𝑚 𝑘ℎ+ 𝑘𝑚
(2)
𝑘𝐿= 𝑘𝑙𝑘𝑚 𝑘𝑙+ 𝑘𝑚
Fig. 8. Sensor Model
Furthermore, by measuring the ratio of the forces, P i.e. the sensor output in (4) generated in the springs when pushed to the mango, the stiffness of the mango can be measured as shown in (5)
𝑃 =𝐹𝐻 𝐹𝐿=
𝑘ℎ(𝑘𝑚+ 𝑘𝑙) 𝑘𝑙(𝑘𝑚+ 𝑘ℎ)
(4)
Where P is a dimensionless parameter.
𝑘𝑚=
𝑘ℎ𝑘𝑙(1 − 𝑃) 𝑃𝑘𝑙− 𝑘ℎ
(5)
B. Mango Fruit Stiffness Range
Hayes et al [26] provided a mathematical model based on indentation principle as shown in Fig. 10 to calculate the stiffness of a soft object as a function of its elastic modulus as shown in Equation (6)
Fig. 9. Equivalent Model of the Sensor
𝐸𝑚=
(1 − 𝜈2)𝐹 2𝑟 ⅆ𝐶𝑘
(6)
𝑘𝑚=
2𝑟𝐸𝑚𝐶𝑘 (1 − 𝜈2)
(7)
Where: 𝐹, 𝜈 , ⅆ, 𝑟, 𝐸𝑚, 𝐶𝑘 and h are the applied force, Poisson’s ratio of mango, the indentation depth, the indenter radius, the Elastic modulus of mango, the scaling factor and the radial height of the mango, respectively. The indentation principle with a plain end indenter is as shown in Fig. 10
Fig. 10. Indentation principle
having their range of values. In the current work, mango is assumed to be isotropic and linear elastic, especially when deformed slightly, its Poisson's ratio is assumed to be 0.3 and the maximum range of elastic modulus is 3MPa from the experiment of this work, which corresponds to a stiffness value of 3300N/m according to Equation (7). Also, the indenter is designed to be a cube with side length of 1mm and the radial height of the mango is 70mm. However, the scaling factor 𝐶𝑘 depends on 𝜈, (r/h) and (d/h); Zhang et al [27] developed tables from a finite element analysis to estimate 𝐶𝑘, hence obtained 𝐶𝑘
= 1. Finally, from the experiment carried out in this work, the stiffness values will range from 550N/m to 3300N/m.
C. Sensor Parameters
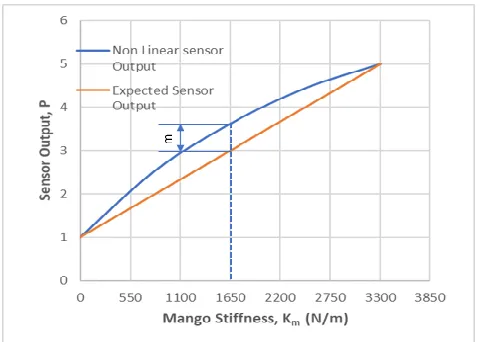
The sensor parameters are the low stiffness sensor Kl, the high stiffness sensor Kh and the force ratio P. The maximum force ratio Pmax can be calculated by defining Kl and Kh at maximum Km in (4). However, doing that will increase the error in P due to crosstalk (interference) effect and cause a very large difference between Kl and Kh. Fath El Bab et al [13], carried out a crosstalk effect analysis and found the Pmax to be 5; thus, the selected Pmax value in this work based on Equation (4). As stated earlier, the relationship between P and Km as in Eq, (4), is nonlinear when arbitrary values of Kl and Kh as shown in Fig. 11; however, a non-linearity error analysis was done in order to get the desired Kl and Kh that gives a linear output. Fig.11 shows that the maximum non-linearity occurs at the mid-range of the mango stiffness.
Fig. 11. Nonlinear and Expected Sensor Output Vs Mango Stiffness
Therefore, the maximum nonlinearity error NL from Fig. 11, is represented mathematically in Equation (8)
𝑁𝐿 = 𝑚
𝑃𝑚𝑎𝑥− 1=
(𝑃1650− 1) − (𝑃𝑚𝑎𝑥− 1)/2 𝑃𝑚𝑎𝑥− 1
(8)
Where, P1650 is the sensor output at the mid-range of the mango stiffness designed, m is the distance between the maximum point of nonlinearity to the corresponding linear point as shown in Fig. 11.
Therefore, for Pmax = 5, (8) becomes;
𝑁𝐿 =𝑃1650− 3 4
(9)
Also, from (4),
𝑃1650=
𝐾ℎ(1650 + 𝐾𝑙) 𝐾𝑙(1650 + 𝐾ℎ)
(10)
The relationship between Kl and Kl at Pmax from (4) becomes;
𝐾ℎ =
𝑘𝑚𝑃𝑚𝑎𝑥 1 + (𝐾𝑚
𝐾𝑙
⁄ ) − 𝑃𝑚𝑎𝑥
= 4125𝐾𝑙
825 − 𝐾𝑙
(11)
Substituting (11) into (10), we get
𝑃1650=8250 − 5𝐾1650 + 3𝐾𝑙 𝑙
(12)
Subsequently, substituting (12) into (9),
𝑁𝐿 = 825 − 𝐾𝑙 1650 + 3𝐾𝑙
(13)
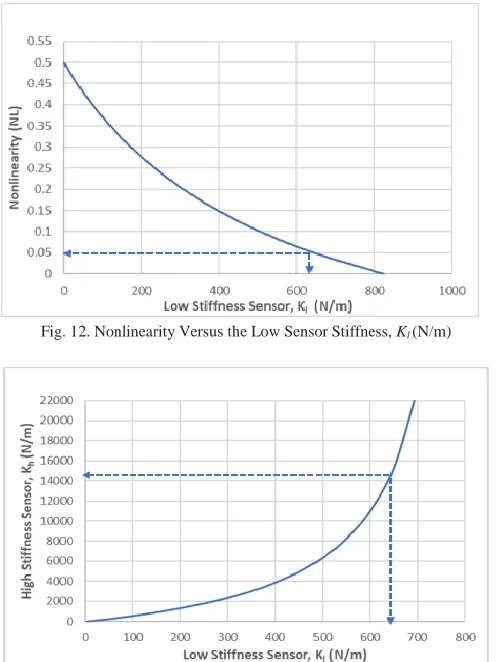
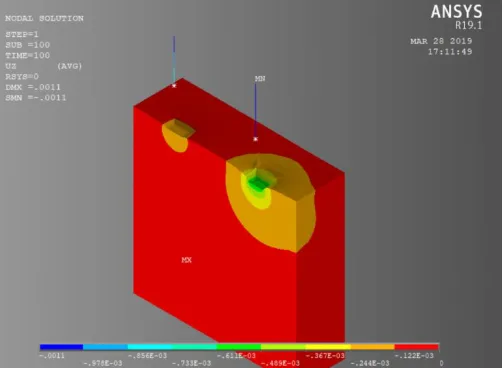
Equation (13) shows the relationship between the between NL and Kl, which implies that NL is a function of change in Kl as shown in Fig.12. However, from Fig. 12, if a higher value of Kl is selected, then the value of Kh will be increased which will make the strain on the high stiffness sensor very low and this will consequently lead to a low output voltage. In this work, a nonlinearity error of 5% is assumed to be allowed, and this gives a value of 645N/m for Kl and 14782N/m for Kh. The relationship between the High stiffness sensor Kh and the low stiffness sensor Kl is shown in Fig.13. Having carefully selected our parameters, a 3-D Finite Element Analysis (FEA) was used to analyze the sensor performance of the proposed sensor in the next section.
IV. FINITE ELEMENT MODEL AND ANALYSIS
The design parameters obtained in the previous section is used to build a Finite element model using ANSYS Mechanical APDL (ANSYS Parametric Design Language) software to analyze the sensor performance in this section.
A. Description of Model
Fig. 12. Nonlinearity Versus the Low Sensor Stiffness, Kl (N/m)
Fig. 13. High Stiffness sensor, Kh(N/m) versus the Low Sensor Stiffness, Kl
(N/m)
homogeneous, fixed below at its base, and linearly elastic with a Poisson's ratio of 0.3 with dimensions of (20mm x12 mm x 20mm) as shown in Fig.14. Fig.15 shows the front view of the model. Also, the elastic modulus of the mango tested were 0.5MPa, 1MPa, 1.5MPa, 2MPa, 2.5MPa and 3MPa which corresponds to stiffness of 550N/m, 1100N/m, 1650N/m, 2200N/m, 2750N/m and 3300N/m, respectively according to Hayes et al. model [26]. The distance between the sensor tips is 8mm, this is narrow enough to assume that the surface of contact is flat. The sensor tips which is a rigid body attached to the spring during pushing is cubic with a side length 1mm, the sensor tip in the model is at a distance 0.5 mm above the fruit. The contact of the sensor tip with the mango was built with CONTA174 and TARGE170elements located on its boundary. The sensors are the two springs of COMBIN14 elements, which represents the lower stiffness sensor Kl = 645N/m on the left and the higher stiffness sensor Kh = 14782N/m on the right as shown in Fig.14 and Fig.15. MESH200 elements was applied on the surface area of the mango with the contact zones highly refined. The applied
displacement into the mango is 0.6mm as shown in Fig. 16 to 21.
Fig. 14. A 3-D Axisymmetric Finite Element Model
Fig. 15. Front view of the 3-D Axisymmetric Finite Element Model
Fig. 17. Deformations on the Mango of E = 2.5MPa After Contact with the Sensor
Fig. 18. Deformations on the Mango of E = 2MPa After Contact with the Sensor
Fig. 19. Deformations on the Mango of E = 1.5MPa After Contact with the Sensor
Fig. 20. Deformations on the Mango of E = 1MPa After Contact with the Sensor
Fig. 21. Deformations on the Mango of E = 0.5MPa After Contact with the Sensor
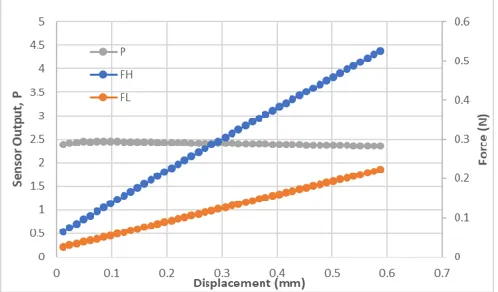
Fig. 22. Sensor Output, P and Forces FH and FL Versus Displacement, x (mm)
Fig. 23. Sensor Output, P and Forces FH and FL Versus Displacement, x (mm)
for mango of 2.5MPa modulus of elasticity
Fig. 24.Sensor Output, P and Forces FH and FL Versus Displacement, x (mm)
for mango of 2MPa modulus of elasticity
Fig. 25.Sensor Output, P and Forces FH and FL Versus Displacement, x (mm)
for mango of 1.5MPa modulus of elasticity
Fig. 26. Sensor Output, P and Forces FH and FL Versus Displacement, x (mm)
for mango of 1MPa modulus of elasticity
Fig. 27. Sensor Output, P and Forces FH and FL Versus Displacement, x (mm)
for mango of 0.5MPa modulus of elasticity
V. RESULTS AND DISCUSSION
A. Compression Tests on Mango
Figs. 4 to 7 show the force-displacement curves and stress-strain curves of the Totapuri mango and Tommy Atkins mango; the experiment was able to estimate the Elastic modulus of each sample based on its level of maturation as shown in Table I. The results show that the unripe mangoes amongst the samples tested had the highest elastic modulus, then, the mid ripe and finally the very ripe mangoes (mango 3, 4, 8, 10) had the lowest elastic modulus. This is to say that as ripeness (maturation) increases, the elastic modulus and stiffness reduce. The experiment also showed that the elastic modulus of different maturation levels of mango falls in the range of 0.5MPa to 3.5MPa. From the experiments conducted in this work, the unripe mangoes have an elastic modulus greater than 3MPa; to this effect, the maximum range of our sensor becomes 3MPa.
B. Sensor Output
mango fruit in the finite element model. It can be seen that as the Elastic modulus of the mango fruit reduces, the stiffness in the mango reduces. From the results shown in Figs. 22 - 27, it is seen that - the sensor can differentiate between the different stiffness of the mango and the output readings where stable along the displacement of 0.6mm. Also, the forces generated in the High stiffness sensor FH and Low stiffness sensor FL, reduces as the as the modulus of elasticity of the mango decreases. The ratio of FH to FL gives the sensor output P.
Finally, from the results of the simulation, a macro tactile sensor with sensor stiffness values Kl = 645N/m and Kh = 14782 N/m will be fabricated and experimentally tested with mango in the next work.
VI. COMPARATIVE STUDY
Several methods have been used in ripeness detection of mangoes and other fruits. These methods are Near Infrared (NIR) spectroscopy, machine vision, Red Green Blue (RGB) and Hue Saturation Value (HSV) color space, colour sensor, electronic nose with ethylene gas sensor, neural network and computer vision. These methods have focused more on the colour changes, image segmentation and odor changes in mangoes and other fruits to detect their ripeness and these colour changes and image segmentation is not sufficient to tell the ripeness of mango. Also, the mechanical properties were not taken into prior consideration in the above-mentioned methods. This paper has demonstrated a novel method in mango ripeness detection by the application of a tactile sensor with two springs with different optimized stiffness to differentiate between mangoes of different ripeness levels based on the stiffness of the mango as a function of its elastic modulus. This proposed tactile sensor demonstrates a relatively simple configuration which will easily be used to test for ripeness of mango in other to avoid damaging and rupturing of mango by hard pressing to check for its ripeness.
VII. CONCLUSION
This paper has presented an estimate of the range of elastic modulus of mango of different ripeness levels and a tactile sensor for fruit ripeness measurement which is based on the principle of applying two springs with different stiffness properly designed. The parameters of the sensors were optimized to give high sensitivity and linearity of its output. The sensor measuring range is up to 3MPa so as to cover a wider range of fruits in this class. The performance of the sensor was studied by carrying out a Finite element analysis on the model. The mango was modeled as a cube of (20mmx12mmx20mm), having a Poisson’s ratio of 0.3 and elastic modulus varying from 0.5MPa to 3MPa.
Finally, the Finite element analysis on the performance of the sensor demonstrated that the sensor can to differentiate different mangoes based on their elastic modulus in the designed range up to 3MPa. Also, the force ratio P for each of the mangoes at different stiffness is linear, which implies that the sensor outputis independent of the displacement and force applied.
VIII. ACKNOWLEDGMENT
This work is supported by Japan International Cooperation Agency (JICA) through the Pan African University Institute for
Basic Sciences, Technology and Innovation (PAUSTI). The authors would like to thank Egypt-Japan University of Science and Technology (E-JUST) for enabling the authors use her research facilities and resources to accomplish this work.
IX. REFERENCES
[1] E. H. Yossy, J. Pranata, T. Wijaya, H. Hermawan, and W. Budiharto, “Mango Fruit Sortation System using Neural Network and Computer Vision,” Procedia Comput. Sci., vol. 116, pp. 596–603, 2017. [2] M. Shiddiq, Fitmawati, R. Anjasmara, N. Sari, and Hefniati,
“Ripeness detection simulation of oil palm fruit bunches using laser-based imaging system,” AIP Conf. Proc., vol. 1801, 2017.
[3] M. Dadwal and V. K. Banga, “Color Image Segmentation for Fruit Ripeness Detection : A Review,” 2do Int. Conf. Electr. Electron. Civ. Eng., pp. 190–193, 2012.
[4] I. Sa, Z. Ge, F. Dayoub, B. Upcroft, T. Perez, and C. McCool, “Deepfruits: A fruit detection system using deep neural networks,” Sensors (Switzerland), vol. 16, no. 8, 2016.
[5] S. M. Praveena, “Evaluation of Fruit Ripeness Using Electronic Nose,” Int. J. Adv. Inf. Sci. Technol., vol. Vol.6, no. June, 2017. [6] A. H. Gómez, G. Hu, J. Wang, and A. G. Pereira, “Evaluation of
tomato maturity by electronic nose,” Comput. Electron. Agric., vol. 54, no. 1, pp. 44–52, 2006.
[7] V. G. Verzhuk, S. V. Murashev, and a. Y. Belova, “Determination of tissue elasticity of apple, pear, and quince fruits for predicting losses during cold storage,” Russ. Agric. Sci., vol. 38, no. 4, pp. 272– 274, 2012.
[8] B. Jarimopas and U. Kitthawee, “Firmness properties of mangoes,” Int. J. Food Prop., vol. 10, no. 4, pp. 899–909, 2007.
[9] M. Grotte, F. Duprat, E. Piétri, and D. Loonis, “Young’s modulus, poisson’s ratio, and Lame’s coefficients of Golden Delicious apple,” Int. J. Food Prop., vol. 5, no. 2, pp. 333–349, 2002.
[10] S. Cárdenas-Pérez et al., “Structural, mechanical and enzymatic study of pectin and cellulose during mango ripening,” Carbohydr. Polym., vol. 196, no. January 2019, pp. 313–321, 2018.
[11] T. Kunpeng et al., “Mechanical properties and compression damage simulation by finite element for kiwifruit,” Int. Agric. Eng. J., vol. 26, no. 4, pp. 193–203, 2017.
[12] A. Dantas, R. Barbosa, A. F. Neto, and L. I. N. Hernández, “Mango mechanical compression tests.pdf,” Rev. Ciencias Agrar., vol. 40, no. 2, pp. 405–410, 2017.
[13] A. M. R. F. El Bab et al., “Design and simulation of a tactile sensor for soft-tissue compliance detection,” IEEJ Trans. Sensors Micromachines, vol. 128, no. 5, pp. 186–192, 2008.
[14] A. M. R. Fath El-Bab, M. E. H. Eltaib, M. M. Sallam, and O. Tabata, “Tactile sensor for compliance detection,” Sensors Mater., vol. 19, no. 3, pp. 165–177, 2007.
[15] A. Fouly, M. N. A. Nasr, A. M. R. Fath El Bab, and A. A. Abouelsoud, “Design and modeling of micro tactile sensor with three contact tips for self-compensation of contact error in soft tissue elasticity measurement,” IEEJ Trans. Electr. Electron. Eng., vol. 10, pp. S144–S150, 2015.
[16] A. Fouly, A. M. R. FathEl-Bab, M. N. A. Nasr, and A. A. Abouelsoud, “Modeling and experimental testing of three-tip configuration tactile sensor for compensating the error due to soft tissue surface irregularities during stiffness detection,” Meas. J. Int. Meas. Confed., vol. 98, pp. 112–122, 2017.
[17] K. Suwanratchatamanee, M. Matsumoto, and S. Hashimoto, “Robotic Tactile Sensor System and Applications,” IEEE Trans. Ind. Electron., vol. 57, no. 3, pp. 1074–1087, 2010.
[18] K. Suwanratchatamanee, M. Matsumoto, and S. Hashimoto, “Haptic sensing foot system for humanoid robot and ground recognition with one-leg balance,” IEEE Trans. Ind. Electron., vol. 58, no. 8, pp. 3174–3186, 2011.
[19] I. Peterlík and J. Filipovič, “Distributed construction of configuration spaces for real-time haptic deformation modeling,” IEEE Trans. Ind. Electron., vol. 58, no. 8, pp. 3205–3212, 2011.
[20] R. Aoyagi and T. Yoshida, “Frequency equations of an ultrasonic vibrator for the elastic sensor using a contact impedance method,” Japanese J. Appl. Physics, Part 1 Regul. Pap. Short Notes Rev. Pap., vol. 43, no. 5 B, pp. 3204–3209, 2004.
436, 2008.
[22] M. . Lee and H. . Nicholls, “Review Article Tactile sensing for mechatronics—a state of the art survey,” Mechatronics, vol. 9, no. 1, pp. 1–31, 1999.
[23] T. Tsuji, Y. Kaneko, and S. Abe, “Whole-body force sensation by force sensor with shell-shaped end-effector,” IEEE Trans. Ind. Electron., vol. 56, no. 5, pp. 1375–1382, 2009.
[24] R. Cecchi et al., “Development of micro-grippers for tissue and cell manipulation with direct morphological comparison,” Micromachines, vol. 6, no. 11, pp. 1710–1728, 2015.
[25] J. Engel, J. Chen, Z. Fan, and C. Liu, “Polymer micromachined multimodal tactile sensors,” Sensors Actuators, A Phys., vol. 117, no. 1, pp. 50–61, 2005.
[26] W. C. Hayes, L. M. Keer, G. Herrmann, and L. F. Mockros, “A mathematical analysis for indentation tests of articular cartilage,” J. Biomech., vol. 5, no. 5, pp. 541–551, 1972.