10 | International Journal of Computer Systems, ISSN-(2394-1065), Vol. 03, Issue 01, January, 2016 Available at http://www.ijcsonline.com/
Content-Based Image Retrieval through Clustering
Prasad BanothA, K AnilB, P Aruna SreeC
A
Assoc. Prof., Dept. of CSE, MLRITM, Hyderabad, India. BAsst. Prof., Dept. of CSE, MLRITM, Hyderabad, India. C
Asst. Prof., Dept. of CSE, MLRITM, Hyderabad, India.
Abstract
The field of image retrieval has been an active research area for several decades and has gained steady momentum in recent years as a result, large collection of digital images are growing day by day in government, hospitals, banking, etc. Interest in image retrieval has increased in large part due the rapid growth of the World Wide Web. With the proliferation of image data, the need to search and retrieve images efficiently and accurately from a large collection of image databases has drastically increased. Query based text retrieval from database is done through tools like SQL, MYSQL etc. In this process we consider constraint based query to retrieve text records from database. But image retrieval is not as easy as query processing. For this proposed system a broad literature survey of data mining technique have been made. Clustering technique has been identified as best suited for this system. In clustering technique there exist algorithms like BIRCH, CURE, DBSCAN, STING, K-Means, K-Medoids etc, out of which K-Means have been chosen as best suited algorithm for the proposed system. In Image retrieval Shape and Color of an object plays an important role. To address such a demand, Content-Based Image Retrieval (CBIR) through Clustering is proposed in this system for implementing CBIR system and identifying cluster of images for medical applications. With this process, the knowledge discovery through pattern recognition is carried out, through which the medical researchers can take predictive measures.
Keywords: Image Retrieval, CBIR, CBIR-C, Distributed database, Local Database, Interface Unit, Inter Cluster, Intra Cluster, Clustering, K-Means, Enhanced K-Means, Automatic K generation and Color Histogram..
I. INTRODUCTION
There has been an explosive growth in the acquisition and use of images in health care data. Interest in image retrieval [3] [15] has increased in large part due the rapid growth of the World Wide Web. In current systems, retrieval of image information is done using text keywords in special fields in the image header (e.g., patient identifier). Since these key Words do not capture the richness of features depicted in the image itself, content based Image retrieval (CBIR) [9][13] has received significant attention in the literature as a promising technique to facilitate improved image management. In our proposed system, rather than limiting queries to textual keywords, users can also provide an example image or image feature (e.g., color, texture, or shape computed from a region of interest) to find similar images of the same modality, anatomical region and disease .CBIR [9] [13] requires specialized methods specific to each image type and content detail. Some systems tend to focus on particular image types, while others that are less specific with respect to particular anatomy tend to concentrate more on image discrimination by overall appearance, and any pathological similarity is only in the gross overall view. Earlier efforts in CBIR [9] [13] system have been focused on effective feature representations for images. Hear the performance enhancement to retrieve cluster of image is done through K-Means clustering algorithm. The process of indexing plays an important role to retrieve cluster of images. But image retrieval is not as easy as query processing. In Image retrieval Shape [13] [14] and Color
of an object plays an important role. To address such a demand, Content-Based Image Retrieval (CBIR) through Clustering technique [2] [5] [7] is proposed in this system.
At present, there are some commercial image search engines available on the Web such as Google Image Search and AltaVista Image Search. Most of them employ only the keyword based search and hence the retrieval result is not satisfactory. With the advances in image processing, information retrieval, and database management, there have been extensive studies on content-based image retrieval (CBIR) for large image databases. CBIR [8] [13] systems retrieve images based on their visual contents. Earlier efforts in CBIR research have been focused on effective feature representations for images. The visual features of images, such as color [11] [14], texture, and shape [13] [12] features have been extensively explored to represent and index image contents, resulting in a collection of research prototypes and commercial systems.
There are also some integrated search engines employing both the keyword-based search and content-based image. In data mining there exist many techniques such as Association Rule Mining, Classification and prediction, Cluster Analysis, Outlier Analysis and Evolution Analysis. Out of all the above techniques, clustering has been identified as the best technique for the CBIR-C system.
clustering algorithm [2] [5] finds the centroid of a group of data sets. To determine cluster membership, most algorithms evaluate the distance between a point and the cluster centroids. The output from a clustering algorithm [2] [5] is basically a statistical description of the cluster centroids with the number of components in each cluster
II. CBIR-C SYSTEM ARCHITECTURE CBIR-C [7] [13] system is used to recognize pattern through knowledge discovery [4] in database for image database. As it is not an easy task like retrieving text data, content base image retrieval through clustering technique [2] [5] has been used for pattern reorganization.
The architecture of the proposed scheme is demonstrated in Figure 1. As can be seen from this figure 1, CBIR-C system framework contains major components, namely distributed database, Local database, interfacing unit, clustering process, CBIR-C unit, and Input Out put phase. In brief, given a set of image databases and the associated log data, a data mining process is conducted for intra-database [8] knowledge discovery and summarization. Then the similarity measures [9] among the databases are calculated via probabilistic reasoning. With the summarized database-level knowledge [8], a conceptual database [8] clustering process is carried out. Note that our framework is flexible in the sense that any database clustering strategy can be easily plugged in, as long as it has the capability to partition the databases into a set of database clusters. However, our conceptual database [8] clustering process is highly effective. Thereafter, cluster-level knowledge [8] summarization is applied to discover the intra-cluster [8] knowledge and explore the inter-cluster relationships. Finally, image retrieval is conducted in the intra-cluster [8] or inter-cluster [8] level based on the obtained cluster-level knowledge. The CBIR-C architecture are decomposed into modules as Data Collection Phase, Interface Unit, K-Means Clustering, CBIR-C phase, Input/Output phase.
In Data Collection Phase image data is gathered from distributed environments such as Database, data warehouse, www, or other information repository, data cleaning [1] and data integration [1] techniques may be performed on the data. This phase is the combination of Distributed Database and Local Database. The image data distributed in World Wide Web are known as distributed database. These distributed databases are processed through content based image retrieval [3] [15].The data bases which are stored locally from processing end are known as local database. Interface Unit is the combination of inter cluster and intra cluster image discovery. When the image data are clustered from World Wide Web it is known as discovery of inter cluster level. When the image data are clustered from Local database it is known as discovery of Intra cluster level [8]. The most well known and commonly used partitioning method is K-means. The K-means algorithm takes the input parameter, K, and partitions a set of n object into K clusters so that the resulting intracluster similarity is high but the intercluster simililarity is low. Cluster similarity is measured in regard to the mean value of the objects in a cluster, which can be viewed as the clusters center of gravity. The main drawback of implementing the general K- Means algorithm
is that the cluster number K is previously known or given by the user. According to the number given in K, the clusters are formed. The main drawback of getting the cluster number from the user is that the user may not be aware of what number should be given. The user my not know in advance the number to be given and a wrong number results in meaningless results which results in performance degradation. Moreover the discovery of a right number is also tedious. Hence an alternative solution to this problem is the algorithm for automatic K detection (AKD). Content-based image retrieval (CBIR) is a image retrieval [2] [5] system, which aims at avoiding the use of textual descriptions and instead retrieves images based on their visual similarity to a user-supplied query image or user-specified image features. "Content-based" means that the search will analyze the actual contents of the image. The term 'content' in this context might refer colors, shapes, textures, or any other information that can be derived from the image itself. Without the ability to examine image content, searches must rely on metadata such as captions or keywords, which may be laborious or expensive to produce. In Input/output Phase content based query is given through input unit and results obtained for that content based query are produced as output.
Fig 1: Architecture of the CBIR-C system
III. GENERAL K-MEANS ALGORITHM The K- Means is known as a partitional method as the user first predefines the number of clusters after which the algorithm partitions the data iteratively until a solution is found. As hierarchical clustering sorts data out into previously unknown clusters, K-Means actually assigns data between predefined partitions- the problem to solve is which cluster each data point belongs to. Thus the K-Means clustering is usually the most preferred method due to its simplicity.
points in the cluster- that is, its coordinates are the arithmetic mean for each dimension separately over all the points in the cluster. This algorithm takes the input parameter k, and partitions the set of n objects into k clusters so that the resulting intra cluster similarity is high whereas the inter cluster similarity is low. Similarity is measured by the minimum distance between the points in the clusters, maximum distance between the points in the clusters and average distance between the points in clusters.
If the number of datasets is less than the number of clusters then each data is assigned as centroid of the cluster. Each centroid will have a cluster number. If the number of data is bigger than the number of cluster, for each data, the distance is calculated with all centroid and the minimum distance is found. This data is said to belong to the cluster that has the minimum distance from this data.
A. SIMILARITY MEASURE
Since similarity is fundamental to the definition of a cluster, a measure of similarity between two patterns drawn from the same feature space is essential to most clustering procedures. Because of the variety of features and types and scales, the distance measure (or measures) must be chosen carefully. It is most common to calculate the dimensionality between two patterns using a distance measure defined on the feature space. Here we focus on the well- known distance measures used for patterns whose features are all continuous. The most popular distance metric is the Euclidean distance. The Euclidean distance has an intuitive appeal as it is commonly used to evaluate the proximity of objects in two or three dimensional space. It works well when a data set has “compact” or “isolated” clusters.
B. PROCEDURE FOR GENERAL K- MEANS
ALGORITHM
An algorithm is given below for the general K- Means algorithm
for j=0 to k-1
Cluster[j] [x] = (((max(x)-min(x))/ (k*1)) +1) min(x) Cluster[j] [y] = (((max(y)-min(y))/ (k*1)) +1) min(y) Do for i=0 to n-1 for j=0 to k-1 {
distance objects[i]- clustering[j] d (i ,j)sqrt((xi-xj)^2+(yi-yj)^2) if d (i, j) < d (min)
nj if cluster[i] is not in n Cluster[i] =n }
new_cluster[n] new_cluster[n]+object[i] new_cluster_size[n]new_cluster_size[n]+1 for j=0 to k-1
Cluster[j][*]=new_cluster[j][*]/new_cluster_size[j] new_cluster0
new_cluster_size0 while (cluster stable);
C. ALGORITHM FOR AUTOMATIC K DETECTION
The main drawback of implementing the general K- Means algorithm is that the cluster number K is previously known or given by the user. According to the number given in K, the clusters are formed. The main drawback of getting the cluster number from the user is that the user may not be aware of what number should be given. The user my not know in advance the number to be given and a wrong number results in meaningless results which results in performance degradation. Moreover the discovery of a right number is also tedious. Hence an alternative solution to this problem is the algorithm for automatic K detection (AKD).
Both of the K- Means and the AKD algorithms are iterative procedures. In general, both of them assign first an arbitrary initial cluster vector. The second step classifies each data set to the closest cluster. In the third step the new cluster mean vectors are calculated based on all the data sets in one cluster. The second and third steps are repeated until the "change" between the iteration is small. The "change" can be defined in several different ways; either by measuring the distances the mean cluster vector has changed from one iteration to another.
The AKD algorithm has some further refinements i.e. splitting and merging of clusters. Clusters are merged if either the number of members (data sets) in a cluster is less than a certain threshold or if the centers of two clusters are closer than a certain threshold. Clusters are split into two different clusters if the cluster standard deviation exceeds a predefined value and the number of members (data sets) is twice the threshold for the minimum number of members. The AKD algorithm is similar to the k-means algorithm with the distinct difference that the Isodata algorithm allows for different number of clusters while the k-means assumes that the number of clusters is known a priori.
D. Procedure for AKD algorithm
Step 1. Specify the following process parameters:
K = number of cluster centers desired thetaN = a parameter against which the number of samples
in a cluster domain is compared
thetaS = standard deviation parameter
thetaC = lumping parameter
L = maximum number of pairs of cluster centers which can
be lumped
I = number of iterations allowed
Step 2. Distribute the N samples among the cluster centers, using the relation,
for all x element of Sj if || x - zj || < || x - zi ||
for all i = 1, 2... Nc, i! = j, where Sj denotes the set of cluster samples whose cluster center is zj. Ties in this expression are resolved arbitrarily.
Step 3. Discard sample subsets with fewer than thetaN members; that is, if for any j, Nj < thetaN, discard Sj and reduce Nc by 1.
Step 4. Update each cluster center by setting it equal to the sample mean of its corresponding set Sj; that is:
where Nj is the number of samples in Sj.
Step 5. Compute the average distance D'j of the samples in cluster domain Sj from their corresponding cluster center, using the relation
D'j = 1/Nj (Summation x element of Sj -> || x - zj ||), j = 1,2,...,Nc
Step 6. Compute the overall average distance of the samples from their respective cluster centers, using the relation D' = 1/N (Summation from j = 1 to Nc -> NjD'j)
Step 7. (a) if this is the last iteration, set thetaC = 0 and go to Step 11. (b) if Nc <= K/2 go to Step 8. (c) If this is an even-numbered iteration, or if Nc >= 2*K, go to Step 11; otherwise, continue.
Step 8. Find the standard deviation vector deltaj = (delta1j, delta2j, . . , deltanj)for each sample subset, using the relation
deltaij = Square Root ( 1/N(Summation x element of Sj -> (xik - zij)^2)),
i = 1, 2,.., n; j = 1,2,...,Nc
where n is the sample dimensionality, xik is the ith component of the kth sample in Sj, zij is the ith component of zj, and NJ is the number of samples in Sj. Each component of deltaj represents the standard deviation of the sample in Sj along a principle axis.
Step 9. Find the maximum component of each deltaj, j = 1,2,3,..,Nc and denote it by deltajmax.
Step10. If for any deltajmax, j = 1,2,..,Nc we have deltajmax > thetaS and
(a) D'j > D' and Nj > 2*(thetaN + 1) or (b) Nc <= K/2
then split zj into two new cluster centers zj+ and zj-, and increase Nc by 1. Cluster zj+ is formed by adding a given quantity yj to the component of zj which corresponds to the maximum component of deltaj; zj- is formed by subtracting yi from the same component of zj. One way of specifying yj is to let it be equal to some fraction of deltajmax, that is, yj = k*deltajmax, where 0 <= k <= 1.
The basic requirement for choosing yj is that it be sufficient to provide a detectable difference in the distance from an arbitrary sample to the two new cluster centers, but not large enough as to change the overall cluster domain arrangement appreciably. If splitting took place in this step, go to Step 2; otherwise continue.
E. ANALYSIS OF K GENERATION
The graph shown below in fig 1 is the graphical analysis of the implemented automatic K detection algorithm. The X plot represents the number of data points in each cluster and the Y plot represents the number of iterations carried out. The graph clearly shows the efficiency of the algorithm as the number of iteration rises. The cluster number K becomes constant after undergoing an initial merge and split procedure.
Fig : 1 Analysis of auto K algorithm
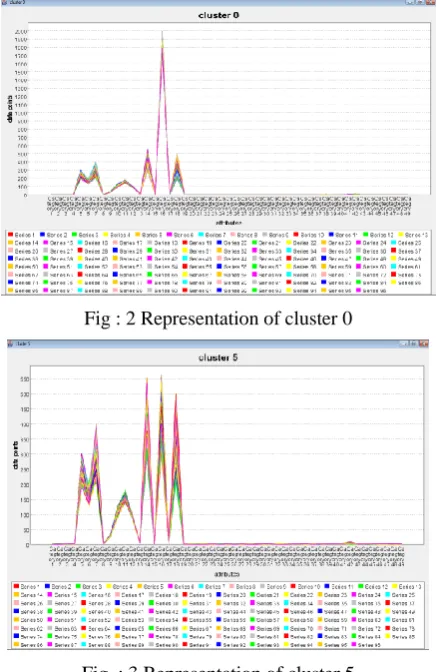
The alike medical records are grouped into similar clusters. The figs 2 to 4 represent the plot of different clusters. The X plot the attributes and the Y plot represents the data values of these attributes. The analysis of these clusters helps us identify meaningful patterns. For example already known features like the patients venous plasma glucose level is relative to the fasting sugar level can be obtained. Another recognized feature is that the patients who are chain smokers are prone to have more problems in diabetes than the normal patients.
IV. CBIR-C PHASE
Content-based image retrieval (CBIR) is a image retrieval [2] [5] system, which aims at avoiding the use of textual descriptions and instead retrieves images based on their visual similarity to a user-supplied query image or user-specified image features.
Fig : 2 Representation of cluster 0
"Content-based" means that the search will analyze the actual contents of the image. The term 'content' in this context might refer colors, shapes, textures, or any other information that can be derived from the image itself. Without the ability to examine image content, searches must rely on metadata such as captions or keywords, which may be laborious or expensive to produce. In Image retrieval Shape and Color of an object plays an important role. To address such a demand, Content-Based Image Retrieval (CBIR) through Clustering is proposed in this system for implementing CBIR system and identifying cluster of images for medical applications. With this process, the knowledge discovery through pattern recognition is carried out, through which the medical researchers can take predictive measures. CBIR-C system framework contains major components, namely distributed database, Local database, interfacing unit, clustering process, CBIR-C unit, and Input Out put phase. In this chapter we mainly concentrate on color histogram techniques [16].
A. COLOR
Retrieving images based on color similarity is achieved by computing a color histogram [16] for each image that identifies the proportion of pixels within an image holding specific. Current research in this area attempts to segment color proportion by region and by spatial relationship among several color regions.
4.1.1 COLOR HISTOGRAM
Color is a commonly used feature for realizing content-based image retrieval CBIR). There are many approaches for CBIR which is based on well known and widely used color histograms [16].
Using a single color histogram [16]for the whole image, or
Local color histograms [169] for a fixed number of image cells,
The one we propose (named Color Shape) uses a variable number of histograms, depending only on the actual number of colors present in the image. Existing color-based [11] [14] general-purpose image retrieval systems roughly fall into three categories depending on the signature extraction approach used: histogram, color layout, and region-based search. And, in this project, histogram-based search methods are investigated in two different color spaces. A color space is defined as a model for representing color in terms of intensity values. Typically, a color space defines a one- to four- dimensional space. A color component, or a color channel, is one of the dimensions. Color spaces are related to each other by mathematical formulas. In this project, only two three-dimensional color spaces, RGB and HSV, are investigated. Histogram search characterizes an image by its color distribution, or histogram. Many histogram distances have been used to define the similarity of two color histogram representations. Euclidean distance and its variations are the most commonly used. The drawback of a global histogram [16] representation is that information about object location, shape, and texture is discarded. The global color histogram [16] indexing method, which is used in this project, correlates to the image semantics well. But,
images retrieved by using the global color histogram may not be semantically related even though they share similar color distribution.
B. SHAPE
Shape of an object is an important feature for image and multimedia similarity retrievals. There is a variety of techniques that has been proposed in the literature for shape representation. Shape representation techniques are divided into two categories: Boundary-Based methods use only the border of the object shape and completely ignore its interior. On the other hand, the Region-Based techniques take into account internal details besides the boundary details.
The main objective of shape description in object recognition is to measure geometric attributes of an object, that can be used for classifying, matching, and recognizing objects. Shape description techniques tend to perform better in some application domains than others. For example, region-based techniques (take into amunt internal details like holes) are more suitable than the boundary-based techniques when internal details of the objects are as important as their contour. The region-based methods are further broken into spatial and transform domain sub-categories depending on whether direct measurements of the shape are used or a transformation is applied. A drawback of this categorization is that it does not further sub-categorizes boundary based methods into spatial domain and transform domain methods.
V. CONCLUSION
The CBIR-C system is tested for its performance in various testing phase. The testing phases were conducted to identify the bottlenecks in the system and to evaluate the time complexity of the implemented algorithms. The time complexity of the implemented auto K generation algorithm proved to be more efficient than the existing algorithms. Moreover the algorithm used to fill in the missing values proved to work efficiently without disturbing the clusters. The missing values filled in by the algorithm are meaningful and related to the domain. All the medical fields are taken to consideration for clustering. Alike records are identified by the system and put in similar clusters. These formed clusters are helpful for pattern recognition. The patterns identified using the system is provided to medical practitioners and researchers, which can help them, take predictive measures based on these patterns. The CBIR-C system is carried out for lesser amount of data and is also restricted to a particular domain. This system can further extended to any domain or may even be used to carry analysis on other diseases.
REFERENCES
[1] Jiawei Han, Micheline Kamber, “Data Mining: Concepts and Techniques”, Morgan Kaufmann Publishers, 2001.
[2] Pavel Berkhin, “Survey of Clustering Data Mining Techniques”. [3] A.Goodrum, “Image Information Retrieval: An overview of Current
Research”, Special Issue on Information Science Research, Vol.3, No 2, March 2000.
[4] Maria Halkidi, Yannis Batistakis, Michalis Vazirgiannis, “On Clustering Validation Techniques”, A survey on KDD and clustering Techniques, Department of Informatics, Athens University of Economics & Business.
[6] L. Lucchese and S. K. Mitra, “Color Image Segmentation: A State-of-the Art Survey”, "Image Processing, Vision, and Pattern Recognition," Proc. of the Indian National Science Academy (INSA-A), New Delhi, India, Vol. 67 A, No. 2, pp. 207-221, 2001. [7] Mei-Ling shyu, shu-Ching chen, Min Chen, Chengcui Zhang, “ A
Unified Frame work for Image Database Clustering and Content-based Retrieval”, ACM Digital Library, MMDB, November 2004. [8] Chen, Y. and Wang, J. Z. ,“A Region-based Fuzzy Feature
Matching Approach to Content-based Image Retrieval”, IEEE Transactions on Pattern Analysis and Machine Intelligence, 24, No. 9 , September 2002.
[9] Apostol Natsev, Rajeev Rastogi, and Kyuseok Shim, “WALRUS: A Similarity Retrieval Algorithm for Image Databases”, IEEE Transactions on Knowledge and Data Engineering, Vol.16, no.3, March 2004.
[10] Safar, M., Shahabi, C. and Sun, X. “Image Retrieval by Shape: A Comparative Study”, In Proceedings of IEEE International Conference on MM and Expo(ICME’00), 2000, 141-144.
[11] Stehling, R. O., Nascimento, M. A., and Falcao, A. X. , “On Shapes of Colors for Content-based Image Retrieval”, In ACM International Workshop on MMInformation Retrieval (ACM MIR’00), 2000, 171-174.
[12] Zhang, D. S. and Lu, G, “Generic Fourier Descriptors for Shape-based Image Retrieval”, In Proceedings of IEEE International Conf on MM and Expo (ICME’02), 1 (2002), 425-428.
[13] Shyu, M.-L., Chen, S.-C., Chen, M., and Zhang, C, “Affinity Relation Discovery in Image Database Clustering and Content-based Retrieval”, Accepted for publication (short paper), ACM International Conference on Multimedia, October 10-16, 2004. [14] Chengcui Zhang, Shu-Ching Chen, and Mei-Ling Shyu, “Multiple
Object Retrieval for Image Databases Using Multiple Instance Learning and Relevance Feedback”, IEEE Int. Conf. on MM and Expo (ICME), 2004.
[15] Yong Rui, Thomas Huang and Shih-Fu Chang, “Image Retrieval: Current Techniques, Promising Directions, and Open Issues”, Published in the Journal of Visual Communication and Image Representation.
[16] Sangoh Jeong, “ Histogram-Based Image Retrieval”, A Project Report.
[17] HK J Paediatr, “Clinical Guidelines and Evidence-Based Medicine”, A Clinical Guidelines survey.