R E S E A R C H A R T I C L E
Open Access
Complementary feeding practices, dietary
diversity, and nutrient composition of
complementary foods of children 6
–
24
months old in Jimma Zone, Southwest
Ethiopia
Sirawdink Fikreyesus Forsido
1,3*, Nejat Kiyak
1, Tefera Belachew
2and Oliver Hensel
3Abstract
Background:Mothers and caregivers typically feed infants according to their culture, purchase power and level of awareness with no due diligence to nutritional quality of the diet. Scientific evidence on nutritional adequacy of predominant complementary foods is critical for planning and prioritising interventions. The purpose of the current study was to evaluate the quality of complementary foods and the optimality of complementary feeding practices in Southwest Ethiopia.
Methods:In this cross-sectional study, a stratified multistage sampling procedure was used to sample 433 children, 6–24 months old. A semi-structured questionnaire was used to collect demographic, socio-economic and dietary data. Dietary diversity score was measured using a 24-h dietary recall. Six customary complementary food types were assayed for proximate composition, energy and mineral density using standard methods. Adequacy of the complementary foods in nutrients for complementary feeding purposes was assessed as a ratio between actual composition and recommended composition of complementary foods.
Results:Only 16.1% of the children get the minimum dietary diversity. The children were reported to be fed with cereals & grains (68.8%), discretionary calories (53.6%), protein-rich foods (44.6%), oils and fat (40.5%), vegetables (38. 5%), dairy products (17.9%) and fruits (28.1%). The sampled foods contained 4.3–24.4%, 0.9–8.5%, 8.2–11.9%,
27.9–162.6 Kcal/100 g, 168.4–250.4 mg/100 g, 1.8–4.1 mg/100 g and 22.5–42.4 mg/100 g of total carbohydrate, crude fat, protein, energy content, calcium, zinc and iron, respectively. All the complementary food samples
predominantly fed to children were not composed of adequate protein, fat, carbohydrate, energy and calcium as recommended for complementary feeding purposes. However, most of the complementary foods are composed of adequate iron and zinc.
Conclusions:The nutrient density and diversity of complementary foods of 6–24-month-old children in the study area were found to be sub-optimal. Upgrading the nutritional composition of the starchy complementary foods should be of highest priority to improve nutrition of the infants and young children.
Keywords:Dietary diversity, Nutrient adequacy, Complementary foods, Proximate composition
© The Author(s). 2019Open Access This article is distributed under the terms of the Creative Commons Attribution 4.0 International License (http://creativecommons.org/licenses/by/4.0/), which permits unrestricted use, distribution, and reproduction in any medium, provided you give appropriate credit to the original author(s) and the source, provide a link to the Creative Commons license, and indicate if changes were made. The Creative Commons Public Domain Dedication waiver (http://creativecommons.org/publicdomain/zero/1.0/) applies to the data made available in this article, unless otherwise stated. * Correspondence:[email protected]
1
Department of Agricultural and Biosystems Engineering, Faculty of Organic Agricultural Sciences, University of Kassel, Witzenhausen, Germany
3Department of Post-Harvest Management, College of Agriculture and
Background
Complementary feeding refers to supplementing breast-feeding with breast-feeding children aged between 6 and 24 months with a wide range of foods [10]. The period be-tween 6 and 24 months of age is a time of nutritional vulnerability because during this period, nutrients espe-cially micronutrients and energy obtained only from breast milk will not be sufficient to meet the require-ments of the child [22]. Ensuring adequate nutrition during the period between 6 and 24 months of age is a major global health priority [10].
Among the immediate causes of undernutrition among children is consumption of too few nutrients [5]. In most low-income countries, including Ethiopia, the be-ginning of growth faltering coincides with the start of complementary feeding; age-specific malnutrition rates generally increase until about 24 months of age and then level off [20]. The sharp rise in the occurrence of stunt-ing in young children from the age of 6 months is usu-ally associated with suboptimal complementary feeding practices [9]. As children younger than 24 months old do not consume a sufficient amount of food to cover the high nutrient needs for growth and development, food given to them should be of high nutrient density [10].
Theoretically, infants should receive the most nutrient-dense diet in the family. Infants in low-income countries, however, are typically fed with nutrient-poor foods like thin porridges [10]. Complementary foods should contain high-biological value protein, further-more, vitamins and minerals [25].
The National Nutrition Strategy (NNS) of Ethiopia gives considerable emphasis for nutrition of children younger than 2 years old in particular as nutrition re-ceived during this period influences how the children develop, grow and learn now or later. There is no documented evidence of overall complementary feed-ing practices and adequacy of the complementary foods in nutrients in Jimma Zone. This information is critically needed to be able to judge and plan the mechanisms to upgrade traditional diets. Therefore, this study aimed to evaluate the complementary feed-ing practices, dietary diversity and nutrient adequacy of complementary foods of children 6–24 months old in Jimma Zone, Southwest Ethiopia.
Methods Area and subjects
This study was conducted in Jimma Zone, Southwest Ethiopia. The study area is year-round green but un-fortunately characterised by household food insecurity [4]. Three districts were purposively selected based on their agricultural production; Omo Nada, Dedo and Mana are cereal, vegetable and cash crop producer areas, respectively.
This study is a component of a more prominent cross-sectional study which assessed the nutritional sta-tus and associated factors among children younger than 2 years old. The study population for the original re-search included all children younger than 2 years old in the study area. A multistage stratified sampling proced-ure was used to sample 558 children who were 0–24 months old [14]. For the current study, only those chil-dren 6–24 months old were included.
Data collection
Data were collected from mothers or caregivers of the infants and children using face-to-face interviews using a semi-structured questionnaire.
Variables
The variables were categorised as dependent and inde-pendent variables. The deinde-pendent variable was the diet-ary diversity score of the 6–24-month-old children. The independent variables included several socio-economic and demographic factors like family composition, house-hold size, educational level attained by mothers and fa-thers, the occupation of mothers and fafa-thers, the wealth of the household and education or training received on health and nutrition. Additionally, the infant- and young child-feeding (IYCF) practices were also assessed.
Measurements
Diet diversity
A single 24-h dietary recall was used to obtain data on dietary diversity. Dietary diversity was assessed with a scale of seven food groups namely cereals and grains, vegetables, fruits, dairy products, oil and fat, protein-rich foods and discretionary calorie foods. Dietary diversity score (DDS) was found to be optimal when a child is fed greater than four food groups per day [23].
Nutrient composition of complementary foods
Nutrient adequacy of the complementary foods
Adequacy of the complementary foods in nutrients for complementary feeding purposes was assessed as a ratio between actual composition and recommended compos-ition of complementary foods [13].
Statistical analysis
The data were analysed using Statistical Package for Social Sciences software version 20 (SPSS Inc., Chicago, IL, USA). Descriptive statistics such as percentages were cal-culated. Bivariate analysis was conducted for the dietary diversity data.P values of less than 0.05 were regarded as statistically significant.
Results
Characteristics of the sample
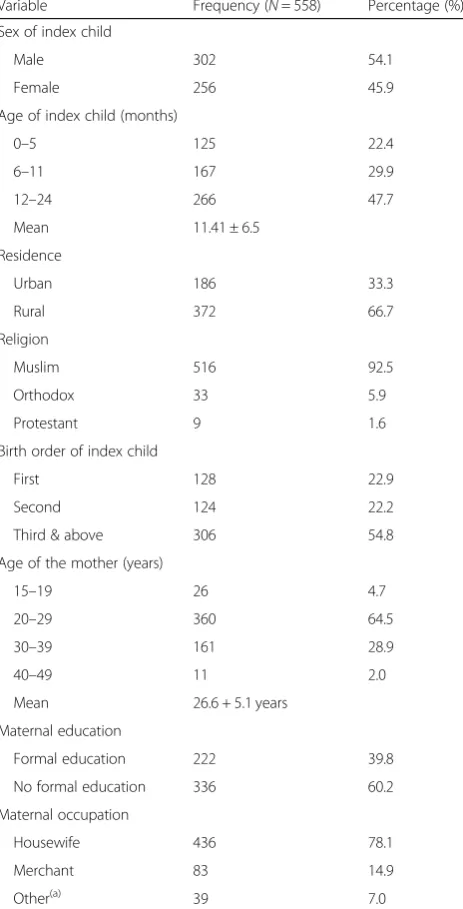
Table 1 presents the socio-demographic characteristics of the respondents. Fifty four percent of the children in this study were male and 46% were female. Four hun-dred thirty-three out of 558 children included in the study were aged 6–24 months old. The larger part of the participants 372 (66.7%) were rural residents. A majority of the participants 516 (92.5%) was Muslims in religion. More than half of the children 306 (54.8%) were third and above in their birth order. Additionally, majority of the mothers 360 (64.5%) were aged 20–29 years old. Re-garding literacy, larger part of the participants 336 (60.2%) did not attend formal education. A large propor-tion of the mothers 436 (78.1%) were housewives.
Complementary feeding practices
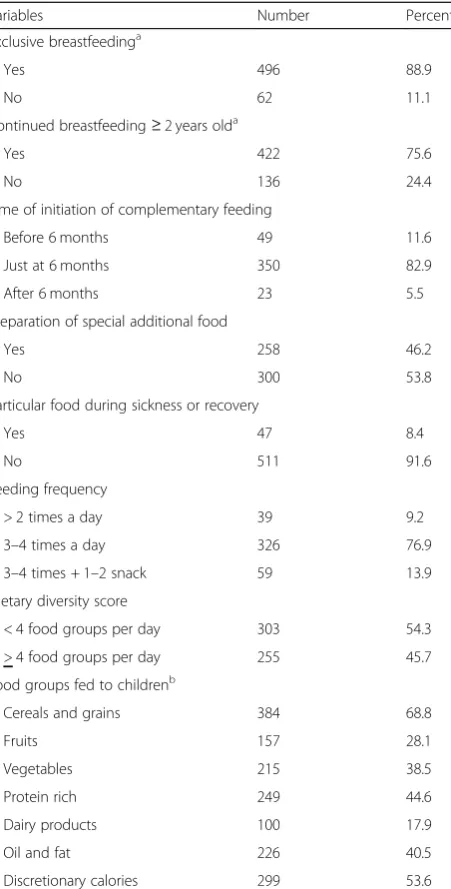
Table2 shows the infant- and young child-feeding prac-tices in the study area. The majority (88.9%) of the chil-dren were exclusively breastfed, and 75.6% were breastfed up to the age of 2 years. Both early and late initiation of additional food was practised extensively in the study area, but most (82.9%) of the mothers started to give comple-mentary food to their children just at 6 months. However, nearly half of the mothers (53.8%) do not prepare any par-ticular complementary food other than the typical family dish while the rest make some other additional foods of which gruel orAtmitis the predominant one. At the same point, almost all (91.6%) of the mothers do not prepare any particular food to their children during sickness or re-covery from disease. The study also signified that 96.7% of the mothers feed their children 3–4 times a day.
Regarding dietary intake, two thirds (68.8%) of the study participants consumed cereal-based gruel (made of barley, oat, teff, wheat, sorghum). Nearly half (44.6%) of the study participants reported that they fed their chil-dren with protein-rich food before the survey and (53.6%) of the study subjects consumed discretionary calories in the previous 24 h. Fruits, vegetables and dairy
products were consumed by 28.1%, 38.5% and 17.9% of the participants, respectively.
Dietary diversity
Table3presents the dietary diversity of the study partici-pants. Majority of the children (83.9%) did not get the minimum dietary diversity. Dietary diversity score was significantly (P< 0.05) influenced by the age and birth order of the child, maternal and paternal education, socio-economic status of the family and paternal occu-pation. Higher dietary diversity was scored among chil-dren aged 12–24 months old, whose birth order was first
Table 1Description of the study participants (Jimma Zone, Southwest Ethiopia, 2014)
Variable Frequency (N= 558) Percentage (%)
Sex of index child
Male 302 54.1
Female 256 45.9
Age of index child (months)
0–5 125 22.4
6–11 167 29.9
12–24 266 47.7
Mean 11.41 ± 6.5
Residence
Urban 186 33.3
Rural 372 66.7
Religion
Muslim 516 92.5
Orthodox 33 5.9
Protestant 9 1.6
Birth order of index child
First 128 22.9
Second 124 22.2
Third & above 306 54.8
Age of the mother (years)
15–19 26 4.7
20–29 360 64.5
30–39 161 28.9
40–49 11 2.0
Mean 26.6 + 5.1 years
Maternal education
Formal education 222 39.8
No formal education 336 60.2
Maternal occupation
Housewife 436 78.1
Merchant 83 14.9
Other(a) 39 7.0
(a)
and whose parents were formally educated. Children whose fathers are not farmers and children living in homes with higher wealth status also had higher DDS.
Nutrient composition of complementary foods
The macronutrient composition and energy contents of the complementary foods are presented in Table4. The moisture, total carbohydrate, protein, crude fat, total ash, crude fibre and energy content of the sampled com-plementary foods ranged between 58.4 and 79.6%, 4.29 and 24.44%, 8.21 and 11.87%, 0.86 and 8.49%, 2.94 and
8.03%, 2.28 and 8.19% and 27.87 and 162.57 cal, respectively.
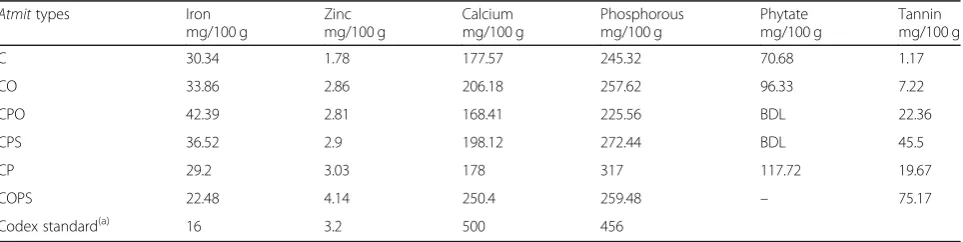
On the other hand, Table5 presents the micronutrient and anti-nutrient composition of complementary foods dominantly consumed by the children. The mineral con-tent ranged between 168.41 and 250.4 mg/100 g, 1.78 and 4.14 mg/100 g, 22.48 and 42.39 mg/100 g and 225.56 and 317 mg/100 g for calcium, zinc, iron, and phosphorus, re-spectively. The anti-nutritional factor contents ranged be-tween BDL (below detection limit) of 117.72 mg/100 g for phytate and 1.17–75.17 mg/100 g for tannin.
Table 2Complementary feeding practices of children 6–24 months old in three districts of Jimma Zone, Southwest Ethiopia, from March to May 2014
Variables Number Percent
Exclusive breastfeedinga
Yes 496 88.9
No 62 11.1
Continued breastfeeding≥2 years olda
Yes 422 75.6
No 136 24.4
Time of initiation of complementary feeding
Before 6 months 49 11.6
Just at 6 months 350 82.9
After 6 months 23 5.5
Preparation of special additional food
Yes 258 46.2
No 300 53.8
Particular food during sickness or recovery
Yes 47 8.4
No 511 91.6
Feeding frequency
> 2 times a day 39 9.2
3–4 times a day 326 76.9
3–4 times + 1–2 snack 59 13.9
Dietary diversity score
< 4 food groups per day 303 54.3
> 4 food groups per day 255 45.7
Food groups fed to childrenb
Cereals and grains 384 68.8
Fruits 157 28.1
Vegetables 215 38.5
Protein rich 249 44.6
Dairy products 100 17.9
Oil and fat 226 40.5
Discretionary calories 299 53.6
a
Sample size = 558
b
Percentages do not add up to 100% as more than one response is possible
Table 3Distribution of child DDS by different variables in Jimma Zone, South West Ethiopia
Variables MDDS
No
n(%)
Yes
n(%)
χ2
(Pvalue)
Child age group
0–5 months 124 (99.2%) 1 (0.8%) 0.000
6–11 months 147 (88.0%) 20 (12.0%)
12–24 months 197 (74.1%) 69 (25.9%)
Birth order of the child
First 99 (77.3%) 29 (22.7%) 0.007
Second 99 (79.8%) 25 (20.2%)
Third and above 270 (88.2%) 36 (11.8%)
Districts
Mana 159 (85.5%) 27 (14.5%) 0.470
Omo Nada 158 (84.9%) 28 (15.1%)
Dedo 151 (81.2%) 35 (18.8%)
Maternal education
Informal education 293 (87.2%) 43 (12.8%) 0.006
Formal education 175 (78.8%) 47 (21.2%)
Paternal education
Informal education 205 (87.2%) 30 (12.8%) 0.041
Formal education 263 (81.4%) 60 (18.6%)
Maternal occupation
Housewife 370 (84.9%) 66 (15.1%) 0.144
Other 98 (80.3%) 24 (19.7%)
Paternal occupation
Farming 296 (86.5%) 46 (13.5%) 0.021
Other 172 (79.6%) 44 (20.4%)
Place of residence
Rural 316 (84.9%) 56 (15.1%) 0.196
Urban 152 (81.7%) 34 (18.3%)
Wealth of households
Poor 162 (87.1%) 24 (12.7%) 0.009
Medium 165 (87.3%) 24 (12.7%)
Nutrient adequacy of complementary foods for complementary feeding purposes
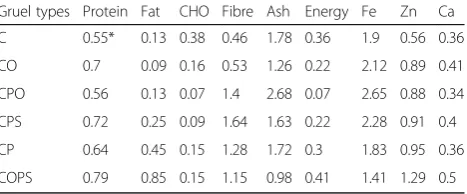
Table6presents nutrients adequacy of the studied com-plementary foods for comcom-plementary feeding purposes. All of the foods did not contain adequate amounts of protein, fat, energy, zinc and calcium (values < 1. On the other hand, most of the diets provide sufficient quan-tities of ash and iron (values > 1). The requirements were not met for any of the nutrients.
Discussion
Complementary feeding practices
Studies in developing countries showed that both too early and a too late introduction of complementary food is familiar. Mothers in South Africa start complementary feeding within 2–3 months. In Uganda, 44.1% and 27% mothers began complementary feeding within 2–3 months in 1997 and 2005, respectively [2]. Our findings oppose these reports because for the majority of the children in the study area complementary feeding is ini-tiated just at the appropriate time.
Contrary to the recommended practice of complemen-tary feeding, the majority of the mothers do not prepare
particular food during sickness or recovery. During an illness, the need for fluid often increases, so a child should be offered and encouraged to take more [6]. However, feeding frequency in the study area was opti-mal for children in the age group of 6–12 but not for those in the age group of 13–24 months. The recom-mended number of meals per day for a healthy breastfed baby should be 2–3 times at 6–8 months, 3–4 times at 9–11 months and 3–4 times with 1–2 additional nutri-tious snacks at 12–23 months of age [25].
The predominant complementary food fed to children in the study areas is gruel (a liquid drink made of ce-reals), locally namedAtmit, ranking first in the all of the three districts. In Ethiopia, 70% of children aged 6–23 months, predominantly consume foods made of grains [7]. Similarly, a study conducted in Nigeria reported that the dominant food groups in the children’s diet were cereal/grains [2]. Nutritional problems are common among populations whose diets are predominantly based on starchy staples [21], and these plant-based foods are low in micronutrient contents, high in phytate and high in dietary fibre which inhibits the absorption of micro-nutrients [17].
Table 4The proximate composition and calorific value of sampled complementary foods (Atmits) in three districts of Jimma Zone, Southwest Ethiopia from March–May, 2014
Atmittypes Fibre (%)
Fat (%)
Ash (%)
Protein (%)
CHO (%)
MC (%)
Calorific value (Kcal/100 g)
C 2.28 1.33 5.34 8.21 24.44 58.4 142.57
CO 2.65* 0.86 3.78 10.49 10.02 72.2 89.78
CPO 6.99 1.27 8.03 8.4 4.29 79.6 27.87
CPS 8.19 2.49 4.9 10.77 5.58 67.8 87.81
CP 6.41 4.49 5.15 9.67 9.78 64.5 118.21
COPS 5.73 8.49 2.94 11.87 9.67 61.3 162.57
Codex standard(a) < 5 10–25 < 3 15 60–75 < 5 400–425
*Calculated from EHNRI [12]
Ccereal,Ooilseed,Ppulse,Sspice
(a)
CODEX CAC/GL 08 [13]
Table 5The mineral and anti-nutritional factor content of sampled complementary foods (Atmits) in three districts of Jimma Zone, Southwest Ethiopia, from March to May, 2014
Atmittypes Iron mg/100 g
Zinc mg/100 g
Calcium mg/100 g
Phosphorous mg/100 g
Phytate mg/100 g
Tannin mg/100 g
C 30.34 1.78 177.57 245.32 70.68 1.17
CO 33.86 2.86 206.18 257.62 96.33 7.22
CPO 42.39 2.81 168.41 225.56 BDL 22.36
CPS 36.52 2.9 198.12 272.44 BDL 45.5
CP 29.2 3.03 178 317 117.72 19.67
COPS 22.48 4.14 250.4 259.48 – 75.17
Codex standard(a) 16 3.2 500 456
Ccereal,Ooilseed,Ppulse,Sspice,BDLbelow detectable level
(a)
Dietary diversity
The results of the current study showed that nearly half of the children had sub-optimal dietary diversity. A survey of community-based production complementary foods in four regions of Ethiopia has reported that the highest mean diversity score of 3.4 was observed in Oromia re-gion, followed by Tigray (2.9) Amhara (2.7) and SNNP (2.6) regions. In Oromia region, nearly half (49.4%) of the children had a suboptimal diet diversity [1].
According to our results, children from wealthier house-holds consumed more diversified diets. The ability to pro-duce sufficient food for one’s household at home and generate enough revenue to purchase foods on the market are ways that a family could achieve food security [16].
The results of this study also indicated that girls are fed with less diversified diet compared to their male counterparts. Male gender bias in the intra-household distribution of food and other resources has been re-ported from Ethiopia [15] indicating that girls are less favoured in the resource-constrained environments.
Composition of diets
The complementary foods were predominantly made of starch-based cereals and hence of poor nutritional value, and do not satisfy the infant’s basic needs of protein be-cause they have limited levels of protein both qualitatively and quantitatively. As well, macro- and micronutrients may be insufficient to maintain growth and development, this results in reduced nutritional status in children [25].
Nutrient adequacy of the complementary foods for complementary feeding purposes
Complementary foods should contain the following amount of estimated macronutrients: moisture content of≤5%, an ash content of≤3%, a crude protein content of ≥15%, a crude fat content of 10–25%, a crude fibre content of ≤5% and a carbohydrate content of 64 ± 4%. Additionally, the energy content of 400–425 kcal/100 g, a calcium content of 500 mg/100 g, the iron content of 16 mg/100 g and zinc content of 3.2 mg/100 g are also required [13]. Children younger than 2 years old and
living in developing countries should consume approxi-mately 137–187 g/day, 206–281 g/day and 378–515 g/ day of complementary foods at the age of 6–8 months, 9–11 months and 12–24 months, respectively to meet their energy needs [18]. The total nutrient and energy requirements of healthy breastfeeding infants have been established [11]. The average nutrient and energy that a given complementary food should provide are estimated by subtracting average nutrient and energy content of breast milk from the total nutrient and energy require-ment at each age [24]. The complementary food samples were not adequate in nutrients for complementary feed-ing purposes.
Over and under-reporting of infant dietary intakes is among the reasons that made quantifying infants’ diets difficult. Parents tend to over-report intakes for they do not wish to be seen either to be under-feeding babies or on the one hand not being able to distinguish be-tween food offered to young children and the amount consumed [8].
Conclusions
The feeding practices of 6–24-month-old children in the study area were not satisfactory. Dietary diversity and macronutrient, energy and overall nutrient composition of the complementary foods were below the recommenda-tions. The complementary foods were found to contain ad-equate amounts of iron. Improving the nutrient adequacy of the locally available customary diets through food pro-cessing techniques and a community-based nutritional edu-cation on optimal child feeding are recommended.
Acknowledgements
The authors would like to thank all the mothers and children who participated in this study. We are very grateful to the health extension workers.
Funding
This research was funded by the German Federal Ministry of Education and Research [grant number 031A247A] within the framework of the GlobE initiative through the Reduction of Post-Harvest Losses and Value Addition in East African Food Value Chains (RELOAD) project.
Availability of data and materials
The datasets used and/or analysed during the current study are available from the corresponding author on reasonable request.
Authors’contributions
SFF, TB and OH conceived and designed the experiments. NK and SFF collected the data. SFF, NK and TB analysed the data. SFF, TB and OH contributed reagents/materials/analysis tools. SFF prepared the draft manuscript. TB and OH finalised the manuscript and provided a critical review. All authors have read and approved the final manuscript.
Ethics approval and consent to participate
Ethical clearance was obtained from the Research and Ethical Review Board of Jimma University. Permission to undertake the study was obtained from every relevant authority in Jimma Zone. Each study participant was briefed about the study and offered the opportunity to ask questions. Then oral informed consent was obtained from each participant prior to participation in the study and data was kept confidential. The Ethical Review Board
Table 6Adequacy of the complementary foods in nutrients for complementary feeding purposes
Gruel types Protein Fat CHO Fibre Ash Energy Fe Zn Ca
C 0.55* 0.13 0.38 0.46 1.78 0.36 1.9 0.56 0.36
CO 0.7 0.09 0.16 0.53 1.26 0.22 2.12 0.89 0.41
CPO 0.56 0.13 0.07 1.4 2.68 0.07 2.65 0.88 0.34
CPS 0.72 0.25 0.09 1.64 1.63 0.22 2.28 0.91 0.4
CP 0.64 0.45 0.15 1.28 1.72 0.3 1.83 0.95 0.36
COPS 0.79 0.85 0.15 1.15 0.98 0.41 1.41 1.29 0.5
*This numbers are the ratio between actual composition and recommended
decided to have oral consent as the study was not intervention. In addition, the data collection and consent process were randomly checked by the Ethical Review Board to ensure the ethical undertaking of the research.
Consent for publication
Not applicable.
Competing interests
The authors declare that they have no competing interests.
Publisher’s Note
Springer Nature remains neutral with regard to jurisdictional claims in published maps and institutional affiliations.
Author details
1
Department of Agricultural and Biosystems Engineering, Faculty of Organic Agricultural Sciences, University of Kassel, Witzenhausen, Germany.
2
Department of Population and Family Health, Nutrition Unit, College of Public Health and Medical Sciences, Jimma University, Jimma, Ethiopia.
3
Department of Post-Harvest Management, College of Agriculture and Veterinary Medicine, Jimma University, Jimma, Ethiopia.
Received: 15 August 2018 Accepted: 7 May 2019
References
1. Addis Ababa University. Rapid assessment of community-based production of complementary food in Tigray, Amhara, Oromia and SNNP regions. Addis Ababa: Addis Ababa University; 2010.
2. Ajani SR. An assessment of dietary diversity in six Nigerian states. Afr J Biomed Res. 2010;13:161–7.
3. AOAC International. Official methods of analysis of AOAC International (18th ed.). Gaithersburg: AOAC International; 2005.
4. Belachew T, Lindstrom D, Gebremariam A, Hogan D, Lachat C, Huybregts L, Kolsteren P. Food insecurity, food-based coping strategies and suboptimal dietary practices of adolescents in Jimma Zone Southwest Ethiopia. PLoS One. 2013;8(3):e57643.https://doi.org/10.1371/journal.pone.0057643. 5. Black RE, Allen LH, Bhutta Z a, Caulfield LE, de Onis M, Ezzati M, et al.
Maternal and child undernutrition: global and regional exposures and health consequences. Lancet. 2008;371(9608):243–60.https://doi.org/10. 1016/S0140-6736(07)61690-0.
6. Brown K. A rational approach to feeding infants and young children with acute diarrhoea. Pediatric gastroenterology and nutrition in clinical practice. New York: Marcel Dekker Inc; 2001.
7. Central Statistical Agency [Ethiopia], CSA, Central Statistical Agency, ORC Macro, Central Statistical Agency [Ethiopia], & ORC Macro. Ethiopia demographic and health survey. Addis Ababa and Calverton; 2006. Retrieved fromhttp://www.dhsprogram.com/pubs/pdf/FR179/ FR179[23June2011].pdf.
8. Conn JA, Davies MJ, Walker RB, Moore VM. Food and nutrient intakes of 9-month-old infants in Adelaide, Australia. Public Health Nutr. 2009;12(12): 2448–56.https://doi.org/10.1017/S1368980009005552.
9. Daelmans B, Ferguson E, Lutter CK, Singh N, Pachón H, Creed-Kanashiro H, et al. Designing appropriate complementary feeding recommendations: tools for programmatic action. Matern Child Nutr. 2013.https://doi.org/10. 1111/mcn.12083.
10. Dewey KG. The challenge of meeting nutrient needs of infants and young children during the period of complementary feeding: an evolutionary perspective. J Nutr. 2013;143(12):2050–4.https://doi.org/10.3945/jn.113. 182527.
11. Dewey KG, Brown KH. Update on technical issues concerning complementary feeding of young children in developing countries and implications for intervention programs. Food Nutr Bull. 2003;24. Retrieved fromhttps://www.ncbi.nlm.nih.gov/pubmed/12664525.
12. EHNRI. (1998). Food composition table for use in Ethiopia. Part IV. 1995–1997. Addis Ababa: Ethiopian Health and Nutrition Research Institute. 13. FAO/WHO. 1991. CODEX CAC/GL 08, 1991. Codex Alimentarius: Guidelines
on Formulated Supplementary Foods for Older Infants and Young Children. Vol. 4, FAO/WHO Joint Publications; 1991. p. 144.
14. Faul F, Erdfelder E, Lang A-G, Buchner A. G*Power 3: a flexible statistical power analysis program for the social, behavioural, and biomedical sciences. Behav Res Methods. 2007;39:175–91.https://doi.org/10.3758/BF03193146. 15. Hadley C, Lindstrom D, Belachew T, Tessema F. Ethiopian adolescents’
attitudes and expectations deviate from current infant and young child feeding recommendations. J Adolesc Health. 2008;43:253–9.https://doi.org/ 10.1016/j.jadohealth.2007.01.015.
16. Hadley C, Linzer DA, Belachew T, Mariam AG, Tessema F, Lindstrom D. Household capacities, vulnerabilities and food insecurity: shifts in food insecurity in urban and rural Ethiopia during the 2008 food crisis. Soc Sci Med. 2011;73(10):1534–42.https://doi.org/10.1016/J.SOCSCIMED.2011.09.004. 17. Lopez H, Leenhardt F, Remesy C. New data on the bioavailability of bread
magnesium. Magnes Res. 2004;17(4):335–40.
18. Pan American Health Organization. Guiding principles for complementary feeding of the breastfed child: World Health Organization; 2003. Retrieved fromhttp://www.who.int/maternal_child_ adolescent/documents/a85622/en/.
19. Pomeranz Y, Meloan CE. Food analysis: theory and practice (third). Gaithersburg: ASpern Publishers, Inc; 2000.
20. Shrimpton R, Victora CG, de Onis M, Lima RC, Blössner M, Clugston G. Worldwide timing of growth faltering: implications for nutritional interventions. Pediatrics. 2001;107(5):E75 Retrieved fromhttp://www.ncbi. nlm.nih.gov/pubmed/11331725.
21. Steyn NP, Nel JH, Nantel G, Kennedy G, Labadarios D. Food variety and dietary diversity scores in children: are they good indicators of dietary adequacy? Public Health Nutr. 2006;9(5):644–50 Retrieved fromhttp://www. ncbi.nlm.nih.gov/pubmed/16923296.
22. Udoh EE, Amodu OK. Complementary feeding practices among mothers and nutritional status of infants in Akpabuyo Area, Cross River State Nigeria. SpringerPlus. 2016;5(1):2073.https://doi.org/10.1186/s40064-016-3751-7. 23. USDA. (2005). USDA Food Guide Pyramid (MyPyramid). Retrieved 2 Jan 2014,
from https://www.diet.com/g/usda-food-guide-pyramid-mypyramid?get=usda-food-guide-pyramid-mypyramid.
24. WHO/UNICEF. Complementary feeding of young children in developing countries: a review of current scientific knowledge. Geneva: World Health Organization; 1998.