R E S E A R C H
Open Access
Promoting universal financial protection: health
insurance for the poor in Georgia
–
a case study
Akaki Zoidze
*, Natia Rukhazde, Ketevan Chkhatarashvili and George Gotsadze
Abstract
Background:The present study focuses on the program“Medical Insurance for the Poor (MIP)”in Georgia. Under this program, the government purchased coverage from private insurance companies for vulnerable households identified through a means testing system, targeting up to 23% of the total population. The benefit package included outpatient and inpatient services with no co-payments, but had only limited outpatient drug benefits. This paper presents the results of the study on the impact of MIP on access to health services and financial protection of the MIP-targeted and general population.
Methods:With a holistic case study design, the study employed a range of quantitative and qualitative methods. The methods included document review and secondary analysis of the data obtained through the nationwide household health expenditure and utilisation surveys 2007–2010 using the difference-in-differences method. Results:The study findings showed that MIP had a positive impact in terms of reduced expenditure for inpatient services and total household health care costs, and there was a higher probability of receiving free outpatient benefits among the MIP-insured. However, MIP insurance had almost no effect on health services utilisation and the households’expenditure on outpatient drugs, including for those with MIP insurance, due to limited drug benefits in the package and a low claims ratio. In summary, the extended MIP coverage and increased financial access provided by the program, most likely due to the exclusion of outpatient drug coverage from the benefit package and possibly due to improper utilisation management by private insurance companies, were not able to reverse adverse effects of economic slow-down and escalating health expenditure. MIP has only cushioned the negative impact for the poorest by decreasing the poor/rich gradient in the rates of catastrophic health expenditure. Conclusions:The recent governmental decision on major expansion of MIP coverage and inclusion of additional drug benefit will most likely significantly enhance the overall MIP impact and its potential as a viable policy instrument for achieving universal coverage. The Georgian experience presented in this paper may be useful for other low- and middle-income countries that are contemplating ways to ensure universal coverage for their populations.
Keywords:Catastrophic expenditure, Financial protection, Health insurance for the poor, Service utilisation, Targeting the poor, Universal coverage
Background
Georgia has chosen its own path in reforming the health financing system by allocating general government reve-nues to purchase relatively comprehensive coverage for the poor identified through the means testing system. The focus on priority groups and specifically on the poor segments of the population is a common feature of health financing reforms in other low- and middle-income coun-tries (LMICs) [1-7]. Nonetheless, the Georgian experience
can be unique for two reasons. Firstly, the Georgian gov-ernment has chosen to provide more generous benefits to the poor than to other groups of the population. This is not a common practice globally, as in most cases, the wider welfare entitlements –including those in health – are directed towards the most organized or the politically most powerful [8], and the people least likely to be cov-ered are those with high health care requirements and needing financial protection [9]. Secondly, the coverage for the poor is purchased through competing private in-surance companies. Only 11 out of 154 LMICs channel at
* Correspondence:k.zoidze@curatio.com
Curatio International Foundation, P.O. Box 110, Tbilisi 380079, Georgia
least 10% of their total health expenditure through private risk prepayment schemes and for most of these countries private for-profit schemes are generally limited to the wealthy minority [10]. Columbia and India are the only other LMICs described in the literature that have estab-lished a similar Public Private Partnership (PPP) for the insurance of the poor [11,12].
In general, due to reduced bureaucratic process and often better business practices, private health insurance may be more efficient than public or quasi-public social insurance schemes, although the efficiency gains may be outweighed by higher administrative and acquisition costs [13,14]. Most of the countries relying on voluntary health insurance are commonly unable to extend coverage to the majority of the population, or tend to leave large segments of the population uncovered (e.g., South Africa, Jordan, Lebanon, Zimbabwe, India) [10]. Fragmentation of the national pools is another problem in countries where mandatory coverage is provided through competing private health insurance companies. These countries (Switzerland, Netherlands and Czech Republic) are compelled to use cross-subsidization between multiple pools to improve equity and viability of the health financing system [15].
There is a consensus that public financing of health care services for the population and particularly for the poor tends to be more equitable and can provide better financial protection [15,16]. However, global evidence is inconclusive on the advantages or disadvantages of using private for-profit insurance companies as financial inter-mediaries in the provision of health insurance for the population and its poorest segments through public funds [13,17]. Moreover, there is a near absence of comprehen-sive reviews of such experiences in LMICs [18]. These factors and emerging challenges in the design and im-plementation of Georgia’s health financing reform tar-geting the poor [19] inspired a systematic study of the Georgian experience in implementing the large-scale pre-payment schemes through a public-private partnership.
By 2006, the government developed a proxy-means-tested system for the detection of poor households. The test includes over 100 variables to estimate a household’s welfare standing. All Georgian households are entitled to apply to be included in the poverty database managed by the Social Services Agency (SSA). The households found ineligible for the social assistance can reapply after one year for a repeat eligibility assessment. SSA also con-ducts regular reviews (at least once in every five years) of the eligibility status of each household receiving the social assistance. The system allows identification of the poor with a sufficient degree of certainty [20,21]. This targeting system was used for the delivery of medical in-surance for the poor (MIP) benefits to the poor when the MIP program was launched in 2007–2008. Beneficiar-ies of MIP are chosen based on welfare scores derived
from a proxy means test. Households registered with the SSA database with scores below 70,001 are eligible for MIP. The MIP benefit package covers the following: i) urgent outpatient and inpatient treatment, including necessary diagnostic-laboratory tests to determine the need for hospitalization; ii) planned inpatient services, with an annual insurance limit of 15,000 GEL (1 GEL ~ 0.6 US$), excluding expenses for cosmetic treatment, aesthetic surgery, resort treatment, sexual disorders, infertility, treatment abroad, sexually transmitted infec-tions, HIV, and hepatitis C; iii) chemotherapy and radi-ation therapy within 12,000 GEL annual insurance limit; iv) outpatient visits and limited diagnostic and laboratory tests prescribed by the family physician or general prac-titioner; v) compensation for delivery costs (up to 400 GEL); vi) outpatient prescription drugs from a prede-fined essential drugs list and with an annual limit of 50 GEL and with 50% co-payment.
Institutional and purchasing arrangements
Initially implemented through a public single payer in September 2007, the government contracted out the delivery of MIP benefits to Private Insurance Companies (PICs). This move was most likely triggered by the Post Rose Revolution emphasis by the Georgian leadership on libertarian ideals and “small government” as a main tool in fighting corruption [22]. All 14 PICs operating in Georgia by the year 2007 had the right to participate. The insurance companies contracted health services from a network of predominantly private providers, or provided these through their own clinics and hospitals. Important changes were introduced in mid-2010. The country was divided into 26 medical regions and three-year contracts for each region were awarded to PICs identified through the competitive tendering procedure. Because of the tendering procedure, the annual insurance premiums were brought down from 180 GEL in 2009 to 116–132 GEL (depending on the region). Since then, MIP voucher holders are obliged to enter into insurance con-tracts with PICs according to their place of residence. However, beneficiaries have the right to change the insur-ance carrier once a year, in case they are not satisfied with the services provided. As an important addition, the PICs that won tenders for MIP implementation were mandated to construct/upgrade hospitals and medical centres in re-spective medical regions to ensure access to quality health services for the MIP beneficiaries insured by them.
While the concrete policy objectives for MIP were never formulated explicitly in any legal or policy docu-ment at the initial stage, two main objectives were
implied: i) “creation of a targeting system for public
financing of health services for the socially vulnerable” and ii) “redirection of the public funds to support the
objectives and targets for MIP were defined only after three years of implementation in 2011: i) to increase financial access to health services for the targeted groups of the population; ii) to mitigate the financial burden induced by the health expenditure for the targeted groups of the population; iii) to reduce the out-of-pocket (OOP) expenditure in the health sector. Respectively, three targets and indicators for the year 2012 were determined: i) number of insured under MIP to reach 1,700,000; ii) reduction of the share of OOPs in total health expenditure by 10%; iii) increased utilisation of
outpatient and inpatient services by 2–3% for the
population insured under MIP in 2010 [24].
One of the key objectives of this case study was to assess the impact of these new health financing reform initiatives of the Georgian government. In line with the implicit and explicit MIP objectives described above, the MIP impact was assessed in terms of equity of access to essential health care services and financial protection against the health care costs– which, together, are two key dimensions of the universal coverage plans.
This paper reflects key results and conclusions of the case study, drawing on two years of in-country research (from October 2010 through November 2012). The paper first provides a brief description of the analytical frame-work and methods used in the study. It then reviews the study results on MIP impact and discusses in more detail the factors that may explain the patterns of the observed impact. MIP impact in this paper is assessed across two dimensions: i) breadth, scope and depth of the achieved coverage for the general population [25] and ii) access to health services and financial protection for the MIP-targeted and general population. Selected economic, so-cial, demographic and health indicators for the country are presented in Table 1.
Methods
The overall approach used for the presented research was an exploratory and partially explanatory, holistic single case study design.
A variety of qualitative and quantitative research methods, including in-depth interviews with key informants, focus
Table 1 Selected economic, social and health indicators for Georgia for the years 1990, 1993, 2000 and 2003–2010
1990 1993 2000 2003 2004 2005 2006 2007 2008 2009 2010
Economic Indicators
GDP per capita (PPP$) 4,433 1,437 2,218 2,951 3,220 3,611 4,044 4,687 4,905 4,776 5,073
GDP growth (annual%) 1.8 11.1 5.9 9.6 9.4 12.4 2.0 −3.8 6.3
Public expenditure (% of GDP) 11.6 10.7 14.6 17.3 20.3 22.9 29.1 30.9 30.7
Population in 1,000 5,438 5,137 4,435 4,342 4,315 4,321 4,401 4,394 4,382 4,385 4436.4
Social and Poverty
Subsistence minimum (average for household) 141.5 160.7 178.7 198.9 214.6 216.0 225.3
Poverty
Share of population with less than 60% of the median consumption 24.6 24.1 23.3 21.3 22.1 21.0
Share of population with less than 40% of the median consumption 10.9 10.1 9.4 9.2 9.5 8.8
GINI coefficient 38.85 40.37 40.78 36.3
Beneficiaries of poverty assistance (% of total population) 6.4 8.4 9.9 9.7
Health Status and Health System
Life expectancy at birth 73 72 71.3 72.1 71.6 74.0 74.3 75.1 74.2 73.6 74.4
Infant mortality (per 1,000 live births) 20.7 27.6 22.6 24.8 23.8 19.7 18.4 14.1 14.3 14.9 12.0
Hospitalizations per 100 population 13.31 7.02 4.51 4.81 5.49 5.71 6.01 6.33 7 7.09 7.5
Outpatient visits per capita 8 5.3 1.4 1.8 2 2.1 2.2 1.95 2.1 2
Health Financing
Total health expenditure (THE) (% of GDP) 7.4 8.5 8.5 8.6 8.4 8.2 8.7 10.1 10.2
Public expenditure on health (% of THE) 16.7 15 15.4 19.5 21.6 18.4 20.7 23 23.1
Private expenditure on health (% of THE) 73 72.4 69.8 71.2 72.1
External expenditure on health (% of THE) 5.1 9.2 10.5 5.8 4.8
THE (year 2005 PPP$) per capita 141.7 232.9 262.1 302.9 339.1 384.6 433.0 499.0 510
Out-of-pocket expenditure (% of private health expenditure) 99.4 99.5 99.0 99.0 98.5 97.9 96.3 94.1 90.6
Prepaid health expenditure (% of THE) 22.7 19.9 23.3 27.2 29.9
group discussions, media monitoring and secondary data analysis were used to achieve a holistic understanding of the studied phenomenon. The current paper mainly focuses on the key findings obtained through the quan-titative methods. Results of the policy analysis and more details on qualitative research findings will be presented in subsequent papers.
MIP impact and testing/identification of factors shap-ing the MIP impact were analysed usshap-ing secondary data analysis of population based surveys – nationally repre-sentative Georgia Household Health Utilisation and Expenditure Surveys (HUES) 2007 [26] and 2010 [27], and the report on the Georgia MIP Impact Evaluation Survey (MIPIES) 2008 [28]. HUES 2007 and MIPIES 2008 were conducted in the initial phase of MIP im-plementation and provided the necessary baseline to evaluate the observed MIP impact across the criteria identified above. The impact was evaluated by comparing these baseline findings with the findings of the HUES 2010 that have generated comparable data for MIP tar-geted poor population, and the poor and general popula-tion not covered by MIP benefits (Table 2). Addipopula-tional results of these surveys on several key outcomes, including health-related behaviours, were also considered to explain the impact of MIP on access to and utilisation of health services. The utilisation and health expenditure patterns and probability of receiving free benefits by MIP-targeted
and not-targeted populations were assessed through the analysis of combined HUES 2007 and 2010 databases using the difference-in-difference (DiD) approach with logistic regression method; this method is also known as a pre-post design with a control group [29]. The change (or difference) in the outcome variable at the baseline and follow-up of MIP implementation in the treatment (or MIP covered individuals) and control group (non-MIP insured) were compared. Three sets of outcome variables were tested in the regression model: i) utilisa-tion of services; ii) level of OOP expenditure related to service utilisation; and iii) odds of receiving free benefits without any co-payment. This method has been sug-gested over pre-post comparison without a control group because if a trend effect occurs during the same period as policy implementation, a simple pre-post com-parison would have incorrectly attributed the trend effect to a policy impact. In a DiD framework, any trend affect-ing the treatment and control groups equally will be re-moved and the resulting net difference will be the pure policy effect. The model used can be expressed as follows:
Y¼β0þβ1Tþβ2MIPþβ3ðTMIPÞ þe
Where, Y is the outcome variable of interest; T is a
time dummy (2007–2010); MIP is a dummy for MIP
in-sured, capturing possible differences between MIP and
Table 2 Data sources, their short description and their use for the analysis presented
Data sources Description Use for the analysis presented
Georgia Household Health Utilisation and Expenditure Surveys (HUES) in 2007 and 2010
Baseline (in May–June 2007) and follow-up cross-sectional surveys (June 2010) using the exact same methodology and tools with nationally representative sample of households– approximately 3,200 in each wave. The surveys collected information for all members of the households on current and past sickness episodes, including chronic diseases; information on sickness and use of services and related household expenditure for all cases that occurred during the 30-day period prior to interview and all hospitalization cases that occurred during the 12-month period preceding the interview.
The combined survey database was used to: i) assess the utilisation and health expenditure patterns and probability of receiving free benefits by MIP targeted and not targeted population; ii) to estimate catastrophic health expenditure rates.
Georgia Integrated Health Survey (IHS)
Nationally representative household survey conducted each quarter for living standards and poverty monitoring, and other statistical purposes on approx. 3,300 households in 2007 and approx. 6,700 households in 2010.
HUES 2007/2010 sample households were included in the IHS for the respective quarter. This allowed linking sickness, utilisation and health expenditure data, collected in the HUES, with the household consumption level, which provides a proxy for income and is the basis of poverty measurement in Georgia. The household consumption levels established by IHS and HUES 2007/2010 findings on household health expenditure were used by us to estimate the catastrophic health expenditure rates.
MIP Impact Evaluation Survey in Georgia–MIPIES (World Bank, 2008)
The survey sample of approx. 3,500 households with a balance of MIP beneficiaries and non-beneficiaries was drawn from the MIP applicants database for 7 regions of the country accounting for 74% of the total population. The survey conducted in November–December 2008 collected information on a range of variables, including utilisation of and OOP expenditure on preventive and curative services.
non-MIP insured prior the policy change; β_0 is the
baseline average; β_1 represents the time trend in the
control group; β_2 represents the differences between
the MIP and non-MIP beneficiaries in 2007; and β_3
represents the difference in the changes by 2010 [30]. The catastrophic health expenditure rates were esti-mated by the researchers using the HUES 2007 and 2010 databases utilizing the methodology presented in Gotsadze et al. [31]. For comparison, alternative esti-mates for the same indicators were also obtained from Rukhadze and Goginashvili [32]. Their estimates are based on annual data obtained through the quarterly Georgia Integrated Household Survey (IHS) implemented by the Georgian Statistical Committee (GeoStat). Finally, two national peer reviewers using the research team network were contacted and asked to review the study findings.
The researchers use the incidence of catastrophic health expenditure to characterize the financial protection of the population, while the access to health services are mea-sured using the indicators for health services utilisation and is analysed using a framework encompassing geo-graphical access to health facilities, availability of medical personnel, and financial accessibility [33]. Catastrophic health expenditure is defined and estimated using meth-odology suggested by Xu et al. [34]. These specific ana-lyses finally informed the overall analysis on the MIP impact presented in this paper.
Results
Breadth, depth and height of the achieved coverage for the general population
An overall description of the breadth, scope and depth
of coverage – or who is covered, what services and to
what extent services costs are covered –is presented in Table 3. There has been a striking increase in the coverage of health insurance since 2006, from less than 200,000 individuals to about 1.4 million individuals, or almost one third of the total population by the end of 2010. Out of this number, MIP accounted for over 1 million individuals, or about 23% of the total population and roughly 72% of the insured population from any source. The rest of the population is entitled to limited publicly funded health benefits, including mainly non-personal, population based services. This scale of expan-sion in the MIP coverage was achieved through an impressive 50% increase in the public expenditure on health. Since MIP inception, the public expenditure on health has grown from 40 US$ per capita in 2006 to 61 US$ in 2010 in constant 2009 US$ prices [35]. MIP accounted for 43% of the total health budget in 2010, with the remaining 57% going to other health programs for the general population.
Reaching the poor
MIP has fared relatively well in reaching the poor. Table 4 shows that in the period from 2007 to 2010 the coverage of the poorest income quintile increased from 14.3% to 39.2%. This means that the poorest in Georgia with the existing targeting system have received twice the share of MIP insurance benefits they would have received in a random allocation, performing on a par with the most effective targeting programs in LMIC [21], despite the fact that MIP coverage was also ex-tended to a considerable share (13.1%) of better-off households [27].
Access to health services and financial protection of MIP targeted and general population
Utilisation
The analysis of combined HUES 2007 and 2010 data-bases show that the overall level of utilisation of health care, considered as contact with any type of health pro-vider, appears to have declined slightly between 2007 and 2010, with 1.9 contacts per person per annum in 2010 compared with 2.0 in 2007 (Table 5). However, this dif-ference is not statistically significant. At the same time, a decline in utilisation has occurred in urban areas, while there was an increase in utilisation in rural areas, from an initially lower level. Both of these changes are statistically significant. The utilisation trends differ be-tween the individuals with acute vs. chronic illnesses. Individuals with acute sicknesses in the preceding 30 days are more likely to report using health services and report a substantial increase in utilisation from 2007, with 66% consulting a health care provider in 2010 compared with 57% in 2007. However, the individuals with chronic ill-nesses utilised less services resulting in zero net effect for an overall use of services (Table 5). While there was no overall increase in the utilisation of health services for the general population, our analysis shows that the MIP bene-ficiaries were 2% more likely to seek any health services compared to non-beneficiaries. This difference, though very small, is statistically significant (Table 6).
Geographical access and availability of health personnel The HUES 2007/2010 found that most of the population have access to a health facility within 30 minutes by their usual means of transport and the proportion of house-holds that do have access has increased significantly in
rural areas, reaching 78% for the population as a whole by 2010. There has also been a significant increase in the proportion of respondents (from 65 to 80%) who report that doctors are present for at least 5 days a week at the relevant health facility (Table 8).
Table 3 Breadth, scope and depth of coverage of state funded health programs and health insurance (2010)
State vertical programs covering personal health services and State funded or subsidized Insurance programs
Population coverage Service coverage Cost coverage
(covered by the state program)
Urgent care (population over 60) 830,000–approx. 19% of the total population
Defined inpatient urgent conditions First 6 days of ICU care, 75% of actual cost for predefined conditions
Urgent and hospital care for children under 3 years of age
220,000–5% Defined urgent and inpatient conditions
Full cost in case of critical conditions and population residing in high mountainous areas; 80% of actual cost for predefined inpatient conditions
General outpatient care Little over 1 million–approx. 22% (children under-6, elderly over 60, oncologic and diabetes patients)
Visits to Primary Health Care (PHC) physician/nurse, 4 home visits, immunization, limited list of express lab tests, management of the chronic diseases
Fully covered/no co-payment
Rural outpatient care“rural physician”
Little over 2 million–approx. 47% Visits to PHC physician/nurse, 4 home visits, immunization, limited list of express lab tests, management of the chronic diseases
Fully covered/no co-payment
Maternal child health Women of reproductive age and children
Four prenatal visits for all. Defined list of tests, extended care for high risk pregnancies and complicated delivery
Upper limit from 833 to 3,000 GEL for complicated pregnancy and delivery
Emergency care (ambulance) Entire population Ambulance service, medical transportation
Fully covered/no co-payment
Referral program Entire population Medical needs during emergency
situations, MIP eligible beneficiaries not yet insured; individual cases
Fully covered/no co-payment
Cardiac surgery Entire population Defined conditions; waiting list for planned interventions
Fully covered for children less than 18 years of age; from 50 to 75% of the predefined price for each type of surgery
Management of oncologic diseases
Entire population Defined conditions; outpatient and inpatient care
Fully covered for children less than 18 years of age; 70% of the predefined price of defined interventions with upper limits (e.g., chemotherapy)
Dialysis and renal transplantation Entire population Defined conditions Fully covered/no co-payment
TB control Entire population DOTS, outpatient and inpatient care Fully covered/no co-payment
Mental health Entire population Defined outpatient and inpatient
care
Fully covered/no co-payment
Other programs (war veterans, draftees, etc.)
Small groups Defined list of outpatient and inpatient care
Fully covered/no co-payment
MIP insurance About 885,000 poor below eligibility threshold 70,000, about 55,000 between 70,000 and 100,000 scores; about 65,000 other groups (teachers, IDPs, orphans, etc.)–total about 1 million, or 22% of population
Comprehensive defined list of urgent care, critical care and inpatient services; defined list of outpatient services, outpatient drug benefit from essential drug list
Annual limits: planned inpatient services–15,000 GEL; chemotherapy and radiation therapy–12,000 GEL; delivery–400 GEL; outpatient drugs– 50 GEL, with 50% co-payment
Affordable insurance* 125,000–2% Urgent outpatient and inpatient care and critical conditions; outpatient services included in general outpatient care program
Fully covered PHC. Annual limits: Urgent outpatient care–300 GEL; critical care from 1,000 to 5,000 GEL, with co-payment from 0–50% *2010 data.
Financial access
According to the HUES 2007/2010, while the OOP pay-ments for all health care services has increased (Table 9), selected financial access indicators for the general popu-lation have slightly improved over time. Namely, the proportion of individuals requiring hospitalisation but could not afford it has declined slightly, but significantly, from 3.9 to 2.6% (Table 10). Our analysis of the HUES 2007/2010 database shows less OOP expenditure for in-patient services (−227 Gel per episode) and total monthly health care payments (−27 Gel), and a higher probability of receiving free inpatient (by 14%) and outpatient (by 18%) benefits for MIP-insured (Table 6). The magnitude of a positive MIP impact on the poorest was more signifi-cant where inpatient treatment costs decreased by 442 GEL and MIP has significantly improved the probability of receiving free benefits of inpatient and outpatient ser-vices by around 23% for this group. However, MIP insur-ance had almost no effect on the beneficiary expenditure for outpatient drugs and for chronic patients [30].
Catastrophic health expenditure
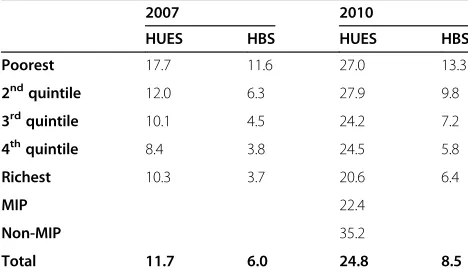
The results on catastrophic health expenditure obtained using the HUES 2007/2010 database show a dramatic in-crease in the shares of the general population facing the catastrophic health expenditure from 11.7% in 2007 to 24.8% in 2010 (Table 11).
Discussion
Much of the focus of the GoG’s PHC reforms in the past 7 years have been directed at increased access to primary health facilities and qualified medical personnel trained in family medicine in rural areas, thus encouraging pa-tients to use these services [22]. However, the low overall utilisation rates of health services for the general popula-tion (two contacts per capita per year) that remained vir-tually unchanged in the period from 2007 through 2010, and the decline in the share of outpatient visits at PHC facilities, indicate serious failure in achieving this im-portant health policy objective of improved access to pri-mary health care services for the Georgian population.
The World Bank assessment of the first 6 months of MIP implementation revealed that MIP beneficiaries were nine times more likely to utilize urgent care than house-holds that were not qualified, utilisation also increased among the poorest of the poor [36]. This impressive growth in acute care utilisation among MIP beneficiaries reported by the 2006 study is not upheld by the subse-quent MIPIES 2008 and our study findings on utilisation. Our findings of moderate MIP effects on utilisation are consistent with the effects found by other studies of simi-lar programs targeted at the poor [37].
MIPIES 2008 found that OOP payments by MIP benefi-ciaries were about 50% lower for outpatient services and 40% to 58% lower for inpatient services compared to what non-beneficiaries have spent. MIP beneficiaries were 17% to 26% more likely to receive free care, had lower risk of high inpatient medical care costs and were much less likely to forgo services due to financial reasons [37]. These results on MIP beneficiaries having less OOPs and higher likeli-hood of receiving free care are consistent with our study findings obtained through the DiD regression model.
The MIP benefit package has been steadily expanding since inception of the MIP. However, the benefit package as of November 1, 2012 still fails to cover the bulk of essential outpatient services and most importantly, a drug benefit for the chronically ill, which is one of the main cost drivers for health services and a source of
Table 4 Coverage of the population by any health insurance and by MIP insurance, by income quintiles, 2007 and 2010
Year Poorest 2nd 3rd 4th Richest
Percentage of population reporting being covered by any health insurance (government, private or employer)
2007 18.5 14.8 12.5 14.4 8.6
2010 39.9 31.1 26.6 23.7 26.2
Percentage of the population in households covered by MIP
2007 14.3 13.2 8.3 9.3 4.2
2010 39.2 26.8 20.1 16.7 13.1
Source: Authors and MoLHSA 2011 [27].
Table 5 Average numbers of consultations and utilisation of services when sick–HUES 2007/2010
Indicator Year Total Urban Rural
Average number of consultations / contacts per person per annum (all sources of care)b 2007 2.01 2.36 1.67
2010 1.91 1.85*** 1.97**
Average number of outpatient consultations (all types) per person per annuma 2007 1.74 2.03 1.46
2010 1.66 1.60 1.72
Percentage of total population who reported being sick with any condition in last 6 months and consulted a healthcare providerb
2007 59.5 59.8 59.3
2010 60.3 59.6 60.9
Percentage of occurrences of acute illness in the past 30 days where a healthcare provider was consultedb 2007 56.5 55.6 57.9
2010 66.0*** 68.0*** 64.3*
Notes:a
Significance of difference not tested;b
catastrophic health expenditure in Georgia. Initial design of the MIP benefit package was mostly oriented towards inpatient services with limited outpatient coverage. After three years of full-scale implementation, the benefit pack-age was gradually expanded covering some additional in-strumental and diagnostic services and a very limited outpatient drug benefit in 2010. Nevertheless, the pharma-ceutical treatment for chronic diseases remains the main trigger for increased health expenditure and a potential source of catastrophic health expenditure even for MIP
beneficiaries, as pharmaceutical expenditure accounts for up to 50% of THE and up to 60% of households health expenditure [35].
Our results on catastrophic health expenditure obtained using the HUES 2007/2010 database show that the poorest quintile households were more likely to face catastrophic expenditure than other consumption quin-tile groups. The share of such households with cata-strophic health expenditure in the poorest quintile has increased from 17.7% in 2007 to 27% in 2010. Yet, the
Table 6 Results of Difference-in-Difference analysis using two waves of 2007/2010 HUES data
Outcome variables Single difference Double difference
Coefficient t-statistic Coefficient t-statistic
Service utilisation
Utilising any services during last 30 days 0.02 2.72** 0.02 1.95*
Utilising medical (curative and preventive) services during last 30 days 0.03 3.99*** 0.02 1.71*
Referring to self-treatment −0.01 −1.25 0 0.47
Outpatient utilization (binary) 0.02 2.16** 0.02 1.18
Inpatient service utilization (binary) 0.02 2.80*** 0.01 1.34
Household expenditure
Average payment per outpatient visit −24.56 −4.63*** −10.51 −1.3
Monthly self-treatment cost −4.84 −2.77*** −5.3 −2.13**
Average payment per inpatient stay −402.94 −3.50*** −226.93 −1.98*
Monthly chronic disease management costs −4.84 −2.77*** −4.98 −1.96*
Total monthly health care payments −5.65 −4.31*** −27.01 −1.94*
Probability of receiving free benefits
Outpatient free benefit 0.28 9.04*** 0.18 3.89***
Inpatient free benefit 0.35 7.77*** 0.14 1.77*
*P<0.10, **P<0.05, ***P<0.01. Source: Gotsadze et al. [31].
Table 7 Population reporting to be sick consulting health provider and place of first consultation, HUES 2007/2010 data
Indicator Year Total Urban Rural MIP Non-MIP
Percentage of total population who reported to be sick in the last 6 months 2007 53.5 56.2 51.0 67.3 51.7
2010 55.2* 56.0 54.5** 60.6 53.6
Percentage of total population who reported to be sick in the last 6 months who consulted healthcare provider
2007 59.5 59.8 59.3 58.4 59.8
2010 60.3 59.6 60.9 62.2 59.6
Percentage of all first consultations, for last consultation in the last 6 months, that are done at a PHC level
2007 52.7 52.4 53.1 59.0 49.8
2010 50.9 50.2 51.5 55.2 47.0
Percentage of occurrences of acute sickness in last 30 days, where a health care provider was consulted
2007 56.5 55.6 57.9 56.2 63.3
2010 66.0 68.0 64.3 63.7 72.1
Place of first consultation at village ambulatory centre, for most recent consultation in previous six months
2007 9.7 0.3 19.7 17.3 8.0
2010 8.9 0.2 17.6 13.1 7.4
Place of first consultation at hospital as an outpatient, for most recent consultation in previous six months
2007 28.8 27.3 30.3 21.3 29.9
2010 29.5 28.5 30.5 25.8* 30.8
Person consulted is village or district doctor, for most recent consultation in previous six months (all consultations)
2007 17.9 15.1 20.9 26.1 16.3
2010 18.1 16.7 19.5 23.7 16.1
gradient between the poorest and richest households in the same period declined by more than 20% (Table 11). The analysis conducted by Rukhadze and Goginashvili using the results of the Georgia Household Budget Survey (HBS) show a similar trend. The actual values for catastrophic expenditure for health derived from the HUES are much higher than those reported by Rukhadze and Goginashvili using the HBS data. This may be ex-plained by a significantly higher level of health expend-iture captured by HUES compared to HBS [31].
There is a seeming contradiction between improved geographical access and financial access for both MIP beneficiaries and the general population on the one side and almost unchanged overall utilisation patterns, increased OOP expenditure and worsened financial protection indi-cators for the total population on the other that requires explanation. There are at least three possible causes for the observed effect.
Firstly, double negative impact of the war with Russia and the global economic recession on the Georgian economy and population welfare has significantly reduced households’ total consumption from 408.6 GEL in 2008 to 364.6 GEL in constant 2006 prices [32], while increase in total and private health expenditure has outpaced the inflation rate and GDP growth: total health expenditure (THE) increased from 8.7% of GDP in 2008 to 10.2% of GDP in 2010, with private expenditure increasing from 69.8% to 72.1% of THE in the same period (Table 1). This ad-versely affected the financial protection for the entire
population: OOP expenditure increased for all types of services (Table 9) and catastrophic health expenditure increased for all population groups, including the MIP beneficiaries (Table 11). However, the increase in OOP health expenditure, particularly for inpatient services, disproportionally affected the non-MIP population, while benefiting the MIP population (Table 9).
Secondly, the increase in private expenditure was most notable for pharmaceuticals consumed on a daily basis by 40% of the Georgian vulnerable households [38] and
mostly not covered by MIP.This expenditure amounted
to 50% of THE [35] and 60% of total household expend-iture on health in 2010, which, in turn has increased by 21% in real terms in the period from 2007 through 2010 [27]. This dramatic increase in pharmaceutical expend-iture may be related to irrational prescription practices and the largely unregulated pharmaceutical market in Georgia [22,39].
Thirdly, there is compelling evidence that despite the extended breadth, depth and scope of coverage provided, MIP was unable to shield the vast majority of the popula-tion from catastrophic health expenditure. In the period from 2008 through 2010, only 13.8% of MIP beneficiaries used the insurance. In the same period, the claims ratio, or the amount paid in claims against the total premium amounted to the average of only 65% and in 45% of in-surance cases reimbursed health expenditure did not exceed 20 GEL (less than 5% of total household consump-tion) [40]. Yet, this relatively low claims ratio, though not
Table 8 Physical access and availability of services–HUES 2007/2010
Indicator Year Total Urban Rural
Percentage of total population with access within 15 minutes by normal means of travel to a facility where they would normally see a doctor
2007 42.4 55.6 31.4
2010 49.7*** 62.6** 37.6**
Percentage of total population with access within 30 minutes by normal means of travel to a facility where they would normally see a doctor
2007 81.9 93.5 72.5
2010 85.5** 93.6 77.8*
Percent of health facilities (other than ambulatory) where a doctor is reported to be present for 5 or more days a week. 2007 98.1 99.3 95.9
2010 99.0* 99.4 98.0
Notes: Statistical significance of difference with baseline figure: ***P<0.01; **P<0.05; *P<0.1. Source: Authors and MoLHSA 2011 [27].
Table 9 Household health care expenditure (GEL, current prices)–HUES 2007/2010
2007 2010
Non-MIP MIP Total Non-MIP MIP Total
Mean fee paid to a provider per outpatient visit 40.1 19.2 36.6 59.5** 21.8 54.2**
Mean cost per prescribed drug purchased 26.8 21.3 25.9 36.5*** 28.6** 35.4***
Mean expenditure per case of self-treatment 13.5 12.9 13.4 20.6*** 19.0** 20.4***
Annualized expenditure per chronic patient 276.2 227.1 267.1 426.0*** 307.2*** 411.1***
Average cost per inpatient stay 636.8 414.4 599.2 730.7* 364.9 684.4
Total annualized per capita expenditure 190.8 198.0 192.1 313.3** 278.4** 307.2**
unusual [41], may have been caused by delays–possibly intentional – in enrolment of the eligible beneficiaries and aggressive utilisation management by some of the participating PICs and poorly informed beneficiaries [40]. Following this logic, curtailment of these adverse practices and the increased beneficiary awareness may have contributed to a significant increase in the claims ratio in subsequent years, reaching 98% in 2012 [42].
Considering all the above, we suggest that the extended MIP coverage and increased financial access provided by the program, were most likely not able to reverse the ad-verse effects of economic slow-down and escalating health expenditure and have only cushioned the negative impact for the poorest by decreasing the poor/rich gradient in the rates of catastrophic health expenditure. Flaws in the MIP benefit package and possible adverse practices employed by the PICs may have played critical role in diminishing the desired impact of MIP at the initial implementation stage presented here.
Addressing problems in equity and financial protec-tion against health care costs through re-attainment of
universal coverage for essential health care services for the entire population is one of the longstanding and ex-plicitly stated national health policy goals in Georgia [43]. However, the first practical steps towards achieve-ment of this goal were made only in recent years, when more funds became available to the health sector. Para-doxically, this happened in the situation when the over-arching goal of achievement of universal coverage for the entire population was removed from the formal public agenda in favour of the “selective” approach targeting the priority groups [44]. The idea of providing universal coverage to the entire population has re-emerged on the policy agenda with the victory of the new political party in Georgia in the fall of 2012. It is unclear whether the
existing PPP’s in providing health insurance coverage
will continue to exist and or which dimension of the coverage (breadth, depth, or height) will be favoured as a strategy towards achievement of this goal. The research team believes that findings and results of the current study may also help to inform policy makers to determine the future path of the planned health financing reform.
The study limitations
In comparison to previous impact evaluation studies and in consideration of policy implications of the findings, it is important to keep the limitations of the study in mind. First, given limitations of the data we have not consid-ered the impact of the MIP on health outcomes. Second, the inflation adjusted prices considered the conservative approach by applying the overall Consumer Price Index of Georgia and not the health-specific inflation rate (i.e., on average of 25% in year 2010). Thirdly, the consump-tion groups assessed do not account for those receiving government subsidies, hence there may be those belong-ing in the“poor” quintile that may have consumed more and hence be reported as higher quintile due to the subsidy negatively distorting results characterizing the
Table 10 Financial access–HUES 2007/2010
Indicator Year Total MIP Non-MIP
Percentage of occurrences of acute sickness in the last 30 days, where no consultation was undertaken because it was too expensive/not enough money (% of all reasons)
2007 16.1 15.3 16.2
2010 16.7 17.8 13.9
Percentage of consultations where medicine was prescribed but not purchased because it was too expensive (base: all consultations in previous six months)
2007 11.8 19.4 10.3
2010 13.1 21.4 10.2
Percentage of consultations where a lab test was prescribed but not done because it was too expensive (base: all consultations in previous six months)
2007 4.2 6.9 3.7
2010 4.2 5.0 4.0
Percentage of total population who reported needing hospitalisation in the last year but were not hospitalised because it was too expensive/they did not have enough money
2007 3.9 -
-2010 2.6*** 2.3 2.7
Percentage of respondents who expect to pay for a consultation with a doctor at the nearest facility 2007 72.6 57.0 75.7
2010 73.5 51.5* 80.9**
Notes: ***P<0.01; **P<0.05; *P<0.1. Source: Authors and MoLHSA 201 [27].
Table 11 Estimates of shares of households with catastrophic health expenditure in 2007 and 2010 (%)
2007 2010
HUES HBS HUES HBS
Poorest 17.7 11.6 27.0 13.3
2ndquintile 12.0 6.3 27.9 9.8
3rdquintile 10.1 4.5 24.2 7.2
4thquintile 8.4 3.8 24.5 5.8
Richest 10.3 3.7 20.6 6.4
MIP 22.4
Non-MIP 35.2
Total 11.7 6.0 24.8 8.5
effectiveness in MIP targeting. Finally, it is worth noting that since the research focused only on the first three years of MIP implementation, it may have been too early to assess its long-term effects. Further research is needed to address these issues.
Conclusions
MIP has contributed to an improvement in all three
dimensions – population, service and cost coverage, and
managed to improve financial protection of the beneficiaries that used health services against expenditure related to in-patient care. This, in turn, had a positive impact on financial access indicators for the poorest in the general population, but had limited or no overall effect on utilisation of health services and financial protection for the general population as measured by the incidence of catastrophic health expend-iture. The study results also suggest that the sustained low utilisation of health services, particularly primary health care services for the general population including MIP beneficiar-ies is mainly determined by the limited financial accessibility of outpatient pharmaceuticals. As a result, exclusion of an outpatient drug benefit from MIP benefit package during the first three years of implementation has detrimentally affected the potential impact of MIP on financial pro-tection of the population. There are also indications that
improper practices employed by the PICs–delayed
en-rolment and overly aggressive utilisation management–
may have also contributed to the low utilisation at the initial stage of MIP implementation. Alternative approaches to protecting households experiencing catastrophic health expenditure might need to be explored, most important of which may be the expansion of the MIP benefit package to cover a reasonable outpatient drug benefit that will include coverage of the leading causes of chronic illnesses such as hypertension and other cardiovascular diseases, bronchial asthma, gastroenterology disorders, etc. Policies for the rationalization of unreasonably high pharmaceutical ex-penditure should also be pursued.
The recent governmental decision on major expansion of MIP coverage and inclusion of additional drug bene-fits are expected to significantly enhance the overall MIP impact and its potential as a viable policy instrument for achieving universal coverage. However, it appears that there is no clear consensus yet among policy makers in which direction to proceed in for the further improve-ment of the population’s financial protection, which pre-sents a window of opportunity for the researchers and advocacy groups to provide sound evidence and influence the decision-making process.
Abbreviations
DiD:Difference in difference; GDP: Gross domestic product; GEL: Georgian Lari; GeoStat: Georgian Statistical Committee; HBS: Household budget survey; HUES: Health expenditure and utilisation survey; LMIC: Low- and middle-income countries; MIPIES: Georgia MIP impact evaluation survey;
MIP: Medical insurance for poor; OOP: Out-of-pocket expenditure; PICs: Private insurance companies; SBASS: Survey of barriers to access to social services in Georgia.
Competing interests
The authors declare that they have no competing interests.
Authors’contributions
AZ led the research design and implementation as a principal investigator, conducted literature and document review, together with NR performed overall analysis of the quantitative data and finally, drafted the manuscript. NR, KC (who also provided overall coordination of the research) and GG worked on the secondary data analysis. GG also reviewed the draft manuscript. All authors have read and approved the final manuscript.
Acknowledgements
We acknowledge that this study is financially and technically supported by the Alliance for Health Policy and Systems Research, WHO. We also wish to acknowledge the inputs of the Health Systems Financing Department, WHO and the late Guy Carrin, in particular. Our special appreciation goes to Di McIntyre for her guidance during the preparation of the study proposal and the manuscript review. We also appreciate contributions from Kent Ranson, Ayako Honda and Lucy Gilson to the research design process. The researchers express their gratitude to Bhupinder Kaur Aulakh for continuous support during the study implementation.
Received: 7 December 2012 Accepted: 30 October 2013 Published: 15 November 2013
References
1. Leemput L, Ponsar F, Philips M, Bricki N:Health equity funds in Cambodia.
Lancet2007,369(9562):638.
2. Meessen B, Pei X, Criel B, Bloom G:Health and Social Protection: Experiences from Cambodia.China and Lao PDR, Antwerp: ITG press; 2008.
3. Sparrow R, Suryahadi A, Widyanti W:Social health insurance for the poor: targeting and impact of Indonesia's Askeskin programme.Soc Sci Med
November 2013,96:264–271.
4. Preker A, Carrin G, Dror D, Jakab M, Hsiao W, Arhin-Tenkorang D:Rich-poor differences in health care financing. InHealth Financing for Poor People– Resource Mobilization and Risk Sharing.Washington DC: World Bank; 2004:3–52. 5. Jowett M, Hsiao W:Philippines: extending coverage beyond the formal
sector. InSocial Health Insurance for Developing Nations.Washington DC: World Bank; 2007:81–104.
6. Arfa C, Achouri H:Tunisia: good practices in expanding health care coverage. Lessons from reforms in a country in transition. InLessons from Reforms in Low- and Middle-Income Countries. Good Practices in Health Finan-cing.Edited by . Washington DC: World Bank; 2008:385–437.
7. Wagstaff A, Policy Research Working Paper, No WPS 4134:Health Insurance for the Poor: Initial Impacts of Vietnam's Health Care Fund for the Poor.
Washington, DC: World Bank; 2007.
8. Mkandawire T:Targeting and Universalism in Poverty Reduction. Social Policy and Development Programme PaperNo 23.Geneva: UNRISD; 2005. http:// www.unrisd.org/80256B3C005BCCF9/(httpPublications)/
955FB8A594EEA0B0C12570FF00493EAA.
9. Meng Q, Yuan B, Jia L, Wang J, Yu B, Gao J, Garner P:Expanding health insurance coverage in vulnerable groups: a systematic review of options.
Health Policy Plann2011,26(2):93–104.
10. Drechsler D, Jutting J:Policy Insights, No. 11: Private Health Insurance for the Poor in Developing Countries.Paris: OECD Development Centre; 2005. 11. Miller G, Pinto D, Vera-Hernandez M:High-powered Incentives in Developing
Country Health Insurance: Evidence from Colombia’s Régimen Subsidiado. National Bureau of Economic Research Working Paper No.15456.Cambridge, MA: NBER; 2009.
12. Basu R:Rashtriya Swasthya Bima Yojana: Pioneering Public-Private Partnership in Health Insurance.New Delhi: Jamia Millia Islamia; 2010. http://www. napsipag.org/PDF/RUMKI%20BASU.pdf.
13. Drechsler D, Jütting J:Private health insurance in low- and middle-income countries–scope, limitations, and policy responses. In2005 Wharton Impact Conference, 15–16 March, 2005.Wharton; 2005.
15. WHO:The World Health Report: Health Systems Financing: The Path to Universal Coverage.Geneva: World Health Organization; 2010. 16. Gilson L, Doherty J, Loewenson R, Francis V:Challenging Inequity through
Health Systems. Final Report. Knowledge Network on Health Systems.Geneva: WHO Commission on the Social Determinants of Health; 2007.
17. Patouillard E, Goodman C, Hanson K, Mills A:Can working with the private for-profit sector improve utilisation of quality health services by the poor? A systematic review of the literature.Int J Equity Health2007,6:17. 18. Gilson L, Raphaely N:The terrain of health policy analysis in low and
middle income countries: a review of published literature 1994–2007.
Health Policy Plann2008,23(5):294–307.
19. Hou X, Chao S:Evaluation of the Initial Impact of the Medical Assistance Program for the Poor in Georgia, World Bank Policy Research Working Paper Series, 1.Washington DC: World Bank; 2008.
20. The World Bank:Georgia Poverty Assessment.Washington DC: World Bank; 2009.
21. Grosh M, Ninno C, Tesliuc E, Ouerghi A:For Protection and Promotion: The Design and Implementation of Effective Safety Nets.Washington DC: World Bank; 2008.
22. Chanturidze T, Ugulava T, Durán A, Ensor T, Richardson E:Georgia: health system review.Health Systems in Transition2009,11(8):1–116.
23. Djadugishvili S:Health Financing in Georgia 1990–2010.Insurance Association of Georgia: Tbilisi; 2010.
24. Ministry of Finance of Georgia:Information on anticipated outcomes and indicators for the programs defined by the State Budget of Georgia 2012.[http://www.mof.ge/common/get_doc.aspx?doc_id=8726] Accessed 23 January 2012.
25. Gotsadze G, Gaal P:Coverage decisions: benefit entitlements and patient cost sharing. InImplementing Health Financing Reform: Lessons from Countries in Transition.Edited by Kutzin J, Cashin C, Jakab M. Copenhagen: WHO on behalf of the European Observatory for Health Systems; 2010:187–217.
26. MoLHSA, Department of Statistics, Ministry of Economic Development, Oxford Policy Management, UK, Curatio International Foundation:Results from a Household Survey on the Use of Health Services and Expenditure on Health. Final Report.Tbilisi: Georgia Primary Health Care Development Project; 2007.
27. MoLHSA, Department of Statistics-Geostat, Oxford Policy Management, UK, Curatio International Foundation:Results from Two Rounds of a Household Survey on the Use of Health Services and Expenditure on Health. Final Report.
Tbilisi: Georgia Primary Health Care Development Project; 2011.
28. MoLHSA:Georgia MAP Impact Evaluation Survey 2008.Tbilisi: Georgia Primary Health Care Development Project; 2008.
29. Abadie A:Semiparametric difference-in-difference estimators.Rev Econ Studies2005,72:1–19.
30. Gotsadze G, Zoidze A, Rukhadze N:Purchasing Private Health Insurance for Poor in Georgia: Preliminary Results and Policy Implications.Proceedings of the International Health Economics Association: Sydney; 2013. 31. Gotsadze G, Zoidze A, Rukhadze N:Household catastrophic health
expenditure: evidence from Georgia and its policy implication.Bmc Health Serv Res2009,9:69.
32. Rukhadze N, Goginashvili K:Distribution of Health Payments and Catastrophic Expenditures in Georgia: Analysis for 2006–2010 (Annual Level Data).MoLHSA: Tbilisi; 2011.
33. Peters DH, Garg A, Bloom G, Walker D, Brieger W, Rahman H:Poverty and access to health care in developing countries.Ann N Y Acad Sci2008, 1136:161–171.
34. Xu K, Evans D, Kawabata K, Zeramdini R, Klavus J, Murray C:Household catastrophic health expenditure: a multi-country analysis.Lancet2003, 362:111.
35. WHO:WHO Global Health Expenditure Database.2013. [http://apps.who.int/ nha/database/standardreport.aspx?id=rep_web_mini_template_web_ version&countrykey=84638] Accessed 2 June 2013.
36. Hou X, Chao S:Targeted or untargeted? The initial assessment of a targeted health insurance program for the poor in Georgia.Health Policy
2011,102(2):278–285.
37. Bauhoff S, Hotchkiss D, Smith O:The impact of medical insurance for the poor in Georgia: a regression discontinuity approach.Health Econ2011, 20(11):1326–1378.
38. UNICEF, USAID HSSP:Survey of Barriers to Access to Social Services in Georgia in 2010: Why Don’t all Poor Families get Social Benefits and Services? Survey
Report.2011. [www.unicef.org/georgia/BASS_final-eng.pdf] Accessed 25 December 2011.
39. Gotsadze T:Rationalizing Pharmaceutical Expenditures in Georgia. Position Paper.2011, [http://www.psidiscourse.ge/files/files/pdfs/ Rationalization%20of%20the%20Pharmaceutical%20Expenditures%20in% 20Georgia.pdf] Accessed 4 June 2013.
40. Chamber of Control of Georgia:Audit for the State-Run Health Insurance Program. 2011. [Available: http://sao.ge/news/273] Accessed 25 December 2011.
41. Selvavinayagam T, Vijayakumar S:Overview of publicly funded health insurance: Tamil Nadu model.Indian J Community Med2012,37(3):194–196. 42. Georgia Insurance Association:Georgia Insurance Association.2013,
[http://www.insurance.org.ge/index.php?a=main&pid=215&lang=eng] Accessed 2 October 2013.
43. MoLHSA:Strategic Health Plan for Georgia 2000–2009.Tbilisi: Ministry of Labour, Health and Social Affairs of Georgia; 1999.
44. OSGF:Independent Georgia: social protection and health care systems. Analytical Review.2012, [http://www.osgf.ge/files/publications/ Analytical_Review_Final_Edited_March_2012.pdf] Accessed 5 March 2012.
doi:10.1186/1478-4505-11-45
Cite this article as:Zoidzeet al.:Promoting universal financial protection: health insurance for the poor in Georgia–a case study.
Health Research Policy and Systems 11:45.
Submit your next manuscript to BioMed Central and take full advantage of:
• Convenient online submission
• Thorough peer review
• No space constraints or color figure charges
• Immediate publication on acceptance
• Inclusion in PubMed, CAS, Scopus and Google Scholar
• Research which is freely available for redistribution