ASSESSING AND MITIGATING THE IMPACTS OF DYNAMIC
MESSAGE SIGNS ON HIGHWAY TRAFFIC
Miao Song1, Jyh-Hone Wang2, Sam Cheung3, Merve Keceli4
1 Virginia Tech Transportation Institute, Blacksburg VA, USA
2 Department of Mechanical, Industrial and Systems Engineering, University of Rhode Island, Kingston RI, USA 3 U.S. Coast Guard Research and Development Center, New London CT, USA
4 Google, Mountain View, CA, USA
Received 5 January 2016; accepted 29 February 2016
Abstract: As a critical component in Intelligent Transportation Systems (ITS) of modern traffic management, dynamic message signs (DMS) are widely used in many countries as an effective means to provide motorists with up-to-date information regarding accidents, congestion, road conditions and travel time, etc. However, it was observed in traffic data that motorists tended to slow down when approaching active DMSs and speed up after passing these signs. The speed variations could pose safety hazards to other motorists on highways. To gain insights into this issue and understand associated causes and risks, a human factors study was conducted to help ease the speed variation when approaching DMSs. The effect of DMS messages on traffic approaching and passing the signs were assessed by analyzing highway traffic data near DMSs. A questionnaire survey was conducted to identify associated causes and risks. Participants were further surveyed about their preferences on DMS characteristics such as message category, message type, number of frames, message details, and the use of graphics. Individual drivers’ responses to various DMS designs were evaluated through a simulation test. This study has provided updated knowledge regarding the effects of DMSs on highway traffic and has identified measures to improve the design and display of DMS messages to help ease the speed variation of approaching traffic.
Keywords: dynamic message sign, variable message sign, ITS, speed variation, driving simulation, graphic-aided message.
1. Introduction
Dynamic message signs (DMS) or variable message signs (VMS), have been widely used as a critical component in Intelligent Transportation Systems (ITS) of modern traffic management. In Rhode Island alone, 13 overhead dynamic message signs are currently in service on major highways. W hile DMSs are providing real-time information and assistance to drivers, they demand drivers’ attention off the road. Moreover, drivers often felt compelled to
read and comprehend presented information on the sign with limited time. As a result, drivers are likely to slow down when approaching active DMSs and speed up after passing them. Speed variations in a short period of time could introduce safety hazards on highways. This study intends to assess the impact of active DMSs on highway traffic and explore potential countermeasures.
messages (accidents, disabled vehicles, unplanned lane/tunnel/bridge closures etc .), I n for m at ive/Com mon R oad Conditions messages (roadwork closures, delays, congestions, travel time etc.), and Regulatory/Non-Traffic Related messages (work zone speeds, seatbelt use, cell phone regulations, motorcycle awareness, etc.). In order to broadcast important/critical traffic information and advisories to drivers in a timely manner, DMSs are designed to attract drivers’ attention from driving by using overhead/roadside display, bright color and/ or dynamic messages. It has been found that the majority of drivers worldwide notice the existence of DMSs, identify that DMSs are providing very useful information, and act accordingly (Benson, 1996; Bonsall, 1992; Peng et al., 2004; Tarry and Graham, 1995).
Si nce d r ivers a re ex pect i ng usef u l information from active DMSs and time available for them to read the messages is limited, they usually slow down to gain extra time to read and comprehend the messages (Harder et al., 2003; Wang et al., 2009; Spell et al., 2014). To compensate for their speed reduction for reading messages, drivers speed up immediately after passing DMSs (Boyle and Mannering, 2004; Wang et al., 2009). The consequences of speed variations in a short time window could be severe and pose a threat to other vehicles because crashes are highly correlated to driving speed (Hauer, 1971; Lave, 1985; Rodriguez, 1990; Solomon, 1964; TRB, 1998). Let alone the distraction itself caused by some DMSs is safety critical (Harder et al., 2003; Harder and Bloomfield, 2008).
It is arguable that the impacts of DMSs on traffic vary by situation. For example, when drivers encountered a new DMS message, they were more likely to have a
larger deviation in speed, implying that drivers tend to pay more attention to new information posted on the sign, and as a result, more time is needed to process the information. Moreover, when a DMS is displaying the same message for a long period of time, drivers become familiar with it and thus less time is needed to read it (Boyle and Mannering, 2004). However, extending the display time of a DMS message, when it is no longer relevant, can cause confusion to drivers as well as a loss of public trust in the intelligent transportation system. In order for DMSs to be used effectively by transportation authorities, DMS messages should only provide updated information to drivers (Dudek, 2004).
2. Study Approaches
This study was conducted to assess the impacts of DMSs on highway traffic, identify the causes of these impacts, obtain drivers’ preferences regarding DMS messages, and ultimately provide improved DMS message designs as a solution to mitigate the impacts of DMSs. The study consisted of a three-prong approach, a traffic data analysis, a driver questionnaire survey, and a driving simulation experiment. A description of each part of the approach is given below.
2.1. Traffic Data Analysis
To gain an understanding of the impact of DMSs, traffic data were collected and analyzed. A traffic study was conducted to collect traffic data such as mean volumes and speeds in 5-minute increments. Those traffic data were gathered by several mobility technology units (MTUs) near DMSs along I-95 in Rhode Island between June 1st and June 14th in 2007 when messages
were displayed. The actual messages displayed during this period were all text-only messages covering accidents, disabled vehicles, unplanned lane closure, roadwork closures, delays, and reduced speeds. The study first compared “pre-display” and “first 5-min” in a before-and-during analysis. Speed reduction was reported in ten of the sixteen cases with four being statistically significant. Supplementary analysis of the second pair of 5-minute intervals (“last 5-min” and “post-display” ) demonstrated that speed increases occurred in seven of the sixteen cases, with two of them being significant. To determine the extent of speed variation caused by active DMSs, same traffic data were re-analyzed using 30-minute increments in this study. In addition to average volume (vehicles per minute) and average speed (km/h), average vehicle range (m) was also analyzed in each of the four time periods (Fig. 1) for each message display. It is hypothesized that when DMS is active, both speed and vehicle range would reduce while volume would increase.
Fig. 1.
An Illustration of Initiating Stage and Ending Stage Analysis
Two approaches were employed in this analysis, one based on the length of DMS display and the other based on the time of day in which the DMS was displayed. In
minutes at a time and DMS message displays that were active for greater than 30 minutes at a time. In the second approach, data were divided into two groups according to the time of display during the day. There were message displays that were active during “rush hours” (6AM - 9AM and 4PM - 7PM) and message displays that were active during “non-rush hours” (other time periods during the day). In each approach, two hypotheses using paired t-test were employed. They were called respectively the “initiating stage analysis” and “ending stage analysis”.
In the initiating stage analysis, data collected in “pre-display period” (30 minutes before the start of display) and “first 30-min” (30 minutes after the start of display) were compared. In the ending stage analysis, data collected in “last 30-min” (30 minutes prior to the end of display) and “post-display period” (30 minutes after the end of display) were considered (see Fig. 1).
2.2. Driver Questionnaire Survey
To gain an understanding of the impact of DMSs from drivers’ perspectives, a questionnaire survey was designed and conducted. It intended to help identify causes of the impacts of active DMSs on highway traffic and to gain insights about drivers’ preferences on various DMS message design and display features.
2.2.1. Survey Design
The survey contained 24 multiple-choice questions designed to collect drivers’ opinions on slow-downs and DMS. The first six questions were employed to identify the causes of slow-downs in general and those associated with DMS designs. The remaining questions were used to assess
drivers’ opinions and preferences regarding various DMS message design and display features. Each question, presented with text and graphic DMS messages, was designed to assess a single feature with multiple DMS displays as possible choices. These features included message category (danger warning, informative, and regulatory messages), message type (text-only, graphic-aided with full text, and graphic-aided with partial text message), and number of frames used to display the same message (single frame vs. two-frame). The questionnaire survey was designed using Microsoft PowerPoint with Visual Basic macros. Either a single answer or multiple answers were expected from the participants when they were answering each question.
2.2.2. Participants
The survey was conducted at multiple public locations in Rhode Island in order to obtain a representative sample of the Rhode Island driving population. DMV office, mall, and university campus were among the locations where the survey took place. A total of 150 licensed drivers participated in the survey voluntarily. Among them, 75 were between 18 and 40 years old, 39 were between 41 and 60, and 36 were older than 60. There were 71 females and 79 males. Age and gender percentages of the survey participants followed those of the Rhode Island population.
2.3. Driving Simulation Experiment
2.3.1. Driving Simulation Video
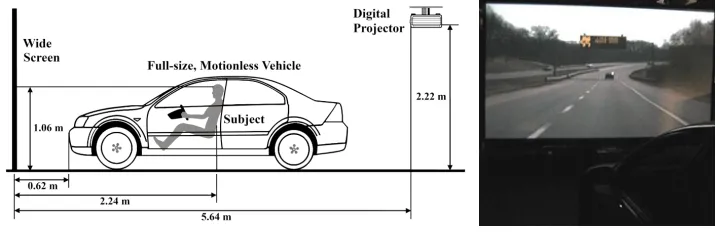
A 30-second baseline video was recorded while the subject vehicle was driving southbound on RI Rte. 4 at approximately 80 km/h (50 mph). In this video, a blank overhead DMS board (Fig. 2) was approached from about 700 meters away and passed. During post process, all selected test messages were resized
and superimposed to fit onto the blank DMS board in the baseline video frame by frame, and then rendered back into test videos (one video per message). In a completed test video, a DMS message first appeared as a small dot and gradually increased in size as the vehicle approached the “active” DMS. The message would be visible from around 800 meters and become legible within 200m (MUTCD, 2009).
Fig. 2.
The DMS on RI Rte. 4 Recorded in the Baseline Video Source: Google Map
2.3.2. Experiment Design
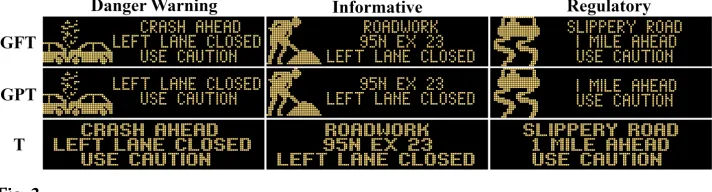
Two main factors, message category and message type, were considered in a factorial experiment with three repetitions. Message category contained three groups according to their contents: danger warning, informative, and regulatory. Message type, the other main
factor, governs how the message was displayed. There were three settings, a graphic-aided message with full text (GFT), a graphic-aided message with partial text (GPT), and a text message with no graphic (T). Each of three message categories was included with three message types (GFT, GPT, and T), creating a total of nine test messages (see Fig. 3).
Fig. 3.
The message contents were directly adopted from the actual messages presented during the traffic data collection period and the message signs were automatically generated using the VanGuard control software package by Daktronics, a DMS manufacturer. It should be noted that text which appeared in GFT and GPT messages was single stroke but appeared as double stroke in T messages.
To control the learning effect, three additional messages (irrelevant, one in each message type) were added to the message collection. Each message had three repetitions totaling 36 separate trials (9 x 3 + 3 x 3 = 36) which were presented in a random order. There are two blocking factors, age (three groups: 18-40, 41-60, and above 60) and gender (male, female) considered in the experiment.
A few practice trials were given to ensure participants’ readiness prior to the actual simulation. Both response time and accuracy were collected in the experiment where
response time was defined as the duration between the start of the video and the moment when a response button was pressed.
2.3.3. Participant and Apparatus
A total of 36 drivers with valid driver’s licenses participated in the driv ing simulation test. They are evenly distributed in age and gender groups with six males and six females in each of the three age groups. Fig. 4 shows a schematic view of the laboratory setup for the test. Participants sat in a fix-base vehicle (Ford Taurus) and were asked to respond by pressing one of the four response buttons which were mounted on the steering wheel. Participants were instructed to press associated buttons as soon as they comprehended the messages (“1” if a roadwork message was observed, “2” for a crash message, “3” for a slippery road message, and “4” if other messages were observed). Simulation videos were projected onto the screen via a digital computer projector (see Fig. 4).
Fig. 4.
3. Results
3.1. Traffic Data Analysis
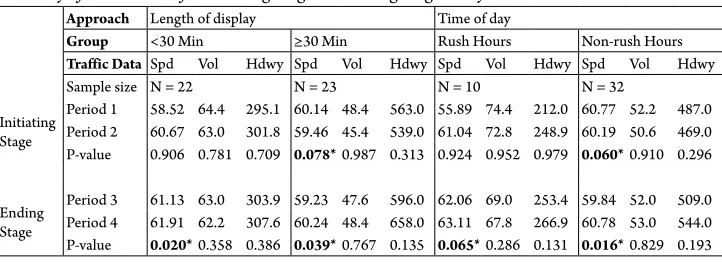
Table 1 shows the results of the traffic data analysis in both approaches in terms of speed, volume, and headway distance. No significant difference was observed in average volume and headway distance when comparing an active DMS with an inactive one. But average speed was significantly lower when DMS was active. It also found that speed variations in traffic were not noticeable when the DMS messages were displayed less than 30 minutes as well as when DMS messages were displayed during rush hours in the “initiating stage analysis”. The speed variations were
observed in all the cases of the “Ending stage analysis” evidenced by a significant increase in the average speed. As for DMS message displays that were active for greater than 30 minutes, drivers decreased their speed and headway distance as they approached active DMSs in the “initiating stage analysis” and increased their speeds and headway distances in the “ending stage analysis.” This was also observed when DMS messages were active during non-rush hours. The decrease in both speeds and headway distances in the “initiating stage analysis” and the increase in both speeds and headway distances in the “ending stage analysis” provided evidence of the impacts of active DMSs on highway traffic.
Table 1
Summary of Paired t-tests for Initiating Stage and Ending Stage Analyses
Approach Length of display Time of day
Group <30 Min ≥30 Min Rush Hours Non-rush Hours
Traffic Data Spd Vol Hdwy Spd Vol Hdwy Spd Vol Hdwy Spd Vol Hdwy
Sample size N = 22 N = 23 N = 10 N = 32
Initiating Stage
Period 1 58.52 64.4 295.1 60.14 48.4 563.0 55.89 74.4 212.0 60.77 52.2 487.0 Period 2 60.67 63.0 301.8 59.46 45.4 539.0 61.04 72.8 248.9 60.19 50.6 469.0 P-value 0.906 0.781 0.709 0.078*0.987 0.313 0.924 0.952 0.979 0.060*0.910 0.296
Ending Stage
Period 3 61.13 63.0 303.9 59.23 47.6 596.0 62.06 69.0 253.4 59.84 52.0 509.0 Period 4 61.91 62.2 307.6 60.24 48.4 658.0 63.11 67.8 266.9 60.78 53.0 544.0 P-value 0.020*0.358 0.386 0.039*0.767 0.135 0.065*0.286 0.131 0.016*0.829 0.193 * Significant @ α = 0.1
3.2. Driver Questionnaire Survey
When participants were asked about the general causes of slow-downs on highways, the top choices were weather, poor visibility, roadwork, crashes, police vehicles, congestion, and DMSs. When asked about which traffic signs they were likely to ignore while driving on highways, temporary road signs were picked over active DMSs. When participants were asked whether they would
indicated that they did not read the DMS messages because they were distracting. Answers obtained from the above questions indicated that most drivers paid attention to DMSs while driving and active DMSs did cause speed variations.
When asked about the issues associated with DMS designs that could cause difficulty in their reading and understanding of the messages, the top choices were lengthy messages, complexly worded messages, abbreviated messages, and unfamiliar messages. They also indicated that poor visibility, poor weather conditions, distractions on the road, and driving at high speed could make it difficult to read and understand DMS messages. The majority of participants (46%) indicated that danger warning messages received most of their attention, followed by informative (30%) and regulatory messages (24%).
When participants were asked about their preferences on message types, text-only messages were preferred (44%) over graphic-aided messages with full text (34%) and graphic-aided messages with partial text (22%). Text-only messages were particularly preferred by the majority of participants in the middle age group (41-60) and old age group (above 60).
Young participants (18-40), however, preferred graphic-aided messages (42%) over text-only messages (32%) and graphic-aided messages with partial text (26%). This finding is at odds with the common understanding that graphics are better than text because they can be identified easier
and more quickly from a further distance. The survey also indicated that participants preferred a single-frame message (58%) over a two-frame message (42%) if the same contents were displayed. While most participants preferred a two-frame message (59%) over a single-frame (41%) if the two-frame message gives more information and uses no abbreviations whereas the single-frame message contains less information and uses abbreviations.
To summarize, the majority of drivers i nd icated t hat t hey wou ld reduce speed when approaching active DMSs. Furthermore, lengthy, complexly worded, and abbreviated messages could cause drivers to slow down. It was also found that drivers preferred text-only messages over graphic-aided messages and single frame over two-frame messages if they displayed the same content. Finally, two-frame messages with more information were preferred over single-frame messages with less information and abbreviations.
3.3. Driving Simulation Experiment
Fig. 5.
Response Accuracy in the Simulation Test
Participants’ response time to DMS messages in the simulation test were collected and analyzed. Through the analysis of variance (ANOVA), it found that both main factors, message type (T) and message category (C); and blocking factors, age (A) and gender (G), were significant (see Table 2) in affecting drivers’ response time. The interaction between age and gender was significant but not the interaction between message type and message category.
Graphic-aided messages with partial text (GPT) had similar response time when
compared with text-only messages but its response time was much shorter than that of graphic-aided message with full text (GFT). This might be due to the fact that GFTs had more information on them and thus required longer response time.
Overall, young participants (age 18-40) responded the fastest among their peers; female participants responded faster than males except for the old age group; participants responded faster to danger warning messages than to other message categories. Fig. 6 shows these results.
Table 2
ANOVA Table of Response Time in the Simulation Test
Source DF Seq SS Adj SS Adj MS F P
T 2 65.084 66.543 33.271 15.78 0.000*
C 2 35.656 35.265 17.633 8.36 0.000*
T*C 4 4.154 4.154 1.038 0.49 0.741
A 2 683.232 682.895 341.447 161.97 0.000*
G 1 27.936 25.126 25.126 11.92 0.001*
A*G 2 56.607 58.596 29.298 13.9 0.000*
Error 855 1802.41 1802.41 2.108
Total 868 2675.07
19.5 20 20.5 21 21.5 22 22.5
GFT GPT T
Res
po
ns
e T
ime (
sec
)
Message Type
19.5 20 20.5 21 21.5 22 22.5
Danger
Warning Informative Regulatory
Res
po
ns
e T
ime (
sec
)
Message Category
19.5 20 20.5 21 21.5 22 22.5
18-40 41-60 60+
Res
po
ns
e T
ime (
sec
)
Age
Female Male
Fig. 6.
Main Effect Plots (Top) and Interaction Plot (Bottom) of the Simulation Test
4. Discussion
A traffic data analysis, a driver questionnaire survey, and a driving simulation experiment were employed in this study to assess the impacts of active DMSs on highway traffic and identify potential means to mitigate the impacts.
The speed variation caused by active DMSs was confirmed by the traffic data analysis. Significant speed changes of traffic were observed regardless of the length of DMS display or time of day at which the DMS was displayed. This indicated that drivers did slow down when approaching active DMSs and sped up when they passed the signs. Through the driver questionnaire survey, it identified the causes of the speed changes, and obtained participants’ preferences on and responses to different DMSs. The
findings of the survey first indicated that the majority of drivers would reduce their speed when approaching active DMSs, especially elder drivers. Lengthy, complexly worded, and abbreviated messages could cause drivers to slow down.
“informative,” and “regulatory” messages. This agreed with the questionnaire survey where “danger warning” messages attracted most participants’ attention, followed by “informative,” and “regulatory” messages. The results of the simulation, however, found that participants responded faster to graphic-aided messages with partial text (GPT), followed by full text (T) messages, and graphic-aided messages with full text (GFT). This differs from the conclusions drawn from the survey when text-only (T) messages were the most preferred, followed by graphic-aided messages with full text (GFT), and graphic-aided messages with partial text (GPT).
Although graphics may not be well accepted by drivers to be used in DMS messages as indicated by the survey, graphic-aided messages with partial text did show promising results by producing quicker response and higher response accuracy in the driving simulation experiment.
5. Conclusion
This study evaluated the impacts of active DMSs through both a static (survey) environment and a dynamic (real traffic) environments and explored and evaluated possible remedies through a driver questionnaire survey and a driving simulation experiment. Speed variations were observed in both environments when approaching active DMSs. While the survey results showed that text-only messages (T) were the most preferred by participants, the study’s driving simulation experiment suggested a graphic-aided DMS message with partial text (GPT). This proposed display could shorten the response time the most and possibly help ease the speed changes. It is believed that the results gathered
from the simulation could more accurately reflect a driver’s response in real driving. It is recommended to adopt graphic-aided DMS messages with partial text to mitigate the impacts of active DMSs on highway traffic.
Although participants’ response time and accuracy were assessed through the driving simulation experiment, the fact that they were not actually driving limited our ability to eventually verify the effects of different DMS messages designs on driver’s speed maintenance and distraction. Future studies are necessary to examine individual drivers’ driving performance and eye glance when approaching various active DMSs in naturalistic driving environment.
Follow-up field studies could be conducted to assess the influence of various DMS messages on overall traffic dynamic. Findings from this study will be shared with the transportation authorities regarding effective means to ease the impacts of active DMSs on highway traffic.
Acknowledgements
The authors would like to thank the University of Rhode Island Transportation Center (URITC) and the Rhode Island Department of Transportation (RIDOT) for their support and guidance in this study.
References
Benson, B.G. 1996. Motorist attitudes about content of variable message signs, Transportation Research Record, 1550: 48-57.
Boyle, L.N.; Mannering, F. 2004. Impact of traveler advisory systems on driving speed: some new evidence, Transportation Research Part C: Emerging Technologies, 12(1): 57-72.
Bruce, D.; Boehm-Davis, B.H.; Mahach, K. 2000. In-vehicle auditory display of symbolic information. In Proceedings of the 14th Triennial Congress of the International Ergonomics Association and the 44th Annual Meeting of the Human Factors and Ergonomics Society, 230-233.
Conference of European Directors of Roads (CEDR). 2003. Action FIVE - Framework for Harmonized Implementation of Variable Message Signs in Europe. LV-SE2000 0826.
Dudek, C.L. 2004. Changeable Message Sign Operation and Messaging Handbook, Report FHWA-OP-03-070, Federal Highway Administration, Texas Transportation Institute.
Hanowski, R.J.; Kantowitz, B.H. 1997. Driver memory retention of in-vehicle information system messages, Transportation Research Record, 1573: 8-18.
Harder, K.A.; Bloomfield, J.R.; Chihak, B.J. 2003. The Effectiveness and Safety of Traffic and Non-traffic Related Messages Presented on Changeable Message Signs, Publication MN/RC-2004-27, Minnesota: Minnesota Department of Transportation.
Harder, K.A.; Bloomfield, J.R. 2008. The Effectiveness and Safety of Traffic and Non-Traffic Related Messages Presented on Changeable Message Signs-Phase II. Minnesota Department of Transportation, Minneapolis.
Hauer, E. 1971. Accidents, overtaking and speed control, Accident Analysis and Prevention, 3(1): 1-12.
Lave, C.A. 1985. Speeding, coordination, and the 55 mph limit, The American Economic Review, 75(5): 1159-1164.
The Manual on Uniform Traffic Control Devices. 2009. Federal Highway Administration, U.S. DOT.
Peng, Z.R.; Guequierre, N.; Blakerman, J.C. 2004. Motorist response to arterial variable message signs, Transportation Research Record, 1899: 55-63.
Rodriguez, R.J. 1990. Speed, speed dispersion, and the highway fatality rate, Southern Economic Journal, 57(2): 349-356.
Solomon, D. 1964. Accidents on Main Rural Highways Related to Speed, Driver and Vehicle, Federal Highway Administration, U.S Department of Transportation.
Spell, B.A.; Ardeshiri, A.; Jeihani, M. 2014. Speed Pattern Analysis in the Proximity of Dynamic Message Signs Using a Driving Simulator. In Proceedings of Transportation Research Board 93rd Annual Meeting, No. 14-5486.
Tarry, S.; Graham, A. 1995. The role of evaluation in ATT development, Traffic Engineering and Control, 36(12): 688-693.
Transportation Research Board. 1998. Managing Speed: Review of Current Practices for Setting and Enforcing Speed Limits - Special Report 254, Effects of Speed, DC, USA.
Ullman, B.R.; Dudek, C.L.; Trout, N.D.; Schoeneman, S.K. 2005. Amber Alert, Disaster Response and Evacuation, Planned Special Events, Adverse Weather and Environmental Conditions, and other Messages for Display on Dynamic Message Signs, Federal Highway Administration, Texas Department of Transportation.
Wang, J.H.; Keceli, M.; Maier-Speredelozzi, V. 2009. Effect of dynamic message sign messages on traffic slowdowns. In Proceedings of Transportation Research Board 88th Annual Meeting, 1-16.